by Don Vialoux, EquityClock.com
Upcoming US Events for Today:
- The Case-Shiller 20-city Index for June will be released at 9:00am. The market expects no change (0.0%) on a year-over-year basis versus a decline of 0.7% previous.
- Consumer Confidence for August will be released at 10:00am. The market expects 65.8 versus 65.9 previous.
- The Richmond Fed Manufacturing Index will be released at 10:00am. The market expects –10 versus –17 previous.
Upcoming International Events for Today:
- German Consumer Confidence for September will be released at 2:00am EST. The market expects 5.8 versus 5.9 previous.
The Markets
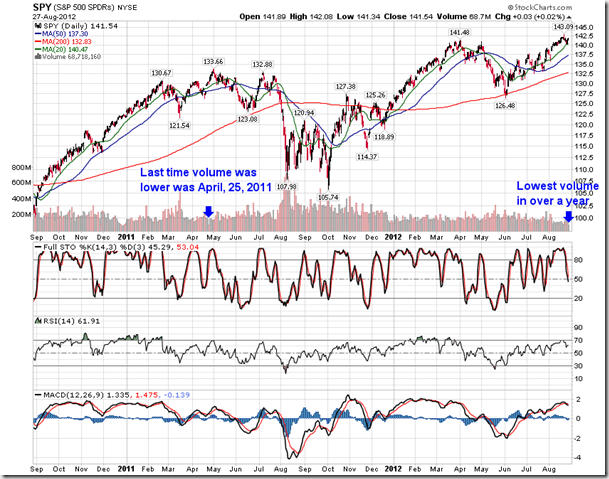
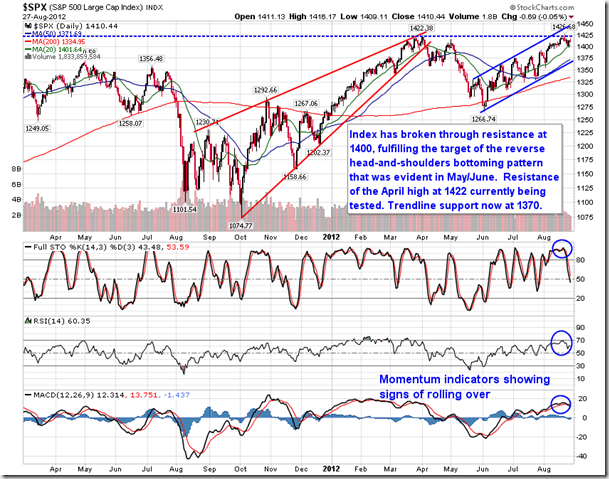
Equity markets traded around the flatline on Monday, unable to maintain earlier gains as investors positioned themselves ahead of the much anticipated Jackson Hole speeches at the end of this week. Further monetary easing is the expectation; actual results could reveal a range of possibilities, making it almost pointless to dwell too much on economic fundamentals or equity market technicals as the next market move will likely be predicated on upcoming central bank announcements. Volume on Monday remained light as investors avoided making any significant moves. Volume of the S&P 500 ETF (SPY) once again charted the lowest levels in over a year as conviction continues to elude this market. Apirl 25 of 2011 was the last time the volume in this ETF was lower. The market peaked soon thereafter, falling into a summer swoon that lasted until October.
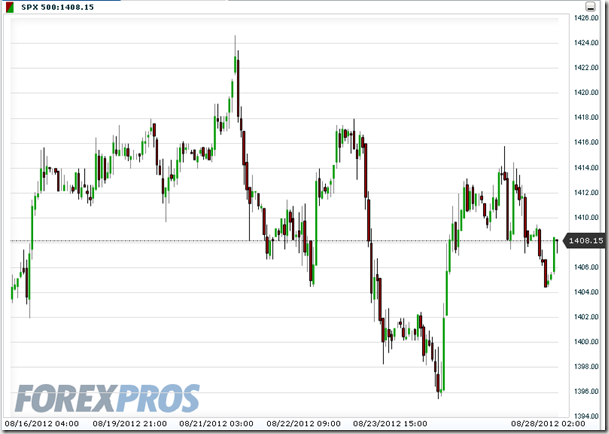
Looking at an hourly chart of the S&P 500 futures shows that a negative trend is becoming established. The characteristic profile of lower-highs and lower-lows is becoming obvious as buyers refrain from pushing the tape higher ahead of the central bank announcements. This trend is presently a short-term phenomena and has yet to make a considerable impact on the longer-term profile of the market.
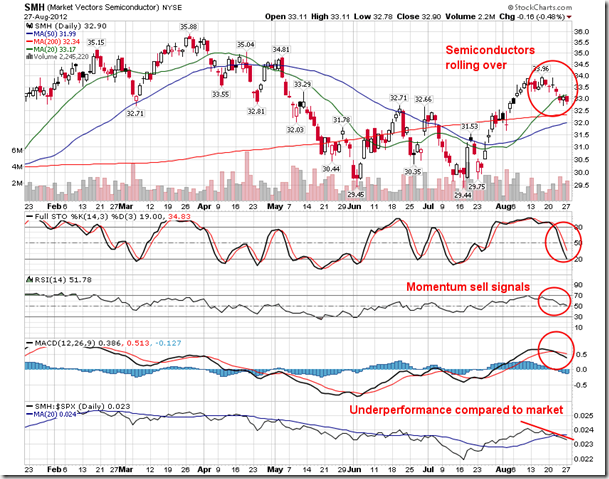
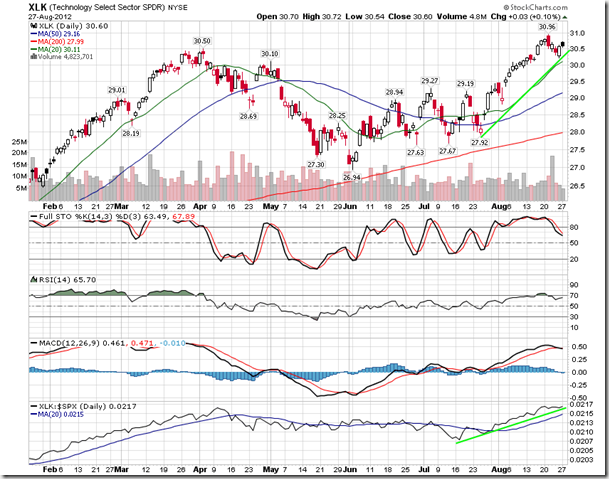
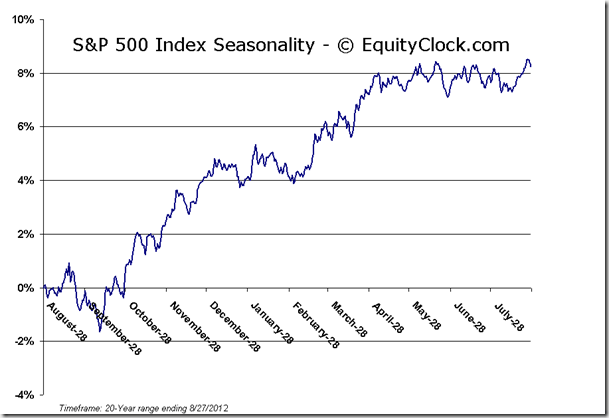
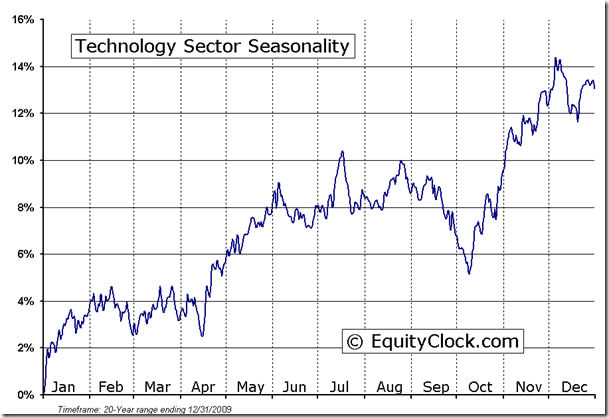
So in yesterday’s report we started to provide some warning signals based on some technical indicators that suggest reason to be cautious. Further indications will be provided over the course of the week leading into this Friday’s Jackson Hole speech by Ben Bernanke and Mario Draghi’s speech to follow on Saturday. So here is today’s warning signal. Technology has been praised with adding considerable strength to equity markets over the past month as Apple charts new historical highs. Strength in this cyclical sector is a bullish sign for broad markets due to, among other things, the weighting and influence the companies in this space have on equity indices, such as the S&P 500. However, if the technology sector in general is indicative of the broad market due to the influence it has on it, then semiconductors are indicative of the conviction to the sector: conviction that has been falling off over the last couple of weeks. The Semiconductor ETF (SMH) is showing definitive signs of rolling over, breaking through its 20-day moving average and producing sell signals with respect to Stochastics, RSI, and MACD. Underperformance compared to the market is becoming obvious. Semiconductors are often looked to as the high beta (risk-on) component to the technology sector and as investors start shedding risk, it typically implies a negative event ahead as conviction to hold risk assets falls. On Monday, the recent divergence between the Technology sector and the Semiconductor industry continued as the sector charted gains while the industry charted declines. The Technology sector seasonally declines between now and the beginning of October before beginning a period of seasonal strength that runs through to January/February.
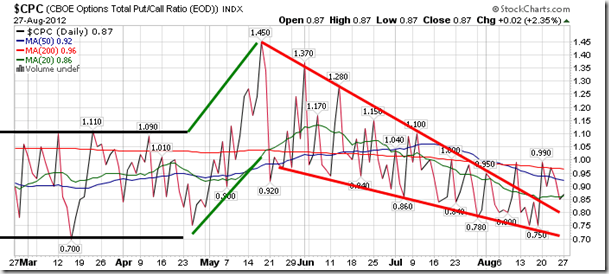
Sentiment on Monday, as gauged by the put-call ratio, ended bullish at 0.87.
Chart Courtesy of StockCharts.com
Chart Courtesy of StockCharts.com
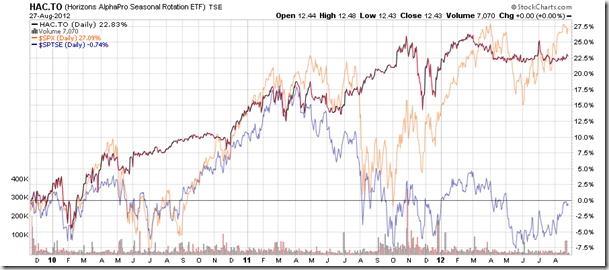
Horizons Seasonal Rotation ETF (TSX:HAC)
- Closing Market Value: $12.43 (unchanged)
- Closing NAV/Unit: $12.45 (down 0.01%)
Performance*
| 2012 Year-to-Date | Since Inception (Nov 19, 2009) | |
| HAC.TO | 2.22% | 24.5% |
* performance calculated on Closing NAV/Unit as provided by custodian
Click Here to learn more about the proprietary, seasonal rotation investment strategy developed by research analysts Don Vialoux, Brooke Thackray, and Jon Vialoux.
Copyright © EquityClock.com


