by Don Vialoux, Timingthemarket.ca
Upcoming US Events for Today:
- The Dallas Fed Manufacturing Survey will be released at 10:30am. The market expects –6.0 versus –13.2 previous.
Upcoming International Events for Today:
- German Business Climate Index for August will be released at 4:00am EST. The market expects Economic Sentiment to show 102.3 versus 103.3 previous.
The Markets
Equity markets rebounded on Friday, almost erasing all of the previous days losses as investors once again grew optimistic that the Federal Reserve would initiate another round of easing. CNNMoney.com reports that “investors were reacting to a letter sent by Federal Reserve Chairman Ben Bernanke to the chairman of the House oversight committee, Rep. Darrell Issa, that said the central bank has more room to support the economy.” Investor speculation will be answered one way or another as Ben Bernanke delivers his annual speech in Jackson Hole on Friday and the ECB will deliver its latest monetary policy announcement next week. The risks, both to the upside and the downside, remain profound. If speculation is not answered with decisive action from central banks around the world, equities could easily lose all of the momentum gained in the month of August, falling back towards the lows of the summer. On the other hand, equities could also break overhead levels of resistance if further monetary stimulus forces the reflation trade. Upcoming announcements from central bank officials will likely take precedent over the trading activity in the week ahead as investors position themselves accordingly for either scenario.
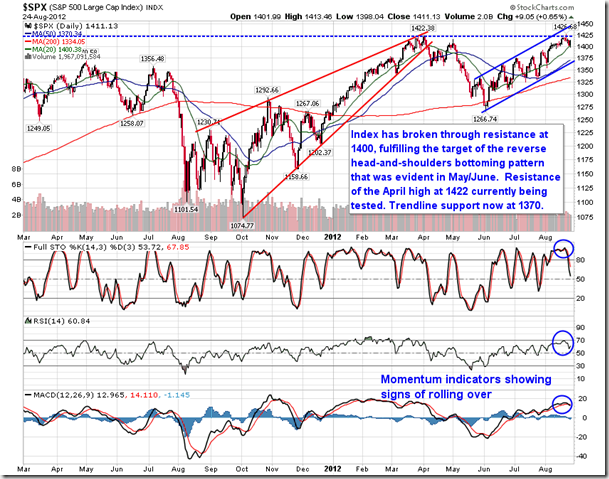
The technicals of the market are just as mixed as analysts expectations pertaining to upcoming monetary policy announcements. Tuesday saw a key reversal day in which markets opened higher, breaking resistance, then selling off through the remainder of the day to finish lower, exceeding the previous day’s trading range. Then Thursday saw the biggest declining session for equities in about a month. Yet, through this seemingly significant activity on the week, benchmarks, such as the S&P 500 Index, continue to hold above significant moving averages (20, 50, and 200-day). Cyclical sectors continue to outpace defensives. And commodities, such as Gold and Silver, are breaking out above levels of resistance as investors place bets on simulative monetary policy. But, at the same time, other technical indications are questionable.
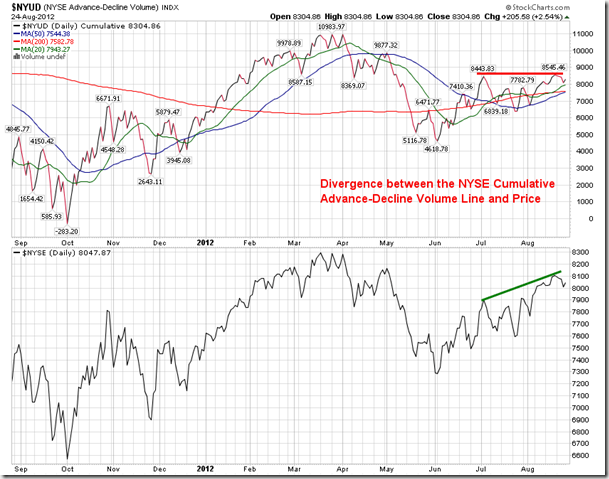
Everyone is well aware of the dismal market volumes, which suggest a severe lack of conviction to equities at present. This lack of volume is causing the NYSE Advance-Decline Volume line to show a fairly clear divergence compared with price. Typically the chart profiles of the two closely resemble one another, but over the past two months the AD Volume line has been flat while equity prices have moved firmly higher. The warning sign that the recent lack of conviction implies should be obvious.
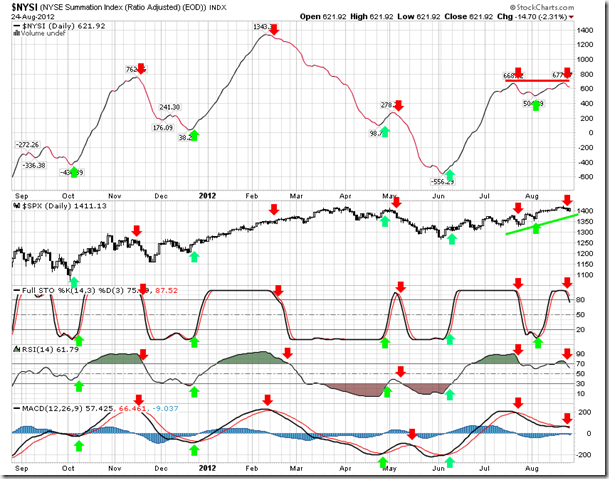
And another indication of breadth that we closely follow is also suggesting caution. The NYSE Summation Index can often provide good leading buy and sell signals for broad market trends. As technical momentum indicators such as RSI, MACD, and Stochastics, produce respective sell indications, the market has been shown to sell off soon thereafter, such as in May of this year and November of 2011. However, it can also be early. In February of this year and even just a few weeks ago in July when similar sell signals were flashed, equities still pushed higher. The suggestion remains that a correction is more likely than not as breadth deteriorates. Another sell signal was flashed last week and the trend in this gauge of breadth has been flat since the last sell signal, once again generating a potential warning signal.
So the word of the day is resistance, a level that is restraining price action from breaking out above a previous trading range
. Resistance is being realized across multiple time horizons for equities, currencies, and bond yields, each of which imply a pullback/pause in equity markets is reasonable around present levels.
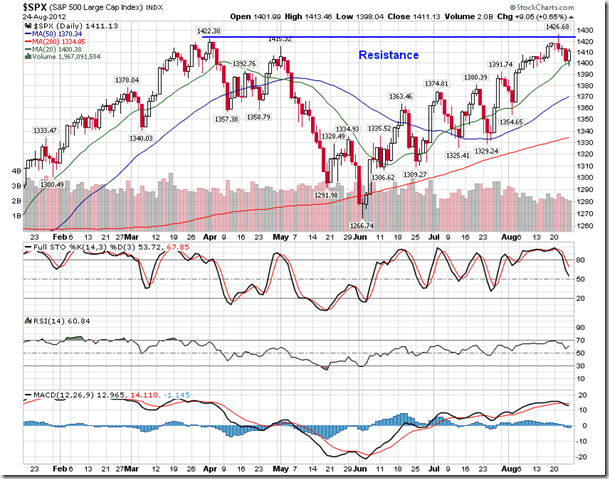
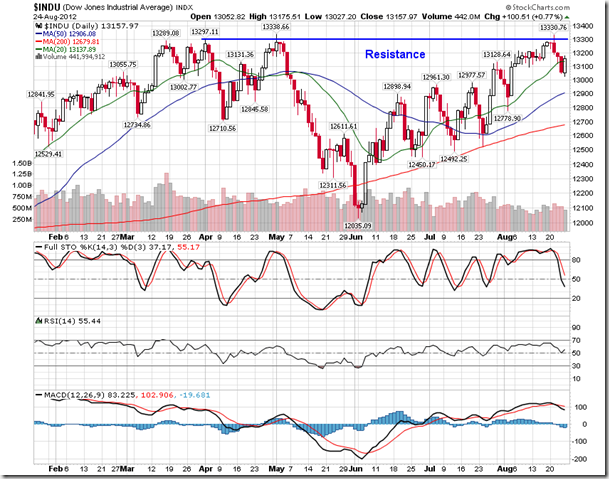
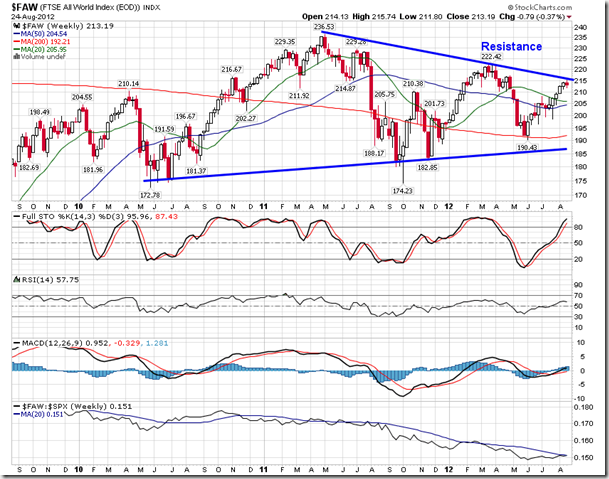
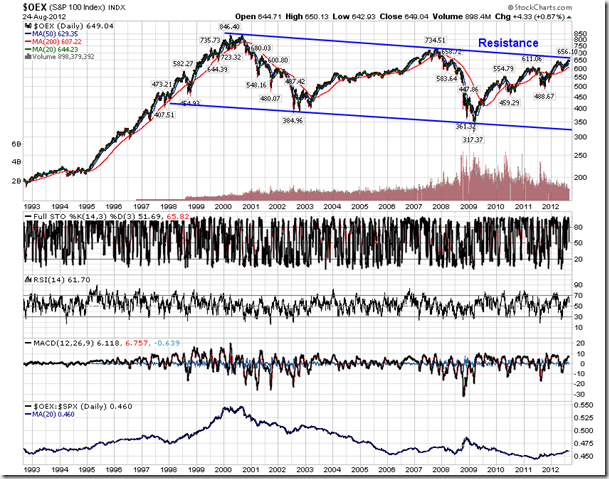
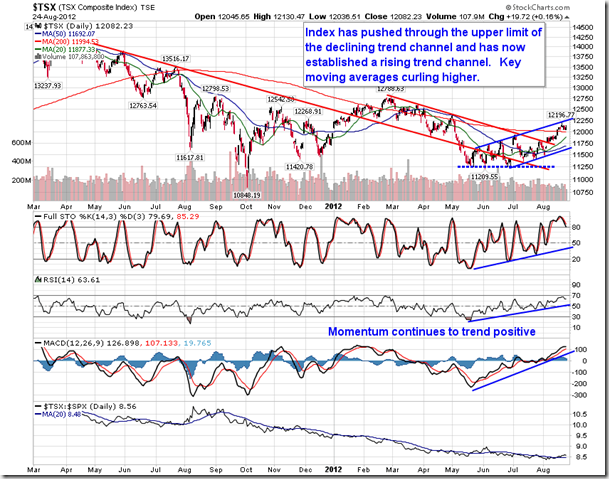
Equity market resistance is obvious. Resistance at previous year-to-date highs for the S&P 500 and Dow Jones Industrial Average were tested last week. The FTSE All-World Index is struggling at the upper limit of a triangle pattern. And the S&P 100 Index is holding near the upper limit of a multi-year declining trend channel. Equity investors are looking for a positive catalyst in order to break these levels, otherwise flat to negative trading may be the result, especially as we enter the most negative period of the year for equity markets in September and October.
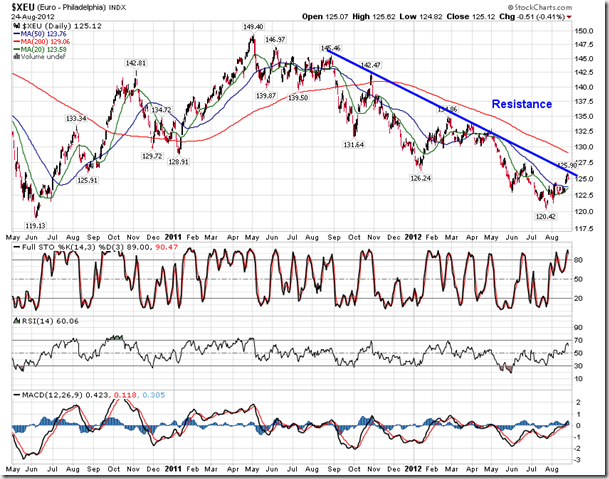
And seemingly confirming the equity market impediment is resistance in the Euro. Correlation of the Euro to the “risk-on” trade has been strong ever since the European debt crisis began. Last week the Euro tested long-term resistance presented by a declining 12-month trendline. The US Dollar, conversely, tested long-term support. Once again, a positive catalyst looks to be required in order to force a breakout.
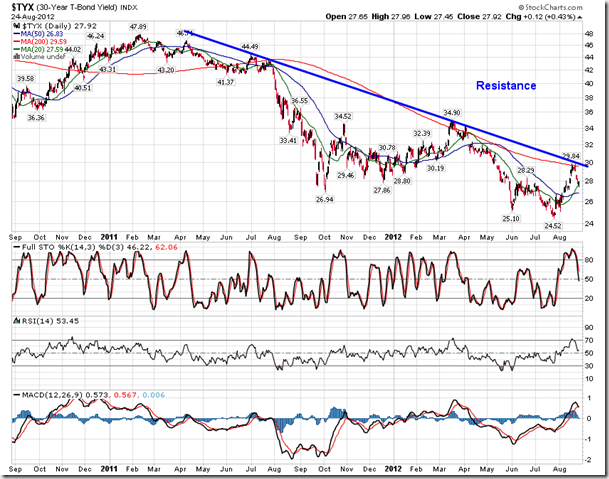
Even bond yields are bouncing off of resistance. Yields on the 30-year treasury firmly rebounded off of a declining 200-day moving average as well as a declining long-term trendline that has been intact for over a year. The pattern is consistent across 5 and 10-year bonds, suggesting investor reluctance to liquidating these safe-haven investments.
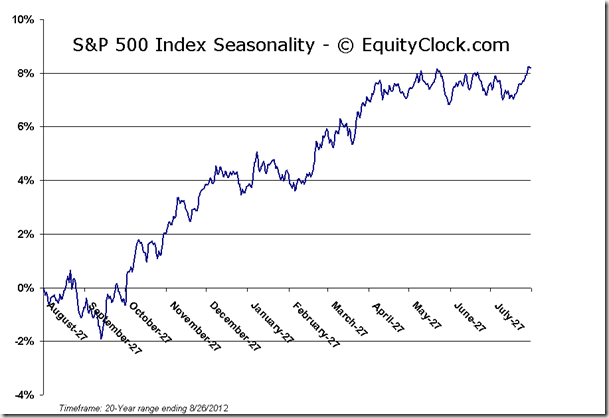
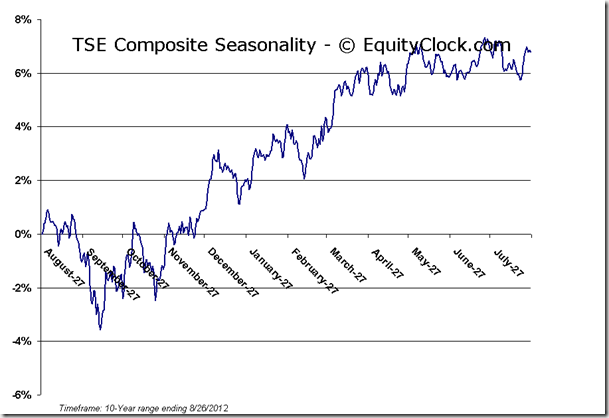
So although sell signals for equity markets have not become widely realized, this is hardly the place to buy either. Equities remain a hold with a strongly cautious bias. Seasonal tendencies do not support gains over the coming month. Fundamentals are sluggish. And technicals show that markets are at a pivotal point. It will remain up to investors as to how much risk they intend to hold, knowing that upcoming events pertaining to central banks in the US and Europe could move equity markets in either direction.
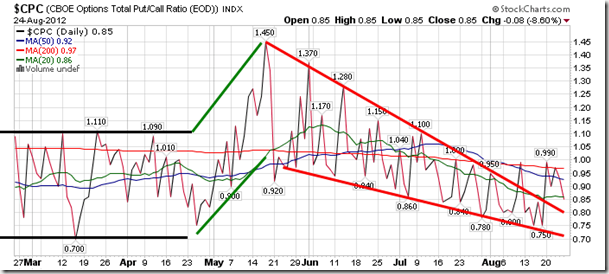
Sentiment on Friday, as gauged by the put-call ratio, ended bullish at 0.85. This sentiment gauge had been suggesting investor complacency prior to last week’s market declines, a situation that commonly precedes a correction. This indicator will warrant close attention into the end of this week in order to determine if complacency is high going into the central bank events at the end of this week and into next.
Chart Courtesy of StockCharts.com
Chart Courtesy of StockCharts.com
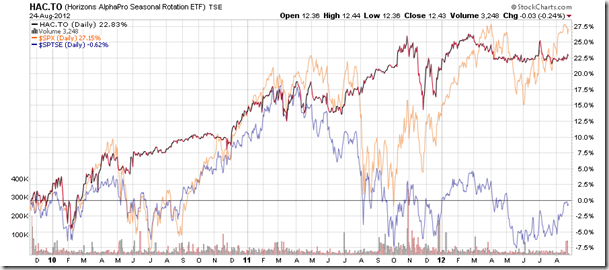
Horizons Seasonal Rotation ETF (TSX:HAC)
- Closing Market Value: $12.43 (down 0.24%)
- Closing NAV/Unit: $12.45 (up 0.08%)
Performance*
| 2012 Year-to-Date | Since Inception (Nov 19, 2009) | |
| HAC.TO | 2.22% | 24.5% |
* performance calculated on Closing NAV/Unit as provided by custodian
Click Here to learn more about the proprietary, seasonal rotation investment strategy developed by research analysts Don Vialoux, Brooke Thackray, and Jon Vialoux.


