"The system will hold together..."
by Jeffrey Saut, Chief Investment Strategist, Raymond James
February 13, 2012
“The system will hold together” is a line spoken by Maxwell Emory (played by Hume Cronyn) in the 1981 movie “Rollover.” The film centers on a plot whereby Mr. Emory, who is the chairman of First New York Bank, is secretly moving “the Arabs’” money out of U.S. dollars and into gold using a mysterious bank account numbered 21214. When the plot is discovered, gold prices soar, the stock market crashes, and Maxwell Emory puts a bullet through his head. I couldn’t help reflecting on that movie last week as rumors swirled that the Greek government may not be given the €133 billion loan needed to meet its long-term debt roll-over in March. If so, a Greek default becomes almost a certainty, and time is running out. Indeed, it will take a rather long time for all the authorities and lawyers to complete the paperwork. For example, EU officials, the ECB, the IMF, Germany, the Greek government, et all must sign off on the agreement and history suggests somewhere along the line difficulties will surface. Meanwhile, the Greek unions are rioting (again), punctuated by this statement from Yannis Panagopoulous, head of the largest private-sector Greek Union, “What is taking place is not a negotiation, it is blackmail!" The entire situation is reminiscent of a dog chasing its tail; the budget deficit hovers around 8% - 9% because Greece’s economy is collapsing. With the Greek elections looming in April the situation could quickly deteriorate into a sauvequi peut. So I shall say it again, as I have said for over a year, “Greece is going to default because the numbers just do not pencil. Whether it is in March 2012, or March 2013, is unknowable; but, Greece will default, hoisting the question – who’s next?”
Last week the equity markets revisited the Greek tragedy, and the “who’s next,” questions by recording their first down week this year. The result left the D-J Industrials (INDU/12801.23) down 0.47%, while the S&P Small Cap 600 Index (SML/453.00) surrendered 2.28%. In fact, of all the indices I follow only the NASDAQ 100 (NDX/2547.32) was higher on the week with a 0.72% gain. To readers of my missives this should have come as no surprise, for as scribed in last week’s strategy letter:
“That said, I turned more cautious a few weeks ago because stocks had become very overbought (read: too much bullishness) in the short-term, and most of the market’s internal energy had been expended in the upside dash from the October ‘lows’ into the recent mid-January ‘highs.’ The only question I posed was, ‘Is this going to be a sideways correction, or are we going to get more of a pullback?’ Whatever the pattern, I continued to suggest it would be a mistake to get too bearish. So far, it has been pretty much a sideways affair with the S&P 500 only 17 points above where it was when the Buying Stampede ended on January 25th. Still, the SPX is two standard deviations above its 50-day moving average (DMA) and consequently very overbought (again). Likewise, the McClellan Oscillator is back into overbought territory, many of the indices I follow are up against their respective downtrend lines as seen by connecting their May 2011 highs with their July highs, none of my short-term indicators are bullish, near-term performance following upside ‘gaps’ like last Friday’s (2/3/12) on the better than expected employment numbers typically has been poor, and there is the potential for a double-top in the DJIA, which would be negated with a close above 13250.”
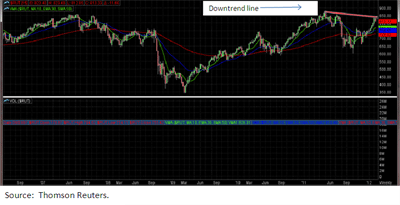
To update those comments for last week’s action it should be noted the McClellan Oscillator has fallen from its overbought condition to a more neutral position, but not as of yet oversold. Additionally, there is a divergence in the McClellan Oscillator such that the stock market’s breadth is declining even on “up” days. In the past this has foretold corrections. As for the S&P 500 (SPX/1342.64), it remains about two standard deviations above its 50-DMA. The downtrend lines, at least so far, seem to have contained the rally, as can be seen in the chart of the Russell 2000 on page 3 of this report. Further, the INDU broke to a new reaction high (above the May 2011 high) last week, but the D-J Transportation Index (TRAN/5254.14) did not better its respective reaction high. That is a Dow Theory upside non-confirmation; while I don’t expect it to be a serious occurrence, it is another reason to expect a pullback in the averages. Then there are the sentiment indicators that look pretty stretched, with the AAII ratio of bulls and bears soaring to 74, while the Rydex Bull/Bear ratio is almost at a new all-time high. Of course that overly bullish sentiment “foots” with the recent complacent reaction low of 16.10 in the Volatility Index (VIX/20.79) as in the near-term sentiment is too bullish. Simultaneously, “smart money” – that would be commercial hedge traders – are short $7.4 billion of various indices (INDU, NDX, RUT) as of last Tuesday, which was up from the previous week’s $2.7 billion. That’s a weekly increase of $4.7 billion for one of the largest weekly jumps I have ever seen and it is the highest such “short” position since 2002.
So what do I expect? Well, I have maintained that the “emotional peak” occurred on January 10, 2012 with the start of an upbeat earnings season, which was a pretty good call. Subsequently, I suggested the “price peak” was registered on January 26th at 1333.47 for the SPX. That was not such a good call since the SPX traded up to a closing high of 1351.95 on February 9th. Still, as of last Friday’s close, the SPX is only about 10 points above what I had deemed to be the “price peak”; and despite all the huffing and puffing, I don’t see where a whole lot of money has been made since January 26th. Now typically what should happen from here is for stocks to suffer a bit of more weakness and then make another attempt at the recent highs around 1354. That attempt should fail, leading to a more substantial correction of between 5% - 8%. Whatever the outcome, I do not expect a serious correction anytime in the near future.
The implications are that things are likely going to get a little less fun for investors for a while with the major averages transitioning from a steep price rise to more of a sideways to downward pricing structure. This does not mean you can’t make money. On the upside, my algorithms show that our fundamental analysts’ Strong Buy ratings on 7.6%-yielding CenturyLink (CTL/$38.02) and non-yielding Whiting Petroleum (WLL/$50.89) are setting up for a potential upside breakout. Meanwhile, our analyst’s Underperform rating on ViaSat (VSAT/$45.22) is being confirmed by my algorithms to the downside.
Another strategy would be to “scale buy” fundamentally strong dividend-paying stocks. To that point, our friends at Bespoke Investment Group recently screened the S&P 500 looking for stocks that yield 2.5% (or more) and have raised their dividends every year for at least 10 years. Bespoke further refined the list to companies whose earnings in the year ahead are expected to be double their respective “payout ratio” of the last 12 months. Bespoke goes on to write:
“Of the 500 stocks in the S&P 500, and the 72 stocks that have raised their dividends for ten straight years, only twenty stocks ultimately fit the added criteria of yielding more than 2.5% and have a payout that is less than half of their expected earnings. Although these ‘chicken stocks’ will most likely not be on the list of top performing stocks at the end of 2012, they do provide stable and relatively safe dividends, providing a good starting point for investors ready to dip their feet in the water.”
Names from said list that are favorably rated by our fundamental analysts include: Abbott Labs (ABT/$55.11/Outperform); AFLAC (AFL/$48.33/Outperform); Chevron (CVX/$105.28/Strong Buy); McDonald’s (MCD/$99.72/Outperform); and Norfolk Southern (NSC/$71.53/Strong Buy). Bespoke’s entire list can be retrieved from our Research Liaison desk.
The call for this week: There was another “dog barking in the night” (reference my Sherlock Holmes report of 1/30/12) when two perma bears recently turned bullish. The bears in question are David Rosenberg and Nouriel Roubini. When the ultimate “bears” finally capitulate, well you can draw your own conclusion. That said, it is normal for a market in an uptrend to experience some profit-taking around previous peaks like those in May (1370.58) and July (1356.48) of last year, especially given all of the aforementioned metrics. Accordingly, last week’s intraday high of 1354.32 was likely a short-term trading top, but don’t get bearish because all of my work suggests stocks will be higher by year-end.

Click here to enlarge


