We have written repeatedly about the low relative strength readings coming from the SIA Food and Beverages sector, as highlighted in the SIA Market Sector Report herein. This sector has faced persistent challenges, collectively delivering a negative performance of -8.15% year to date. Over a longer horizon, the 3-year performance stands at just +3.18%, compared to +21.22% for the S&P 500, representing an opportunity cost of 24.40%. While overall sector performance has been weak, this environment often makes standout names easier to identify, and that is the focus of today’s report.
To explore further, SIA practitioners can scan the SIA Food and Beverage tabs under Market and Sectors, or navigate to Reports, Sectors, and Industries to find relatively ranked data on the full list of names in this underperforming group.
One company that stands out is The Vita Coco Company Inc. (COCO), which currently holds a top ranking within the SIA U.S. Consumer Staples Report. As shown in the accompanying SIA matrix position table, Vita Coco has consistently resided in the favored zone over the past year. From an absolute performance perspective, the shares of COCO have returned +48.33% over the past 3 years, which is more than double the S&P 500’s 3-year performance of +21.22%.
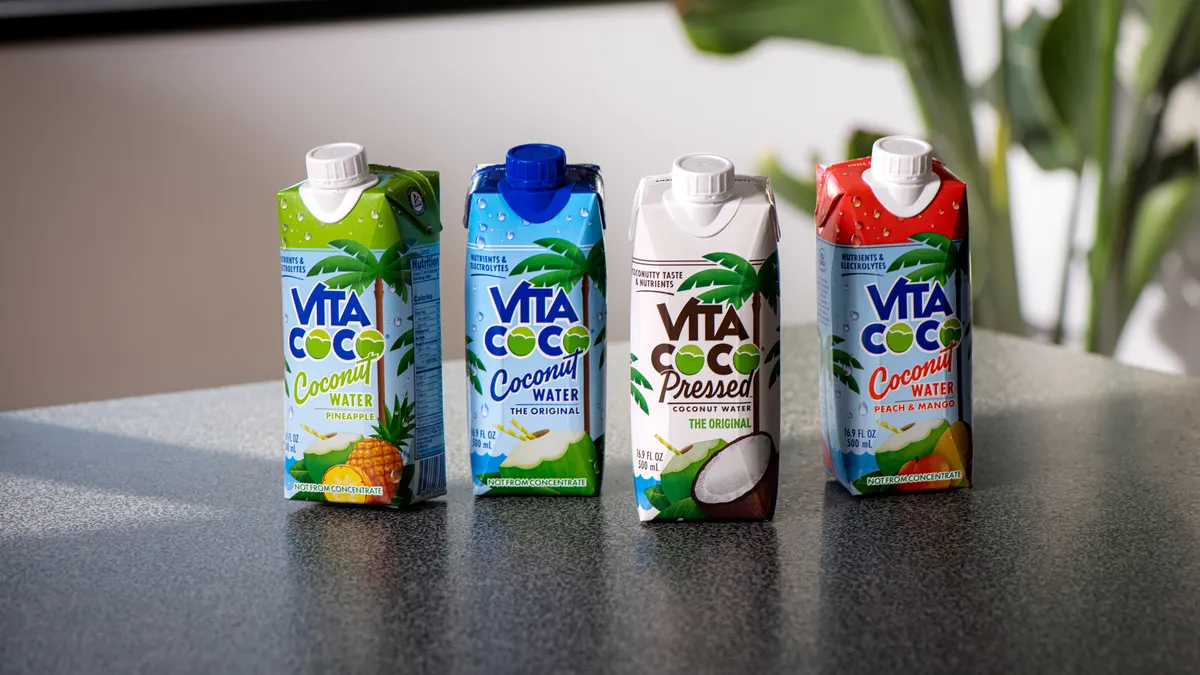
The Vita Coco Company, founded in 2004 and headquartered in New York, is a publicly traded firm listed on NASDAQ under the ticker COCO. It is a certified B Corporation and a Public Benefit Corporation (PBC), legally committed to balancing profit with positive social and environmental impact. Best known for its coconut-based beverages, especially coconut water, Vita Coco has also expanded into other coconut-derived products including organic, cold pressed, virgin coconut oil, which is unrefined and marketed for multiple uses such as cooking, baking, and personal care. The company’s mission-driven approach is supported through sustainable sourcing and community-focused initiatives such as the Vita Coco Project, which empowers coconut farming communities through education, training, and infrastructure support.
The SIA Point and Figure (P&F) chart offers a compelling visual representation of the growth in COCO shares over the past 3 years, highlighting a pattern of successive breakouts and consolidations. The most recent breakout occurred at $40.36 on the 3% scaled chart, following a strong move through $39.00 on a spread triple top P&F formation; a bullish signal.
A support line has been drawn at the 3-box reversal level of $36.94, while a broader support zone is identified around $31.86, which traces back to 2023 and could serve as a significant technical floor if any pullback occurs.
On the upside, resistance levels have been projected using a vertical count P&F methodology, with potential resistance points at $46.79 and $49.64, offering natural targets for any continued advance in the stock’s value.
Also noteworthy on the chart is the SIA SMAX score, which currently stands at 8 out of 10, indicating strong relative strength versus a basket of alternative asset classes. This near-optimal score reinforces the stock’s current technical leadership position within its sector and beyond.
Disclaimer: SIACharts Inc. specifically represents that it does not give investment advice or advocate the purchase or sale of any security or investment whatsoever. This information has been prepared without regard to any particular investors investment objectives, financial situation, and needs. None of the information contained in this document constitutes an offer to sell or the solicitation of an offer to buy any security or other investment or an offer to provide investment services of any kind. As such, advisors and their clients should not act on any recommendation (express or implied) or information in this report without obtaining specific advice in relation to their accounts and should not rely on information herein as the primary basis for their investment decisions. Information contained herein is based on data obtained from recognized statistical services, issuer reports or communications, or other sources, believed to be reliable. SIACharts Inc. nor its third party content providers make any representations or warranties or take any responsibility as to the accuracy or completeness of any recommendation or information contained herein and shall not be liable for any errors, inaccuracies or delays in content, or for any actions taken in reliance thereon. Any statements nonfactual in nature constitute only current opinions, which are subject to change without notice.


