


by Brian Levitt, Global Market Strategist, Invesco
Key takeaways
- Markets and tariffs - Markets may only need incremental progress, not full clarity on trade-tariff policy, to keep rising.
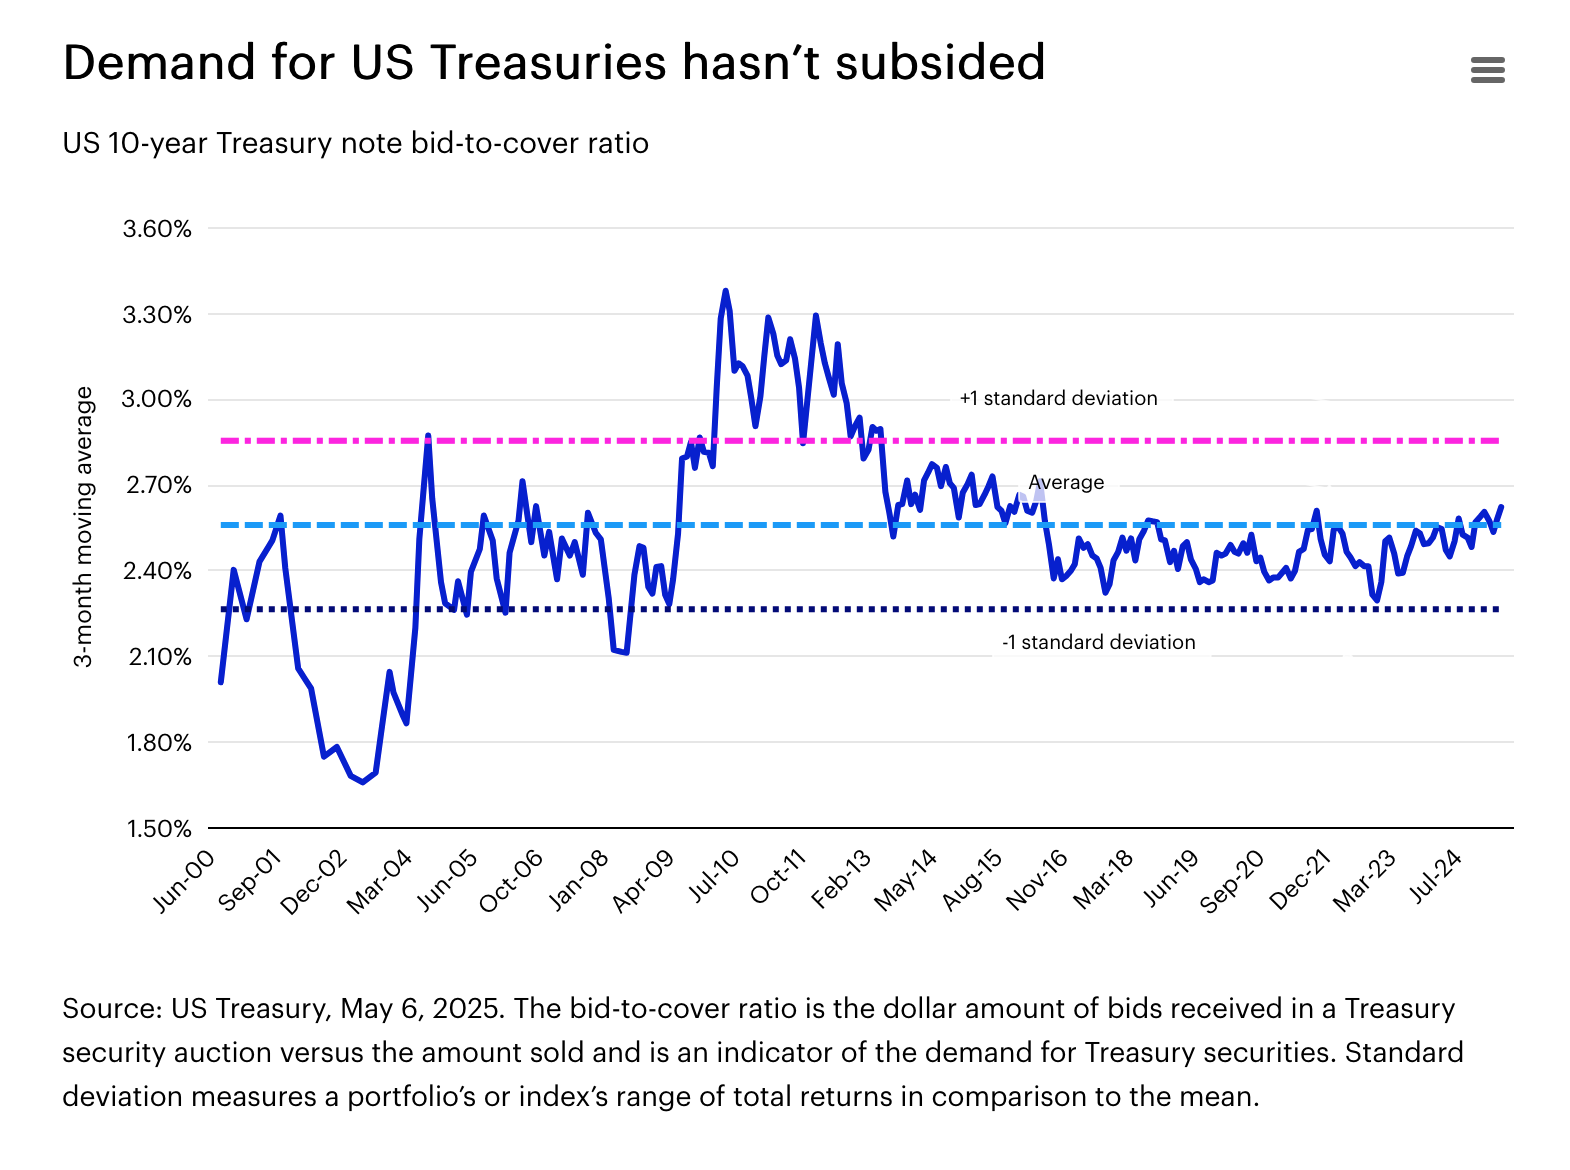
- Treasury demand - Rumors of the demise in demand for US Treasuries appear greatly exaggerated. There’s been little evidence to support it.
- Debt downgrade - Moody’s downgrade, like past downgrades, shouldn’t pose a structural threat to the US Treasury market.
To be fair, the fundamentals haven’t shifted much. Tariffs remain elevated,3 and business sentiment is still historically weak.4 Yet markets have rallied,5 likely because we’ve moved past peak policy uncertainty.6 There are signs that certain market pain points are forcing the administration to soften its more extreme trade stance.
Looking ahead, do markets need full clarity on trade to keep rising, or just incremental progress? Recent history favors the latter. In December 2018, President Trump agreed to a 90-day trade truce with China. The phase one deal wasn’t signed until January 2020, but the market performed quite well in the interim.7
Serenity now!
It may be confirmation bias, but…
…rumors of the demise of demand for US Treasuries have been greatly exaggerated in my opinion. Markets absorbed May’s Treasury auction, with little evidence to support fears of foreign Treasury boycotts. In fact, the average 10-year US Treasury note bid-to-cover ratio over the past three months is slightly above the long-term average.8 I’d expect US Treasuries to continue to trade based on expectations of monetary policy and nominal growth, and not on concerns of fiscal sustainability.
Since you asked
Q: Could the new tariffs generate enough revenue to meaningfully change the US fiscal picture?
A: It’s unlikely. But let’s quantify it:
- In 2024, the US government collected approximately $98 billion in customs and excise taxes, accounting for about 2% of the total $4.9 trillion in tax revenue.9
- If the effective tariff rate were to rise to 10%, that would represent a fourfold increase over the 2024 level.10 Assuming all other factors remain constant, customs tax revenue in 2025 could reach $400 billion, or roughly 8% of last year’s total tax receipts.
- All else may not remain equal, however. A higher tariff rate would likely reduce import volumes because demand could decline, and consumers might shift toward domestically produced or alternative goods.
It was said (part 1)
“This one-notch downgrade on our 21-notch rating scale reflects the increase over more than a decade in government debt and interest payment ratios to levels that are significantly higher than similarly rated sovereigns.”
– Moody’s Investors Service
Moody’s Investors Service downgraded US government debt on May 16, echoing similar past actions. Standard & Poor’s did so 14 years ago, and Fitch two years ago.11 In short, this isn’t new.
The current downgrades, like those before them, don’t pose a structural threat to the US Treasury market. US Treasuries are their own asset class and thus are insulated from forced selling. It’s also important to remember that the US is an exceptionally wealthy nation. While government debt stands at approximately $37 trillion,12 total US household net worth is nearly $160 trillion.13
There are also viable policy options available to help curb the growth of national debt. Ultimately, it’s a question of political will.
It was said (part 2)
“Now, if the chairman of the Fed ... if he would lower interest rates like China did, like I think the UK did, but like numerous other countries have done, it would be, it’s like jet fuel ... but he doesn’t want to do it… Probably he’s not, he’s not in love with me.”
– President Donald Trump
It’s unlikely that Federal Reserve (Fed) Chairman Jerome Powell’s personal views toward the president have any bearing on Fed policy. It currently finds itself in a difficult position: Tariffs are expected to slow economic growth while simultaneously pushing prices higher, at least in the short term.
Meanwhile, as the US faces potential shortages and rising prices, China and countries in Europe may be dealing with the opposite problem: An oversupply of goods originally intended for export. For the US, the challenge is near-term inflation; for much of the rest of the world, it could be near-term deflation. That contrast helps explain why central banks globally are shifting toward more accommodative policies.
My suggestion: Don’t fight the European Central Bank or the People’s Bank of China.
Our Portfolio Playbook says
The answers to three questions help guide our investment views in our Portfolio Playbook.
1. Where are we in the cycle?
A recession doesn’t appear imminent. If it were, credit spreads would likely be significantly wider.14
2. What’s the direction of the economy?
Global growth is expected to remain below trend and continue to deteriorate.15
3. What are the policy implications?
Policy easing is ongoing, with more aggressive measures being implemented outside the US.
Given this backdrop, a prudent investment approach could be to focus on improving portfolio quality and reducing valuation. Diversifying beyond mega-cap US growth stocks into value, mid-cap, and international stocks may help reduce overall portfolio valuations.16 A lower-valuation portfolio may offer downside protection and may be well-positioned to benefit from a potential global economic recovery.
Everyone has a podcast
For each episode of our Greater Possibilities podcast, we phone a friend to learn more about a topic. In the latest episode, we phoned Justin Leverenz of the Invesco Developing Market team. Here’s what he said:
- The performance of emerging market stocks — both absolute performance in US dollars and relative performance to US stocks — depends primarily on two factors: China and the US dollar. We contend that we may be at the inflection point where both align to be positive forces on returns.
- Global growth may inevitably shift towards Asia and Europe over the next few years. Both geographies have considerable fiscal policy latitude to reflate domestic demand given the shock of weaker exports.
- The case for Chinese stocks hinges on a recovery in domestic demand and a shift away from excess savings towards domestic consumption. The Chinese government has already taken steps in this direction, implementing measures to boost domestic demand and reduce reliance on exports.
On the road again
My travels took me to a conference in Atlanta where the keynote speaker was Dominique Wilkins. It’s not every day that I get to hear from an NBA legend and Hall of Famer. He focused on the value of healthy competition. He admitted that he hated the competition when he played, but he still looked up to the league’s best players. Competition can make you better. It also makes the game more fun.
Footnotes:
1 Source: Investment Company Institute, May 7, 2025. Latest data available. Mutual fund data represent estimates of net new cash flow, which is new sales minus redemptions combined with net exchanges, while exchange-traded fund (ETF) data represent net issuance, which is gross issuance less gross redemptions. Data for mutual funds that invest primarily in other mutual funds and ETFs that invest primarily in other ETFs were excluded from the series.
2 Source: Bloomberg L.P., May 19, 2025. The year-to-date total return of the S&P 500 Index as of market close on May 16, 2025, was 1.80%.
3 Source: United States International Trade Commission, May 2025.
4 Source: CEO Executive Magazine, April 30, 2025. The CEO Confidence Index is a monthly survey of chief executives. Each month, Chief Executive Magazine surveys CEOs across corporate America at organizations of all types and sizes to compile and create an index.
5 Source: Bloomberg L.P., May 19, 2025. Based on the return of the S&P 500 Index since the recent market trough on April 8, 2025.
6 Source: Baker, Bloom, & Davis, May 18, 2025. Based on the US Economic Policy Uncertainty Index, a widely used metric to quantify economic uncertainty related to policy decisions. It hit a 2025 peak on April 5, 2025.
7 Source: Bloomberg L.P., May 19, 2025. The S&P 500 Index returned 31.5% in 2019. Past performance does not guarantee future results.
8 Source: US Treasury, May 6, 2025. Latest data available. The bid-to-cover ratio measures the total amount of tenders and the total amount of Treasury accepted bids on a competitive basis. Generally, this number is positively correlated to demand (the larger the number, the greater the demand).
9 Source: US Treasury, Dec. 31, 2024.
10 Source: United States International Trade Commission, May 2025.
11 Source: Standard & Poor’s, Fitch Ratings.
12 Source: US Treasury, Dec. 31, 2024.
13 Source: US Federal Reserve, Dec.31, 2024.
14 Source: Bloomberg L.P., May 19, 2025. Based on the option-adjusted spread of the Bloomberg US Corporate High Yield Bond Index, which measures the US dollar-denominated, high yield, fixed-rate corporate bond market. Securities are classified as high yield if the middle rating of Moody’s, Fitch, and S&P is Ba1/BB+/BB+ or below. Option-adjusted spread (OAS) is the measurement of the spread of a fixed-income security rate and the risk-free rate of return, adjusted to account for an embedded option, such as calling back or redeeming the issue early. The Bloomberg US Corporate High Yield OAS on May 19, 2025, is 303 basis points compared to a long-term average of 498 basis points.
15 Sources: Bloomberg L.P., MSCI, FTSE, Barclays, JPMorgan, Invesco Solutions research and calculations, from Sept. 1, 1992, to April 30, 2025. The Global Leading Economic Indicator (LEI) is a proprietary, forward-looking measure of The Global Leading Economic Indicator (LEI) is a proprietary, forward-looking measure of the growth level in the economy.
16 Source: Bloomberg L.P., April 30, 2025. Based on the price-to-earnings ratio of the S&P 500 Index (23.8x) compared to other indexes such as MSCI Europe Index (14.7x), Russell 1000 Value Index (18.5x), and Russell Midcap Index (20.4x).
Copyright © Invesco