by Jurrien Timmer, Director of Global Macro for Fidelity Management & Research Company
I’m spending a few days this week in my second-favorite place on earth (of course you know which is #1), on my way to a speaking gig for our annual Stock Plan Services conference in Dana Point, followed by a flight east for our Fort Lauderdale branch, and then back to Boston. After that, it’s Vancouver, Salt Lake City, Zurich, London, Paris, Frankfurt, and Hamburg. Spring and fall are relentless when it comes to travel, as most conferences and client events take place then. For now, my badge swipes at the office have been replaced by boarding passes.
Of course, I am on my bike this spring (training for my 27th Pan-Mass Challenge), and it’s a delight to see nature so much in bloom here in CA. California is a land of extremes, with the climate swinging from drought and wildfires to lush greenery and mudslides. Not much middle ground, but this week Santa Barbara looks like the Côte d’Azur.
Green on the Screen
For the markets, spring seems to have sprung as well, and investors are taking comfort that - yes - there is a put for both equities and rates and the White House appears to be minding the goal posts.
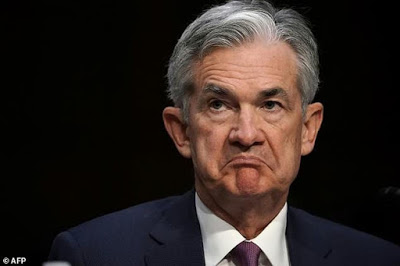
After a 21.5% decline in stock prices, when all US-denominated assets seemed to be on sale (except gold), the market has taken the glass-half-full approach that a trade war will be prevented. Indeed, looking at all analogs since 1900, once the stock market has declined 20% the current recovery is only bested by that pivot party in late 2018, when Jay Powell exercised the Fed put after the rate cycle pushed the market down 20%.

As hard as it seems to believe that we might replicate the 2019 recovery, a put is a put, regardless of whether it comes from the Fed or the Treasury. In an era of fiscal dominance, the Fed put may have become obsolete.
Bump in the Road
Taking about a thousand steps back, we can see that in the grand scheme of things, the current 22% correction is just a bump on the road. Yes, a 150-year timeframe is longer than we will be alive, but nevertheless it’s useful to zoom out to gain perspective.

2018 or 1998 or 1968?
While 1998 and 2018 have been useful price analogs to gauge the psychology of the market, the 1968 analog continues to be a compelling alternative to the bullish implications of both 1998 and 2018. If your glass is half empty instead of half full, you will want to keep this analog in mind.
Below we see that the 1966-1968 bull market has been a fitting analog to the 2022-2025 bull market. While the two periods in history are different in many ways, they are also similar, from the Guns & Butter inflation and fiscal environment to the Fed-engineered soft landing in 1967 (following a false inverted yield curve signal in 1966). That soft landing (similar to 2023) ended up merely postponing the recession to 1969-1970.

Secular Analog
Whether 2026 will become an analog for 1970 remains to be seen, but it’s worth keeping the parallel in mind, especially considering that the 1966-1968 cyclical bull market was the final act of the 1949-1968 secular bull market. By my count, we are in similar innings of the current secular bull market. Note the almost perfect secular analog below. Even the regression trendlines match.

Earnings & Valuation
For the current cycle, knowing that equity valuations have gotten a decent haircut (from 23x to 19x), the big question remains how much earnings are at risk if the threat of a trade war turns into something worse. So far, the trailing EPS growth rate remains at +10%, but that will change in the coming quarters.

Garden Variety Derating
Earnings estimates for the coming quarters are coming down, but it remains unclear how much of this is related to the tariff tantrum and the risk of a recession and how much is just the usual downward drift.

Taking a step back to look at 40 years of estimate history, the squiggles chart below shows that the downward drift for 2025, 2026 and 2027 estimates doesn’t seem that onerous yet.

When we line up all 40 years as an analog, we see that the progression of 2025 estimates don’t look much different from the typical drift. So perhaps analysists are still not accounting for a potential trade war.

Go East
While US earnings estimates are being marked down, EAFE estimates are being marked up. This finally creates a catalyst for the rest of the world (especially EAFE) to outperform the US for a cycle or more. That catalyst had been missing until recently. Below we see that EAFE estimates are rising and the drift (insert) is up. Incredibly, earnings per share still remain below their all-time high set in 2008. Perhaps that will soon change.

Technicals
Technically speaking, the price action for US equities remains inconclusive in terms of whether the price recovery of the past few weeks is a continuation of the prevailing up-trend or a retracement within an unfolding bear market. We just don’t know yet, although the monthly Coppock Curve (a momentum indicator) below suggests that momentum has peaked.

The chart is a good illustration of the subjectiveness of trendlines: the S&P 500 is either at its rising regression line (if we start the clock in 2009), or still well above it (since 1990).
Contrast the above with the chart below of the MSCI ACWI ex-US index, and we see the potential for a 15 year base to be resolved to the upside. Is the tide turning, and is it cyclical or secular?

Secular Turn?
Whether this is just a cyclical trade or something bigger remains to be seen, but as the chart below shows, if the mega-growth driven US secular bull market is indeed cresting, then there is room for international equities to outperform beyond just an earnings cycle. The same three decades-long super cycle (depicted as a 10-year relative CAGR in the bottom panel) exists for commodities, value, and small caps. It’s all one trade, for or against the Mag 7.

A New 60/40 for a New Era
If the secular tide is cresting, we will need to rethink the 60/40 paradigm that served us so well from the late 1990s until 2022. My sense is that we need to paint this canvas with broader strokes, emphasizing the alpha over the beta. Equities? Yes, of course. Bonds? Also, but maybe fewer than before, replaced by harder assets such as gold, commodities, Bitcoin, and cash.

The 60 or the 40?
When it comes to diversification, I am more concerned about hedging the 40 than the 60. Even if the secular wave turns for equities, my version of the CAPE model suggests that returns will stay positive (just less so). Plus, we can just rotate into international equities, which could be traveling to the beat of a different drum for a while. So, I am OK with the 60. But for the 40 I’m not so sure. Maybe that 60/40 should be more like 60/20/20?
As the correlation grid shows below, gold and commodities remain the most negatively correlated assets to equities. Beyond that it’s slim pickings with bonds now positively correlated. Alts, however, provide non-correlated returns, so that tells me that a combination of cash, gold, commodities, Bitcoin, and alts could make up the 20.

Against long term Treasuries, there are more choices, including the above assets but also Bitcoin and levered loans. Note how since 2021 correlations against bonds went from a sea of blue to a sea of red.

Sharpe Ratios
Below we see that there should be some alpha to harvest from a lower beta world. Alts, gold and Bitcoin all have sizeable Sharpe Ratios (risk-adjusted returns).

And those same asset classes have low or even negative betas to the S&P 500.

Gold & Bitcoin
I continue to be fascinated by the fact that the most negatively correlated asset to Bitcoin is gold. For two players on the same store-of-value team, it’s not what I would expect to see. But Bitcoin’s Dr. Jekyll & Mr. Hyde personality makes it an unpredictable asset class that sometimes behaves like gold and other times like the NASDAQ.

Nevertheless, Bitcoin’s risk-reward ratio has continued to impress. There is no other asset quite like it!

Store-of-Value Team
After a strong run by gold, perhaps the baton is being passed again to Bitcoin, with Bitcoin back above $100k and the two Sharpe Ratios now converging. I still think a ratio of 4:1 (gold vs Bitcoin) makes sense in terms of how much gold vs Bitcoin might co-exist in a store-of-value allocation. At a 4:1 ratio, gold’s volatility has been roughly equal to Bitcoin, as has its relative performance.

1188536.17.0
This information is provided for educational purposes only and is not a recommendation or an offer or solicitation to buy or sell any security or for any investment advisory service. The views expressed are as of the date indicated, based on the information available at that time, and may change based on market or other conditions. Opinions discussed are those of the individual contributor, are subject to change, and do not necessarily represent the views of Fidelity. Fidelity does not assume any duty to update any of the information.
Copyright © Fidelity Management & Research Company


