


by George Smith, Portfolio Strategist, LPL Research
Additional content provided by John Lohse, CFA
Recent Survey Results
The most recent weekly sentiment survey from the American Association of Individual Investors (AAII), published today, April 24, 2025, reveals a slight easing of bearish investor sentiment. Bearish sentiment, which reflects retail investors’ expectations that stock prices will fall in the next six months, decreased by 1.3 percentage points to 55.6% while bullish sentiment, reflecting expectations that stock prices will rise, decreased further to 21.9%. Our favored measure when looking at this data is the spread between the bulls and bears; this metric fell by 2.2% to -33.7% (grew more pessimistic), marking the twelfth straight week of a negative spread (more bears than bulls). The chart below shows the extreme levels of pessimism being recorded in the bull-bear spread, with this recent bout eclipsing two standard deviations below historical averages.
Individual Investors’ Pessimism at Extreme Levels

Source: LPL Research, AAII, Bloomberg, 4/23/25
Disclosures: All indexes are unmanaged and cannot be invested into directly. Past performance is no guarantee of future results.
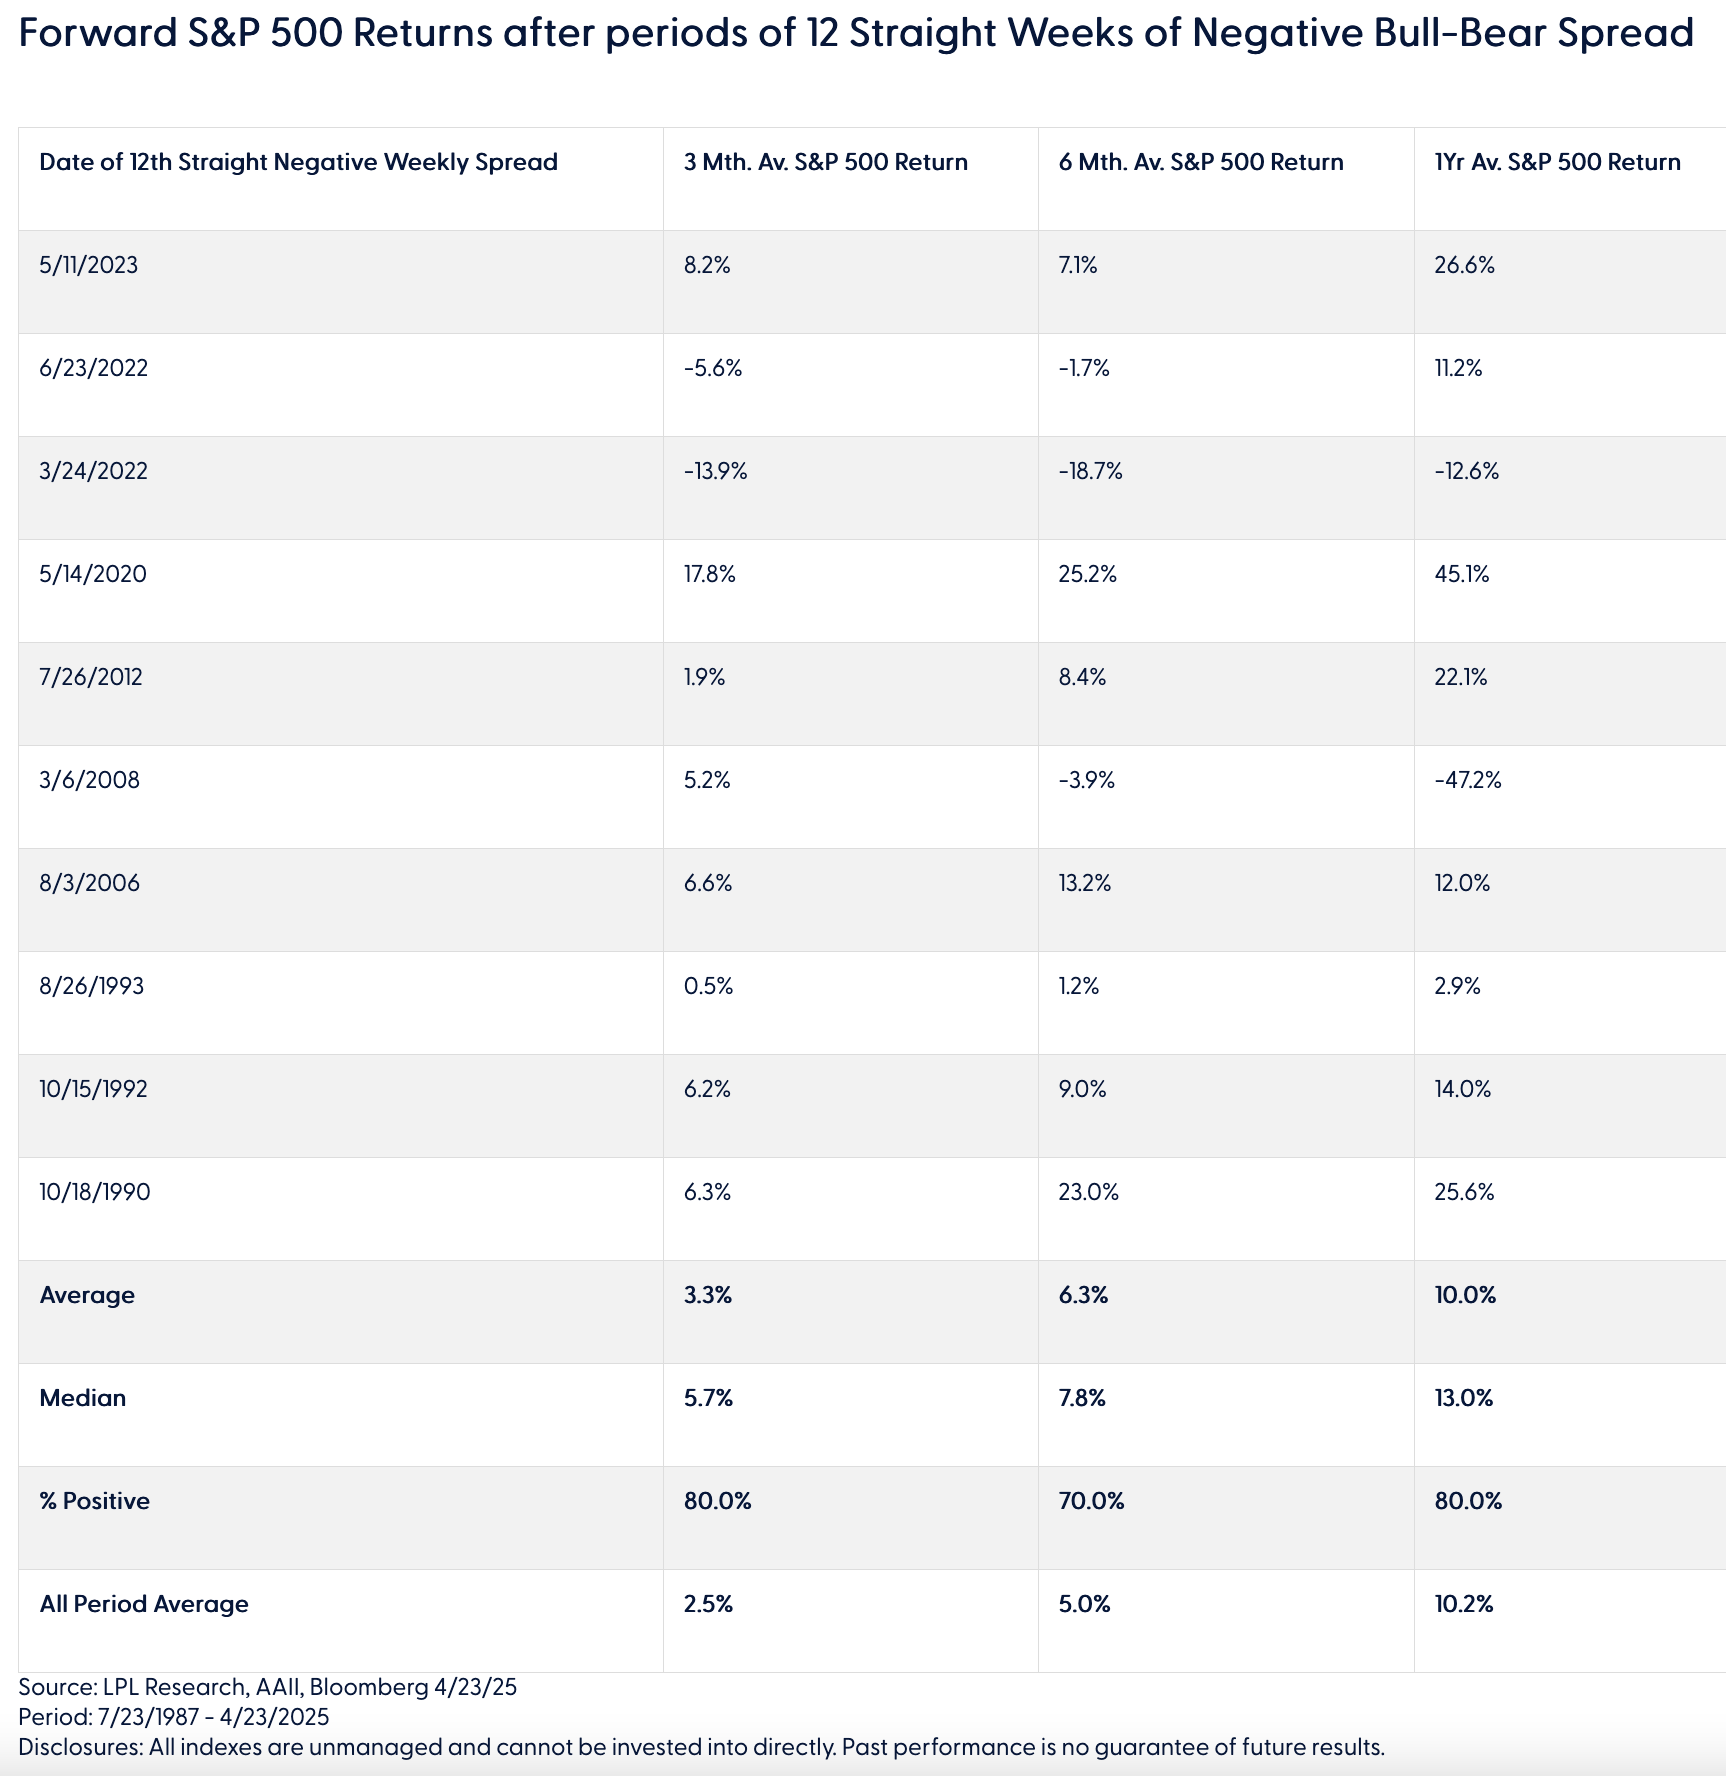
Is Persistence of Negativity Positive for Stocks?
The consistent negative sentiment suggests that investors’ pessimistic stance may have become entrenched, as retail investor optimism has become fatigued, driven by trade policy uncertainty and increased market volatility. To put these numbers into perspective, it's beneficial to look at the historical averages. Since the AAII survey’s inception in 1987, prior to today, there have only been 10 such instances where the bull-bear spread has registered a negative reading for 12 straight weeks. However, prolonged persistence of retail investor negative sentiment has actually been a precursor to above-average (though highly volatile) equity market returns. Over shorter time periods, on average, following those 12 occurrences, the S&P 500 outpaced its own historical 3- and 6-month performance, indicating when sentiment has been washed out for this long there is often a short term rebound in equity prices. On average, the S&P 500 has had a 1-year forward return of 10.0% after that twelfth occurrence, right in line with the all period 1-year average, but with a median one-year return of 13.0%. Returns one year after the twelfth week of negative bull-bear spread were positive 80% of the time. However, it’s worth noting the very wide range of returns; -47% to + 45%.
Is the Current Magnitude of Negativity Extreme?
History has also shown that excessively pessimistic sentiment often foreshadows positive future returns. The chart below highlights the use of this metric as a contrarian indicator, where we see when the sentiment spread becomes more bearish the 3-month, 6-month and 1-year forward returns exceed the long-term average return and when the sentiment is very bullish (2 or more standard deviations above the long-term average) we start to see negative forward returns. The current level of sentiment is now “very bearish” in that it's greater than 2 standard deviations below the mean. The 3-, 6-, and 12-month performance in both bearish and very bearish sentiment environments has been above long-term averages, so we continue to consider sentiment to be a contrarian positive indicator for stocks.
Current Bull-Bear Spread of –33.7% at Extremes
 Source: LPL Research, Bloomberg, AAII as of 4/24/25
AAII Bull-Bear spread brackets based 1 or 2 standard deviations above/below 10 year rolling average. 10 year rolling average is 2% with a standard deviation of 16%.
Disclosures: All indexes are unmanaged and cannot be invested into directly.
Past performance is no guarantee of future results.
Conclusion
So, what does this data tell us? Both the persistence and levels of negative sentiment should be an indication to remain invested, and not to panic sell at the height of negativity. On the contrary, it could present an opportunity to increase risk, especially for investors with longer time horizons. Tactically, we’ve seen signs of the bottoming process in play recently, including a flushing out of market breadth, volatility retreating from multi-year highs, record-level trading volume, and an uptrend for the S&P 500 remaining intact. We’ve, however, yet to see clear and meaningful progress in trade negotiations take place (despite promising headlines), which continues to shroud certainty. A re-test of the lows isn’t off the table due to this ongoing uncertainty around tariffs and the increased risk of recession; however, opportunities are beginning to reveal themselves. Our recently updated S&P 500 price target highlights both this continued uncertainty and upside potential, and we determine a relatively balanced risk-reward trade-off based on current market levels.
LPL’s Strategic and Tactical Asset Allocation Committee (STAAC) continues to maintain a neutral stance on equities, with a preference for large-caps over small-caps domestically, and for U.S. equities over emerging market equities (though technical analysis is showing strength in some of these markets). LPL Research is actively tracking tariff negotiations, economic data, earnings reports, bond market trends, and various technical indicators to pinpoint a more favorable opportunity for adding equities.
Important Disclosures
This material is for general information only and is not intended to provide specific advice or recommendations for any individual. There is no assurance that the views or strategies discussed are suitable for all investors. To determine which investment(s) may be appropriate for you, please consult your financial professional prior to investing.
Investing involves risks including possible loss of principal. No investment strategy or risk management technique can guarantee return or eliminate risk.
Indexes are unmanaged and cannot be invested into directly. Index performance is not indicative of the performance of any investment and does not reflect fees, expenses, or sales charges. All performance referenced is historical and is no guarantee of future results.
This material was prepared by LPL Financial, LLC. All information is believed to be from reliable sources; however LPL Financial makes no representation as to its completeness or accuracy.
Unless otherwise stated LPL Financial and the third party persons and firms mentioned are not affiliates of each other and make no representation with respect to each other. Any company names noted herein are for educational purposes only and not an indication of trading intent or a solicitation of their products or services.
Asset Class Disclosures –
International investing involves special risks such as currency fluctuation and political instability and may not be suitable for all investors. These risks are often heightened for investments in emerging markets.
Bonds are subject to market and interest rate risk if sold prior to maturity.
Municipal bonds are subject and market and interest rate risk and potentially capital gains tax if sold prior to maturity. Interest income may be subject to the alternative minimum tax. Municipal bonds are federally tax-free but other state and local taxes may apply.
Preferred stock dividends are paid at the discretion of the issuing company. Preferred stocks are subject to interest rate and credit risk. They may be subject to a call features.
Alternative investments may not be suitable for all investors and involve special risks such as leveraging the investment, potential adverse market forces, regulatory changes and potentially illiquidity. The strategies employed in the management of alternative investments may accelerate the velocity of potential losses.
Mortgage backed securities are subject to credit, default, prepayment, extension, market and interest rate risk.
High yield/junk bonds (grade BB or below) are below investment grade securities, and are subject to higher interest rate, credit, and liquidity risks than those graded BBB and above. They generally should be part of a diversified portfolio for sophisticated investors.
Precious metal investing involves greater fluctuation and potential for losses.
The fast price swings of commodities will result in significant volatility in an investor's holdings.
This research material has been prepared by LPL Financial LLC.
Not Insured by FDIC/NCUA or Any Other Government Agency | Not Bank/Credit Union Deposits or Obligations | Not Bank/Credit Union Guaranteed | May Lose Value
For Public Use – Tracking: #730139
Copyright © LPL Research