by Adam Turnquist, Chief Technical Strategist, LPL Research
In baseball, three strikes and you’re out. With inflation, a third straight month of hotter-than-expected consumer inflation data nearly ruled out probabilities for a June rate cut yesterday (now less than a 25% chance, according to fed funds futures). The core Consumer Price Index (CPI) rose 0.4% in March, or 3.8% when compared on a 12-month basis, topping respective estimates of 0.3% and 3.7%. Investors quickly dialed back rate-cut expectations on the news, pushing Treasury yields up by 0.15% to 0.20% and stocks down around 1%.
Based on the breakout higher in Treasury yields, the message from the fixed income market yesterday appeared to be ‘not so fast’ regarding the timing of an interest rate cut, echoing the patient tone of the Federal Reserve (Fed). Based on the breakdown below the S&P 500’s uptrend, the message from the equity market yesterday served as a warning sign for a potentially deeper pullback.
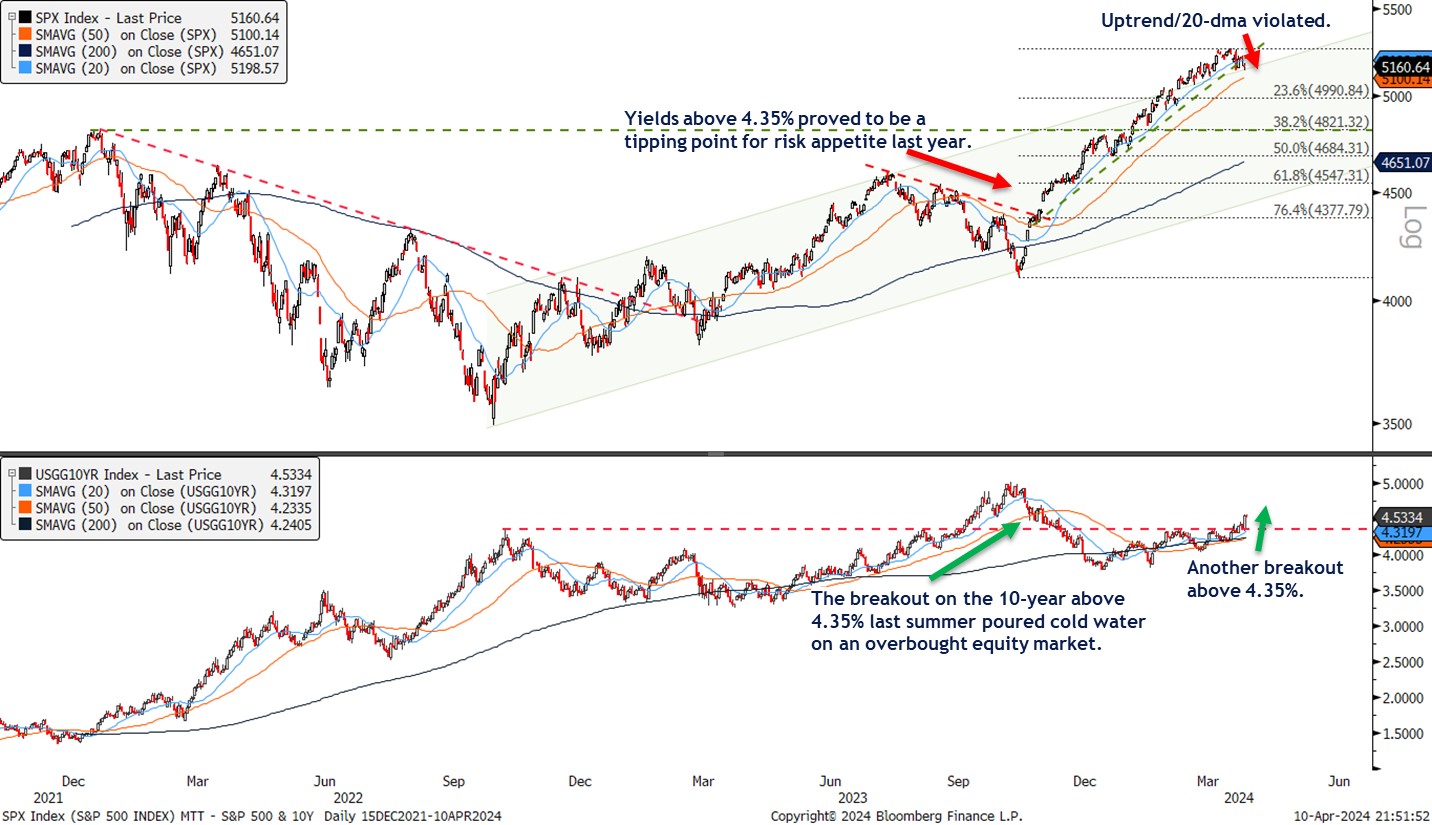
As highlighted in the chart below, the S&P 500 violated an uptrend/20-day moving average (dma) yesterday — a consistent spot for buyer demand on dips. When support no longer acts as it should, be on alert, especially if there are correlative signs of macro conditions potentially changing.
The bottom panel features 10-year Treasury yields and their breakout above 4.35% yesterday, an important resistance level tracing back to the October 2022 highs. As highlighted, yields last broke out above this area in August 2023, and the subsequent advance in yields proved to be too much, too fast for equity markets to absorb. While we are not suggesting a correction is imminent or that stocks and bonds will follow the exact same path, the shift in risk appetite after yields topped 4.35% last summer provides another warning for a potential pullback in stocks.
Stocks Down, Yields Up
The breakout higher on 10-year Treasury yields could weigh on risk appetite.

Source: LPL Research, Bloomberg 04/10/24
Disclosures: Past performance is no guarantee of future results. All indexes are unmanaged and can’t be invested in directly.
A pullback or even correction is nothing out of the ordinary for a strong bull market. Market breadth remains expansive, offensive sectors are leading, credit spreads and implied volatility remain historically low, and longer-term momentum implications of this rally all suggest dips should be bought.
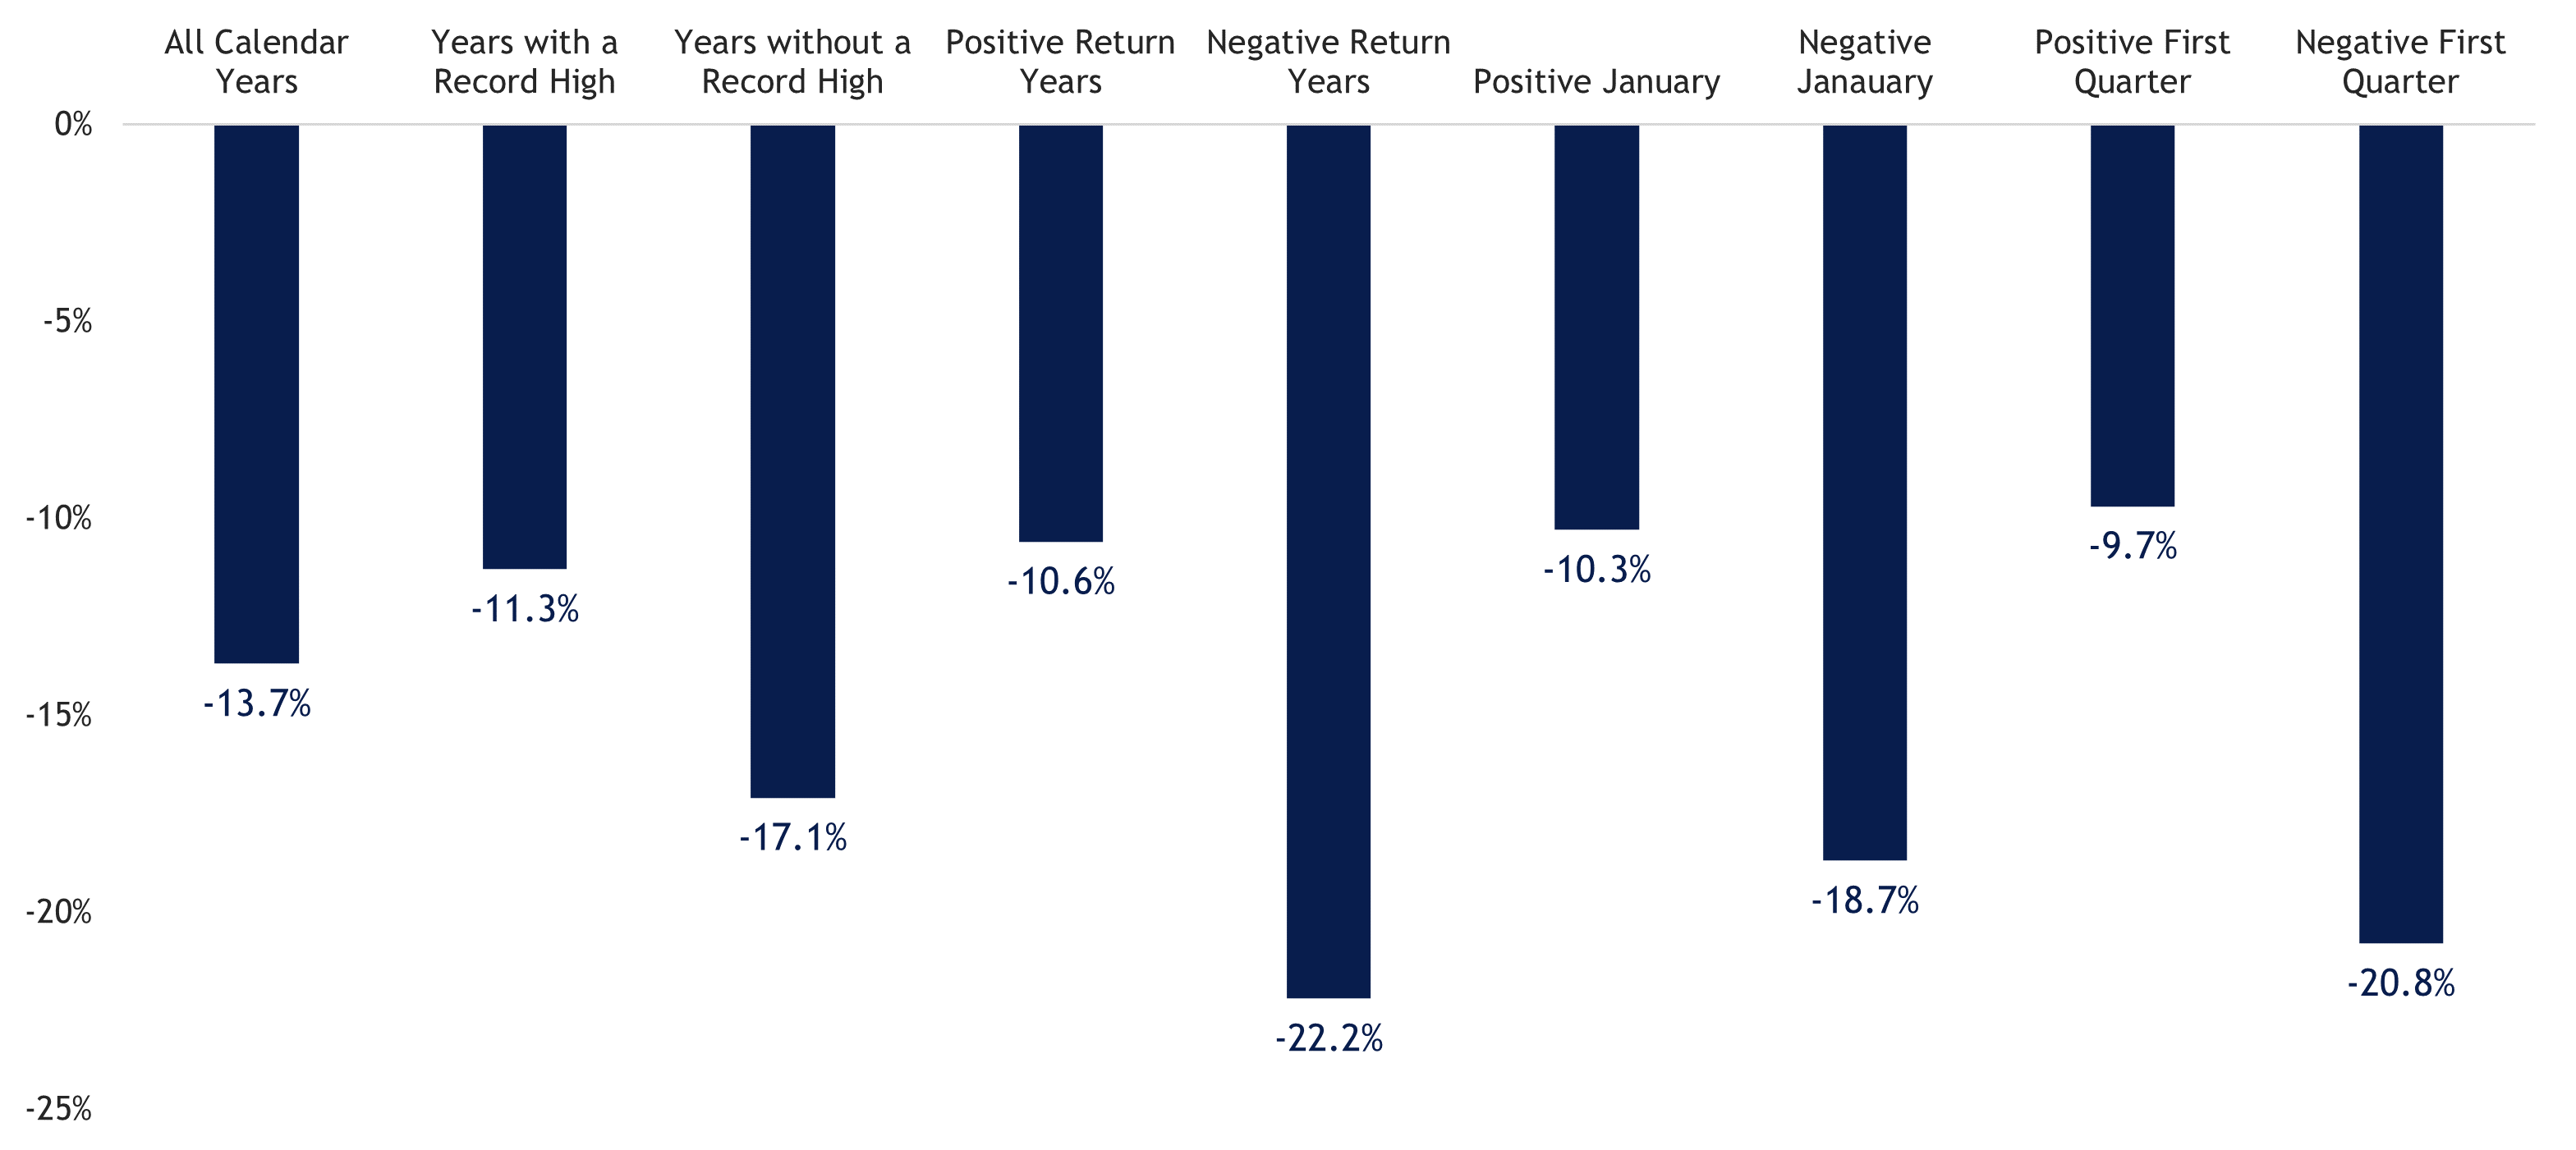
To better assess what a pullback could appear like on the S&P 500, we analyzed various drawdown scenarios dating back to 1950. For all years across this time frame, the average maximum drawdown for the index has averaged -13.7%. However, drawdowns are less severe during years that include record highs, a positive January, and a positive first quarter — all characteristics of 2024.
Drawdown Scenarios for the S&P 500 (1950-2023)

Source: LPL Research, Bloomberg 04/10/24
Disclosures: Past performance is no guarantee of future results. All indexes are unmanaged and can’t be invested in directly. The modern design of the S&P 500 stock index was first launched in 1957. Performance back to 1950 incorporates the performance of the predecessor index, the S&P 90.
Summary
Stocks have enjoyed a strong and steady climb higher this year with extremely low volatility. Momentum indicators have started to sputter as stocks begin to experience some technical damage. The violation of the S&P 500’s 20-dma and corresponding breakout in 10-year Treasury yields points to a percolating risk for a deeper pullback. We consider 4,800 as a worst-case scenario for a drawdown on the S&P 500 but note there are several support levels to get through on the way down, including the 50-dma at 5,100 and the 5,000-point milestone. Confidence for a relatively shallow drawdown is primarily supported by broad market breadth, cyclical leadership trends, economic resiliency, historically narrow credit spreads, and the longer-term momentum implications of this rally.


