by Jeffrey Rosenberg, Managing Director, Systematic Fixed Income, BlackRock
A favorite Mark Twain aphorism states, “It ain’t what you don’t know that gets you into trouble. It’s what you know for sure that just ain’t so.” Bond markets began 2024 with certainty that a return to 2% inflation would allow the US Federal Reserve (“Fed”) to cut interest rates in March and at every Federal Open Market Committee (“FOMC”) meeting that followed. But what bond markets knew for sure turned out to not be so—leading to “trouble” (or disappointment) in the form of negative 1.50% returns to start the year.
Now, market pricing is more closely aligned with the Fed’s rate cut projections for 2024, creating a better entry point for duration. And fading recession and default fears have improved the outlook for credit. But what the Fed (and markets) know for sure—that policy is restrictive—remains uncertain and a risk to the outlook for bonds. Dynamics such as easing financial conditions from higher asset prices could continue to challenge the level of policy restrictiveness and undermine expected rate cuts.
Key points
- What the Fed (and bond market) knows for certain: The bond market outlook has improved as expected rate cuts align more closely with the Fed. But these expectations reflect the view that policy is restrictive, which remains challenged by strong economic data. Easing financial conditions from asset price changes may lead to continued uncertainty around policy restrictiveness, undermining the urgency and need for policy normalization.
- Where you hold your duration matters as much as how much you hold: The yield curve tends to steepen during cutting cycles as interest rates closest to the Fed’s policy rate react more to rate cuts than longer maturities. Historically, curve steepening has resulted in the highest returns for the 3-5 year part of the curve. But the longer it takes for the anticipated cutting cycle to begin, investors positioned for steepening could miss out on the stronger risk-adjusted returns in the highest yielding short duration instruments.
- The decoupling of “quality” in equity and credit markets: Equity and fixed income measures of balance sheet quality frequently move in tandem. However, the outperformance of quality equity exposures has been out of synch with credit markets this year, as credit spreads have tightened significantly with fading recession and default risks. Given the benign economic backdrop, the desirability of quality stocks may have more to do with balancing the risks of secular growth exposures in portfolios than the expectation for credit deterioration.
What the Fed (and bond market) knows for certain…
The closer alignment of bond market expectations to the Fed’s indicated path of interest rate cuts at every other FOMC meeting beginning in June restores the potential for more modest fixed income returns this year.
But the Fed’s expectation for rate cuts reflects the view that policy is restrictive—another certainty that may not be so. “Restrictive” implies that policy is slowing growth, but there is scant evidence of that in economic data. Even the Fed’s own March Summary of Economic Projections (“SEP”) forecasts marked up growth for 2024 to 2.1% from 1.4% in December—which is also above the long-run estimated equilibrium rate of 1.8%.
When pressed for evidence that policy is restrictive, the Fed has pointed to either the real policy rate relative to history, or to slowing labor markets. On the former, while there is little doubt real rates are high versus history, it’s uncertain where that real rate lies relative to “neutral” (a rate that neither stimulates or constrains economic activity). While no one knows where that neutral rate lies, structural economic changes suggest that it has increased post-COVID—and potentially significantly so. This would mean that policy just ain’t so restrictive. And in terms of labor markets, most of the cooling that we’ve seen so far has nothing to do with Fed policy. Rather, it has been due to the supply side healing in the form of higher labor participation and increased net international migration growing the pool of workers.
With bond markets more aligned to both the Fed’s projected rate cuts and the realities of a stickier path of inflation and higher growth, what we’ve described as “maintenance cuts” of 75 bps seem more reasonably priced into the yield curve today. This restores a better risk/reward balance to adding duration into portfolios today compared to the start of the year. Maintenance cuts are intended to reduce nominal policy rates as inflation falls. In “real” (inflation-adjusted) terms, this helps to maintain policy rates as opposed to policy becoming more restrictive with real rates rising as inflation falls in the absence of a reduction in nominal rates.
The problem with the idea of simple maintenance cuts is that there is much more influencing policy transmission than just the level of the nominal (or real) policy rate. The anticipation of maintenance cuts in financial markets changes asset prices, and the passthrough of those asset price changes affects the economy either through loosening or tightening conditions. These “financial market conditions” cited frequently by the Fed are measured in several popular indices, yet the science of mapping these measures to their effects on the economy and their equivalence to policy rate actions is far from precise.
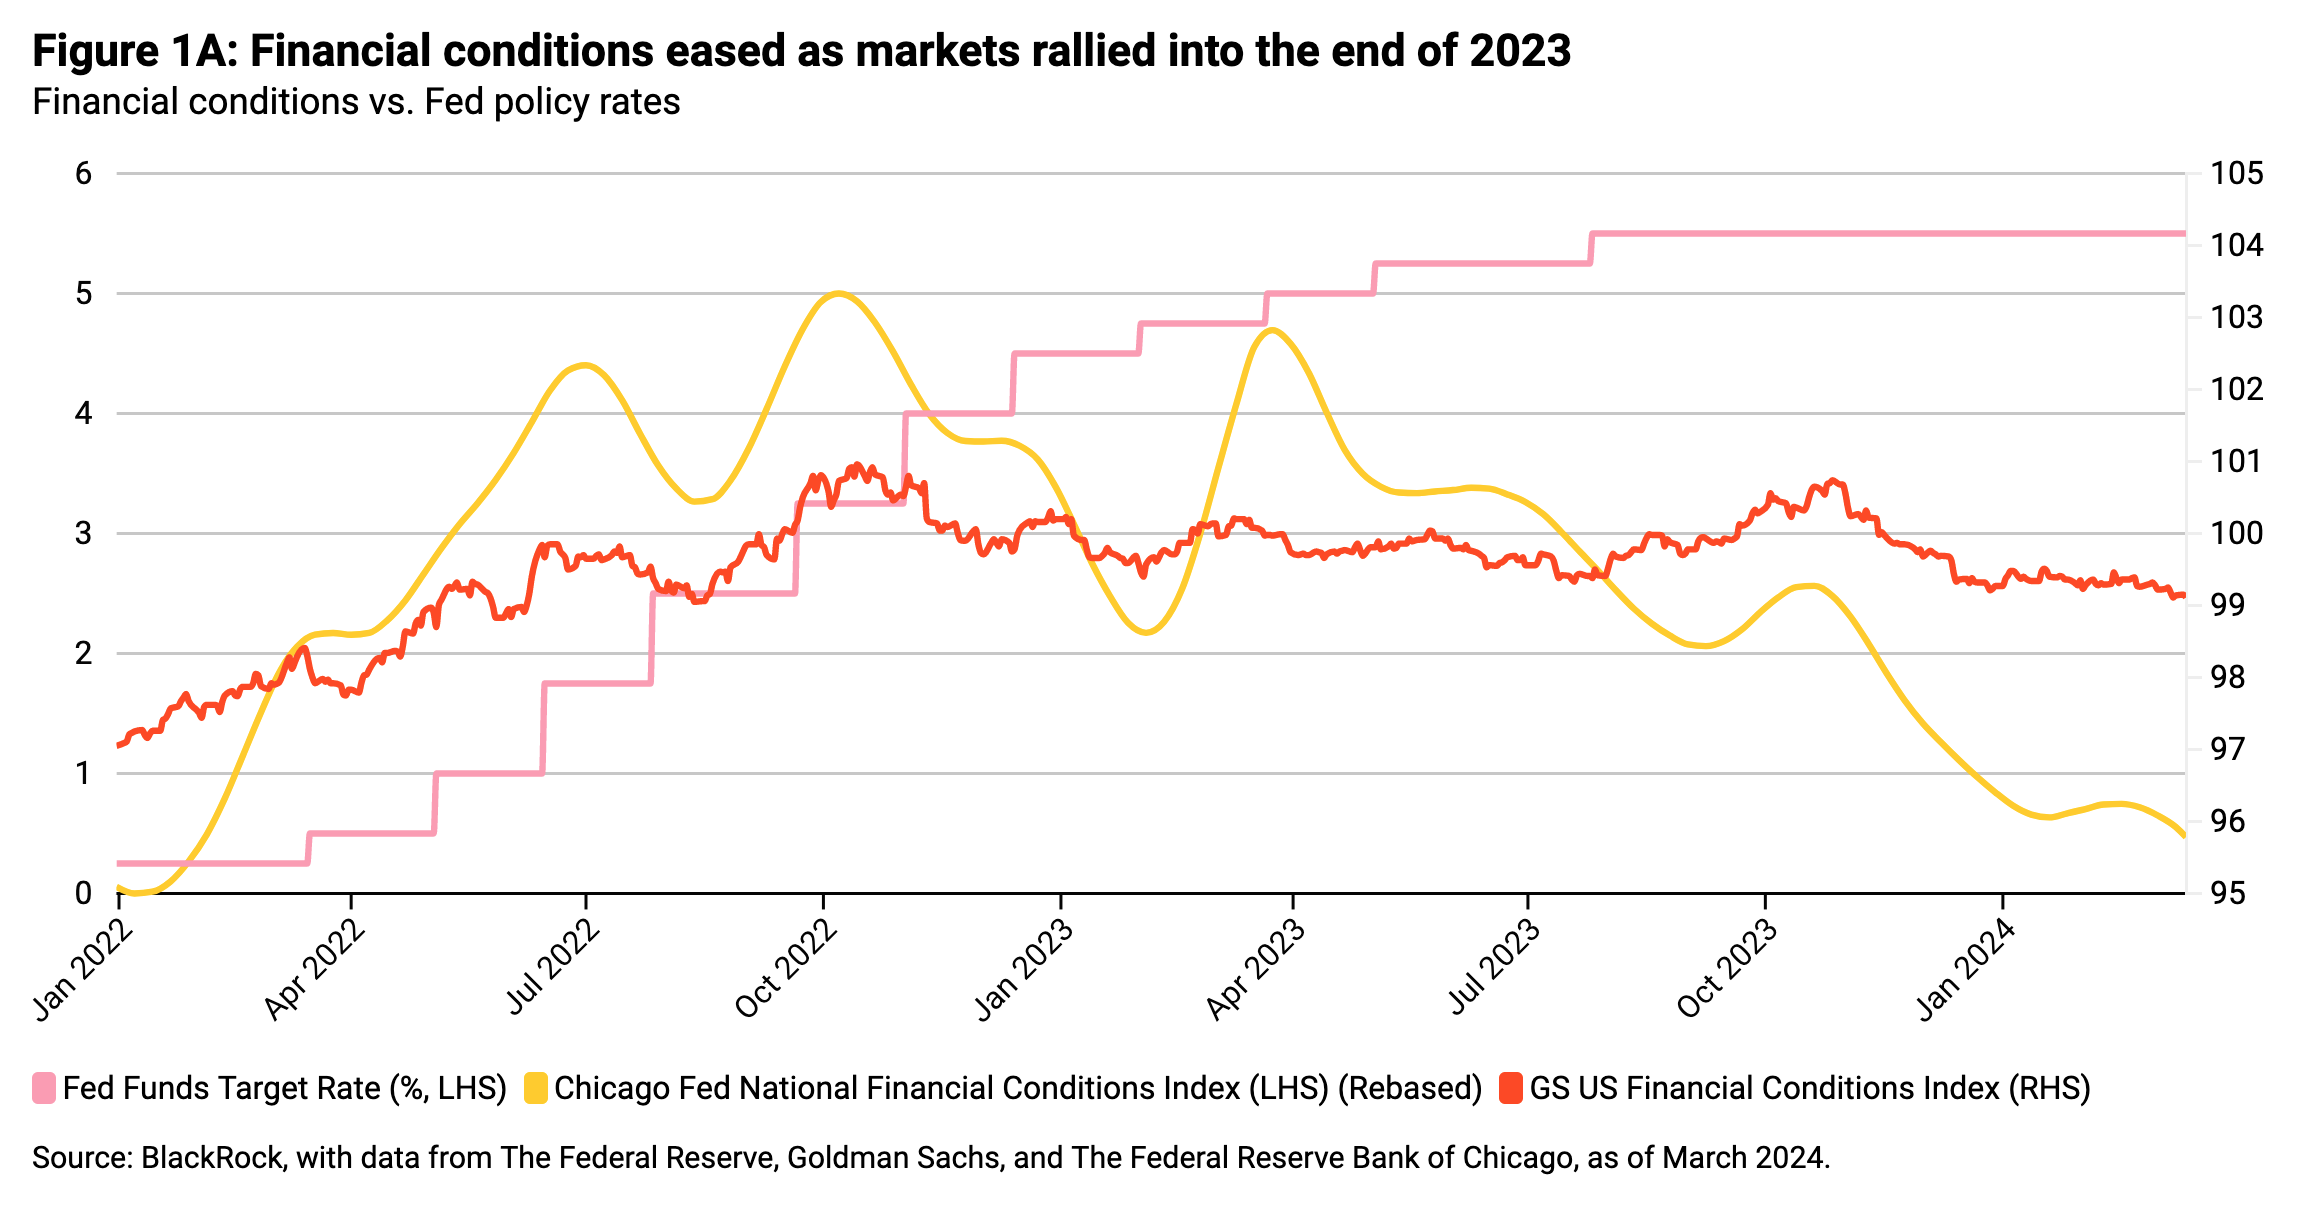
Figure 1A highlights two measures of financial conditions since the beginning of the tightening cycle, one from Goldman Sachs and the other from researchers at the Federal Reserve Bank of Chicago. Both show broadly easing financial conditions in the second half of last year, but to a different extent due to how the measures assign weights to the various components.
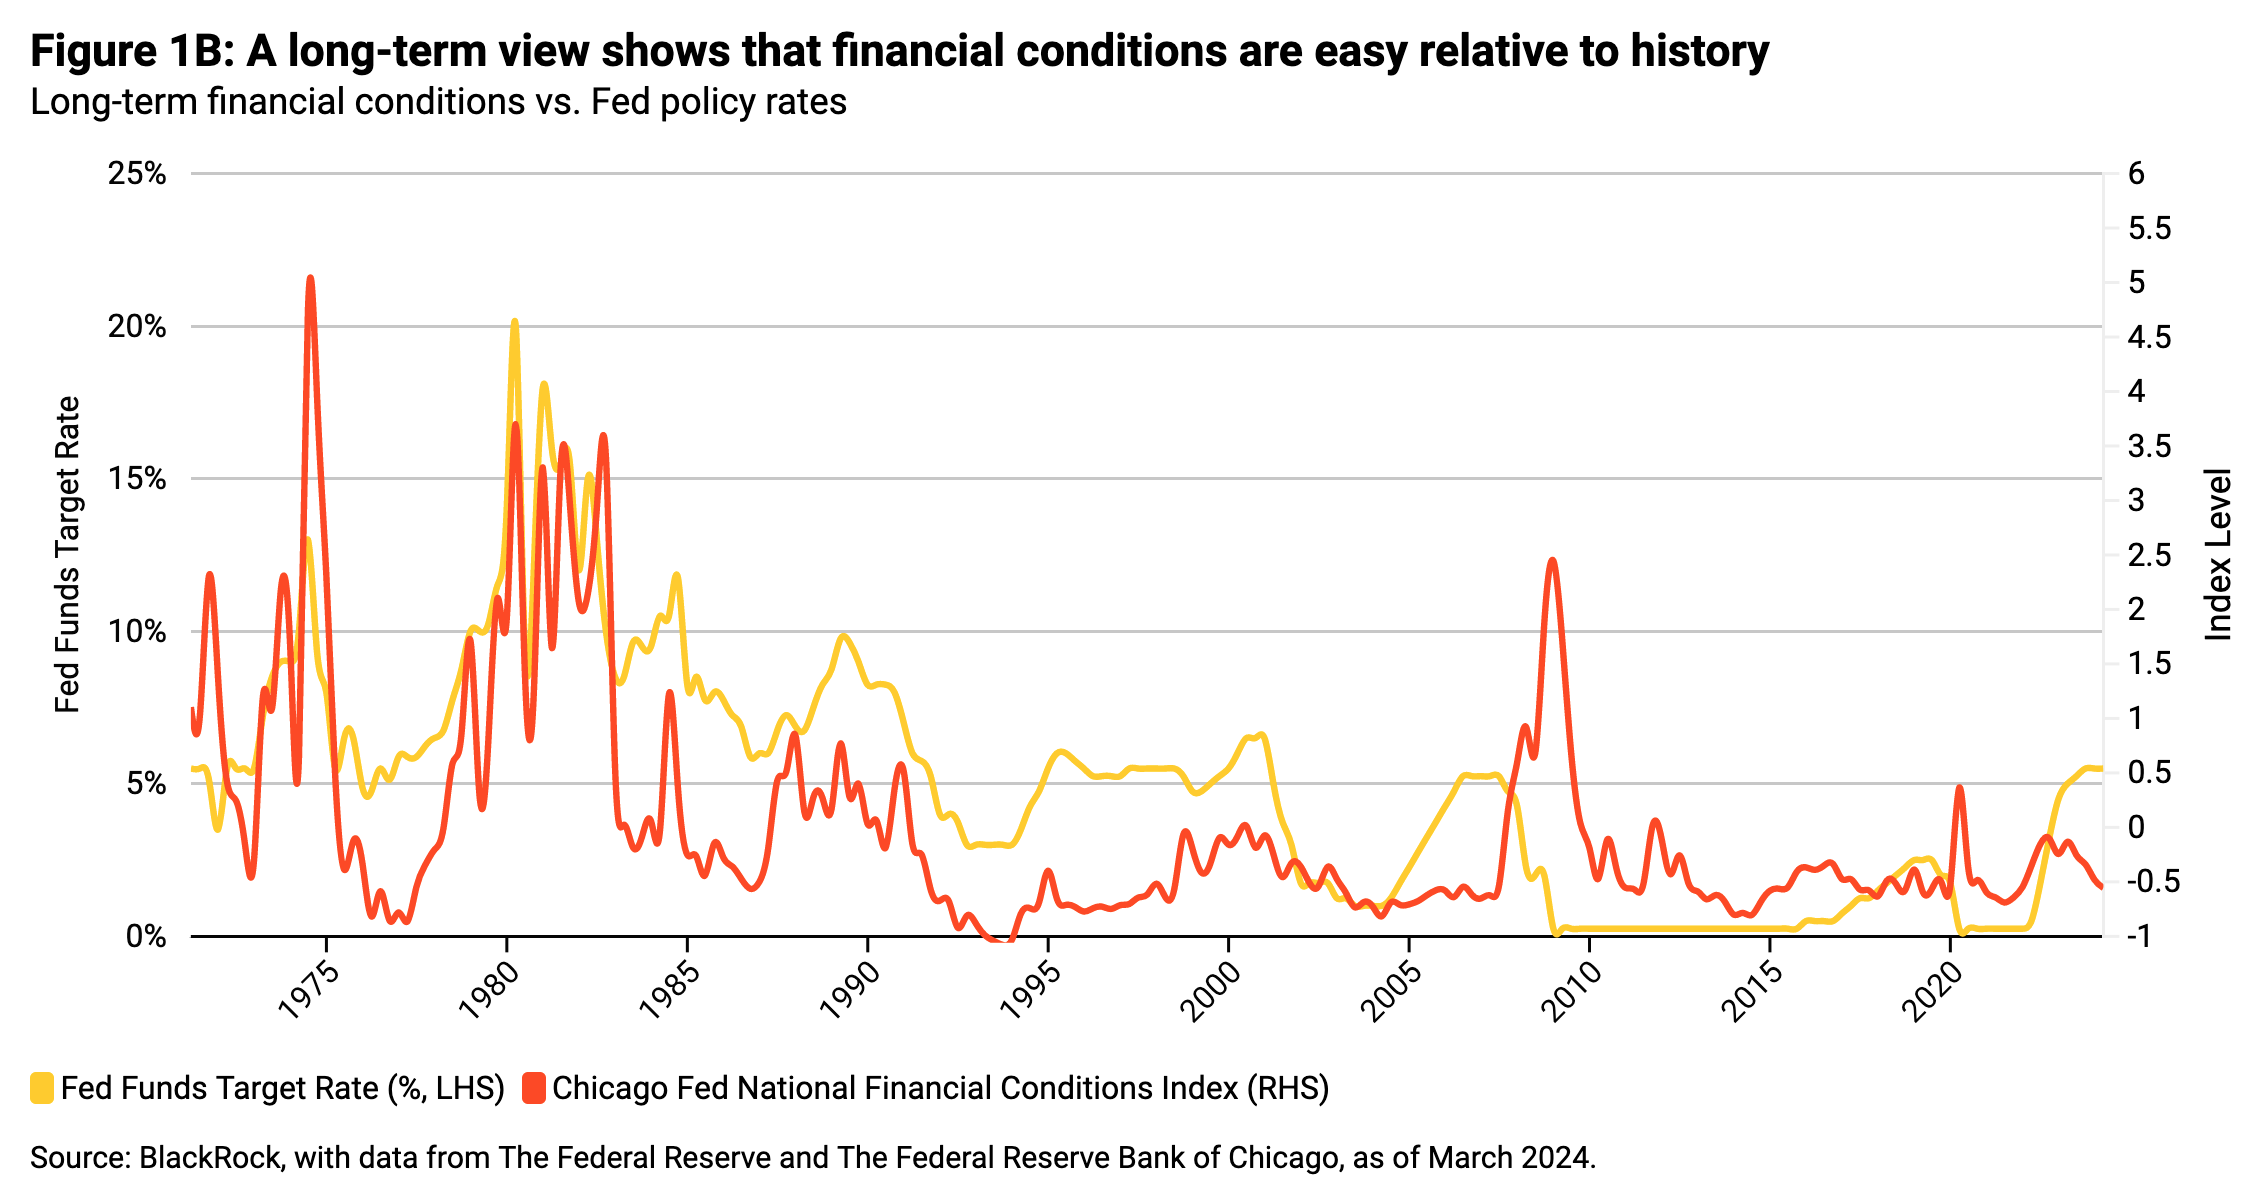
However in both cases, we can see that rapid easing of financial conditions accompanied the decline in inflation and asset market rallies at the end of 2023. Higher interest rates in 2024 were offset by tighter credit spreads and higher overall equity markets, leading to easier financial conditions continuing into this year. Figure 1B shows the same relationship of financial conditions to Fed policy rates over the long-term. This highlights how easy financial conditions stand today relative to both the current level of policy rates and relative to this longer run history.
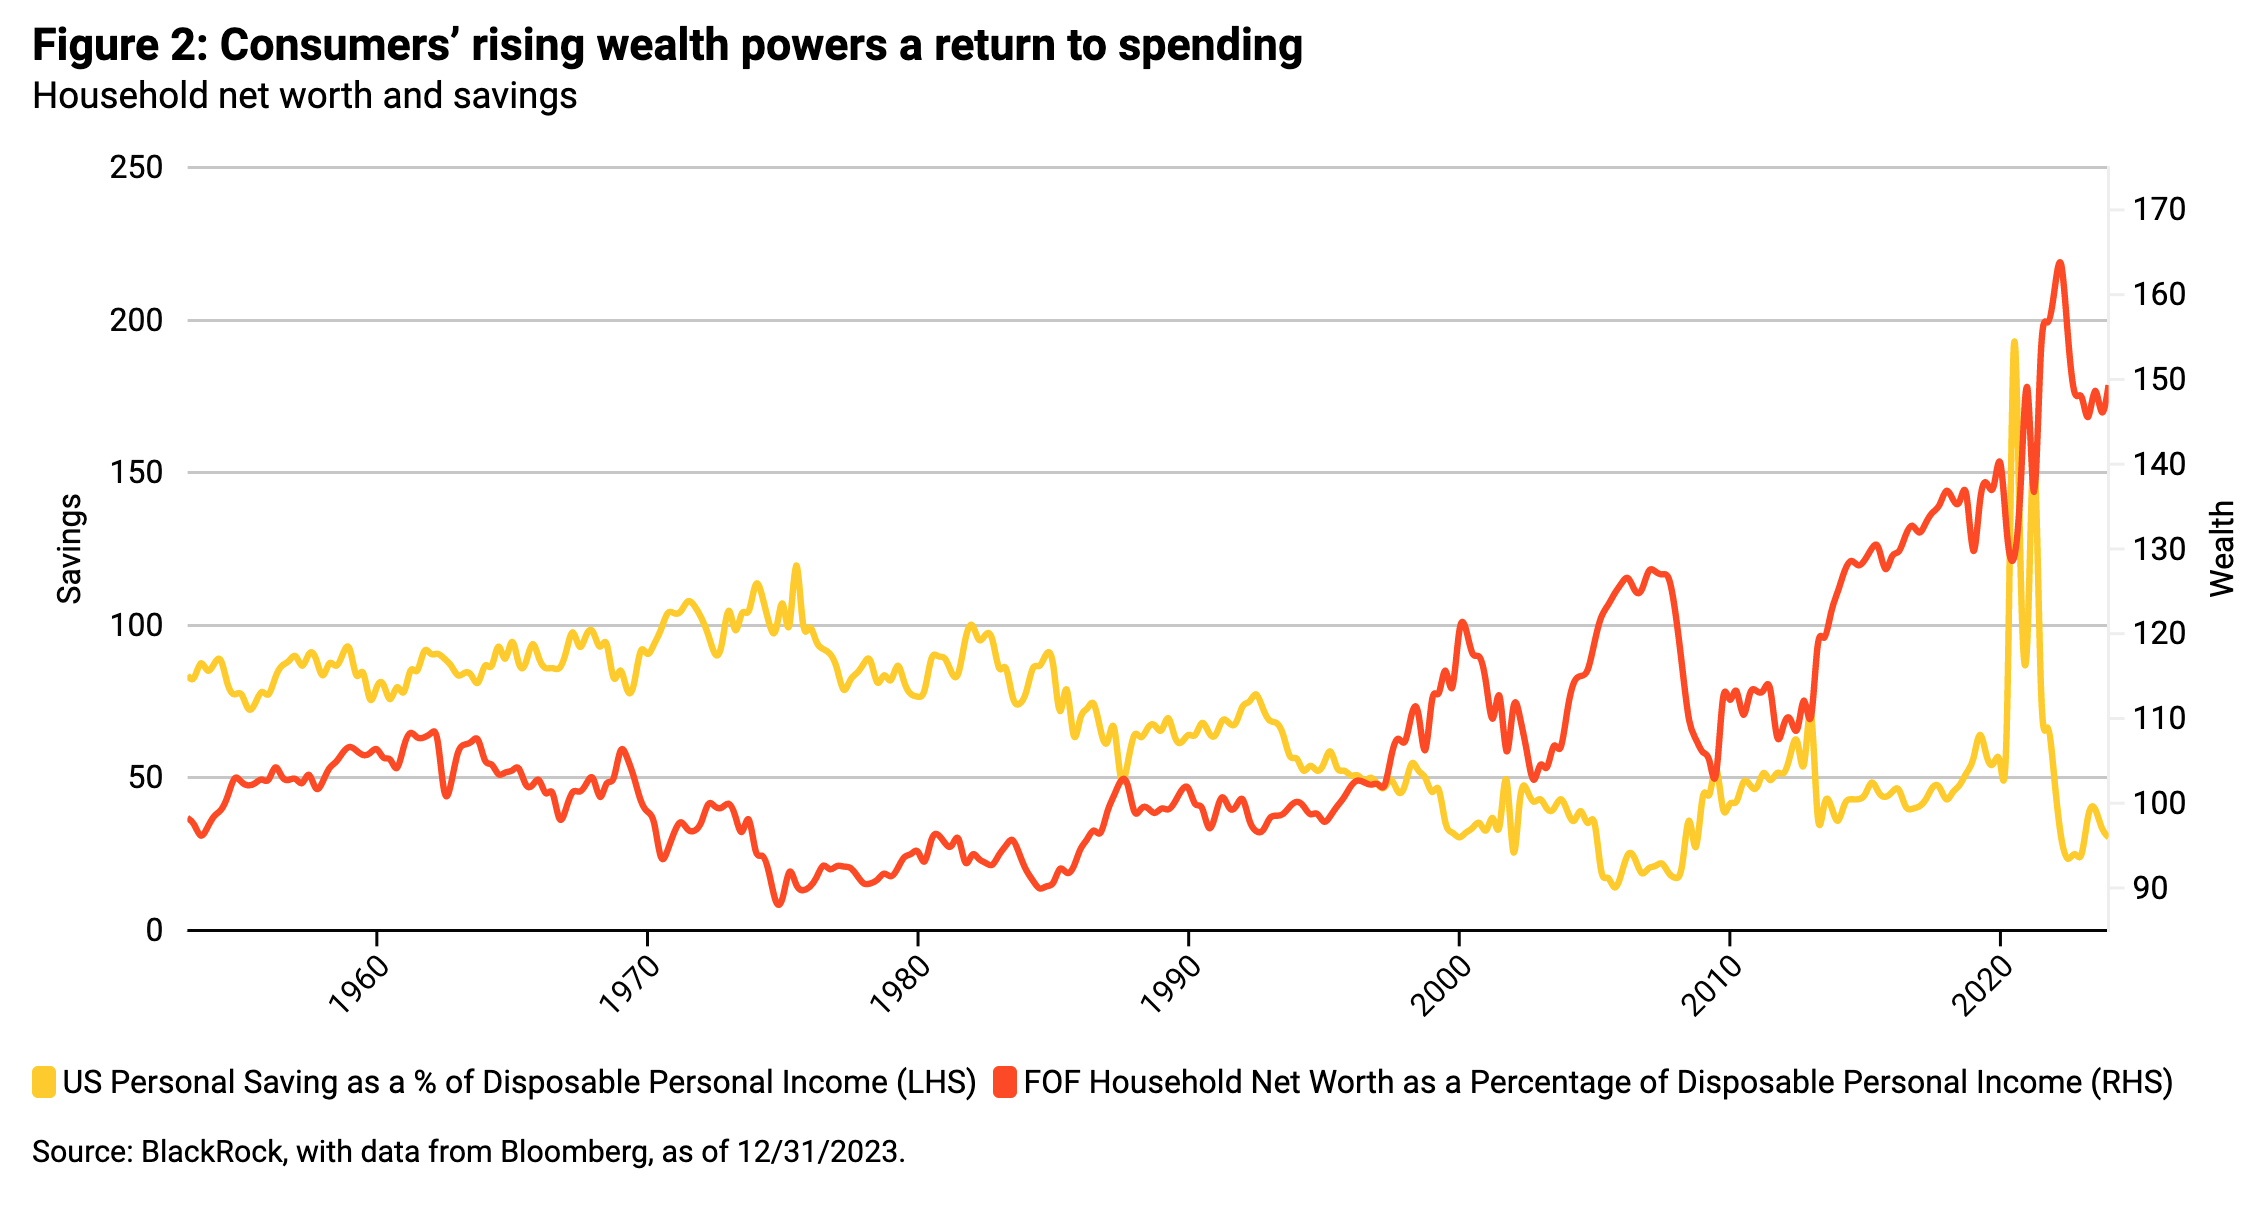
Easier financial conditions transmit into economic growth through multiple channels. Lower financing rates through tighter credit spreads and lower interest rates led to historic levels of corporate bond issuance in the first two months of this year as companies responded to the incentives of lower financing costs. For consumers, rising wealth from rising financial markets directly impacts confidence and spending as illustrated in Figure 2, with savings rates responding (falling) as spending increased with higher wealth.
Too much of a good thing?
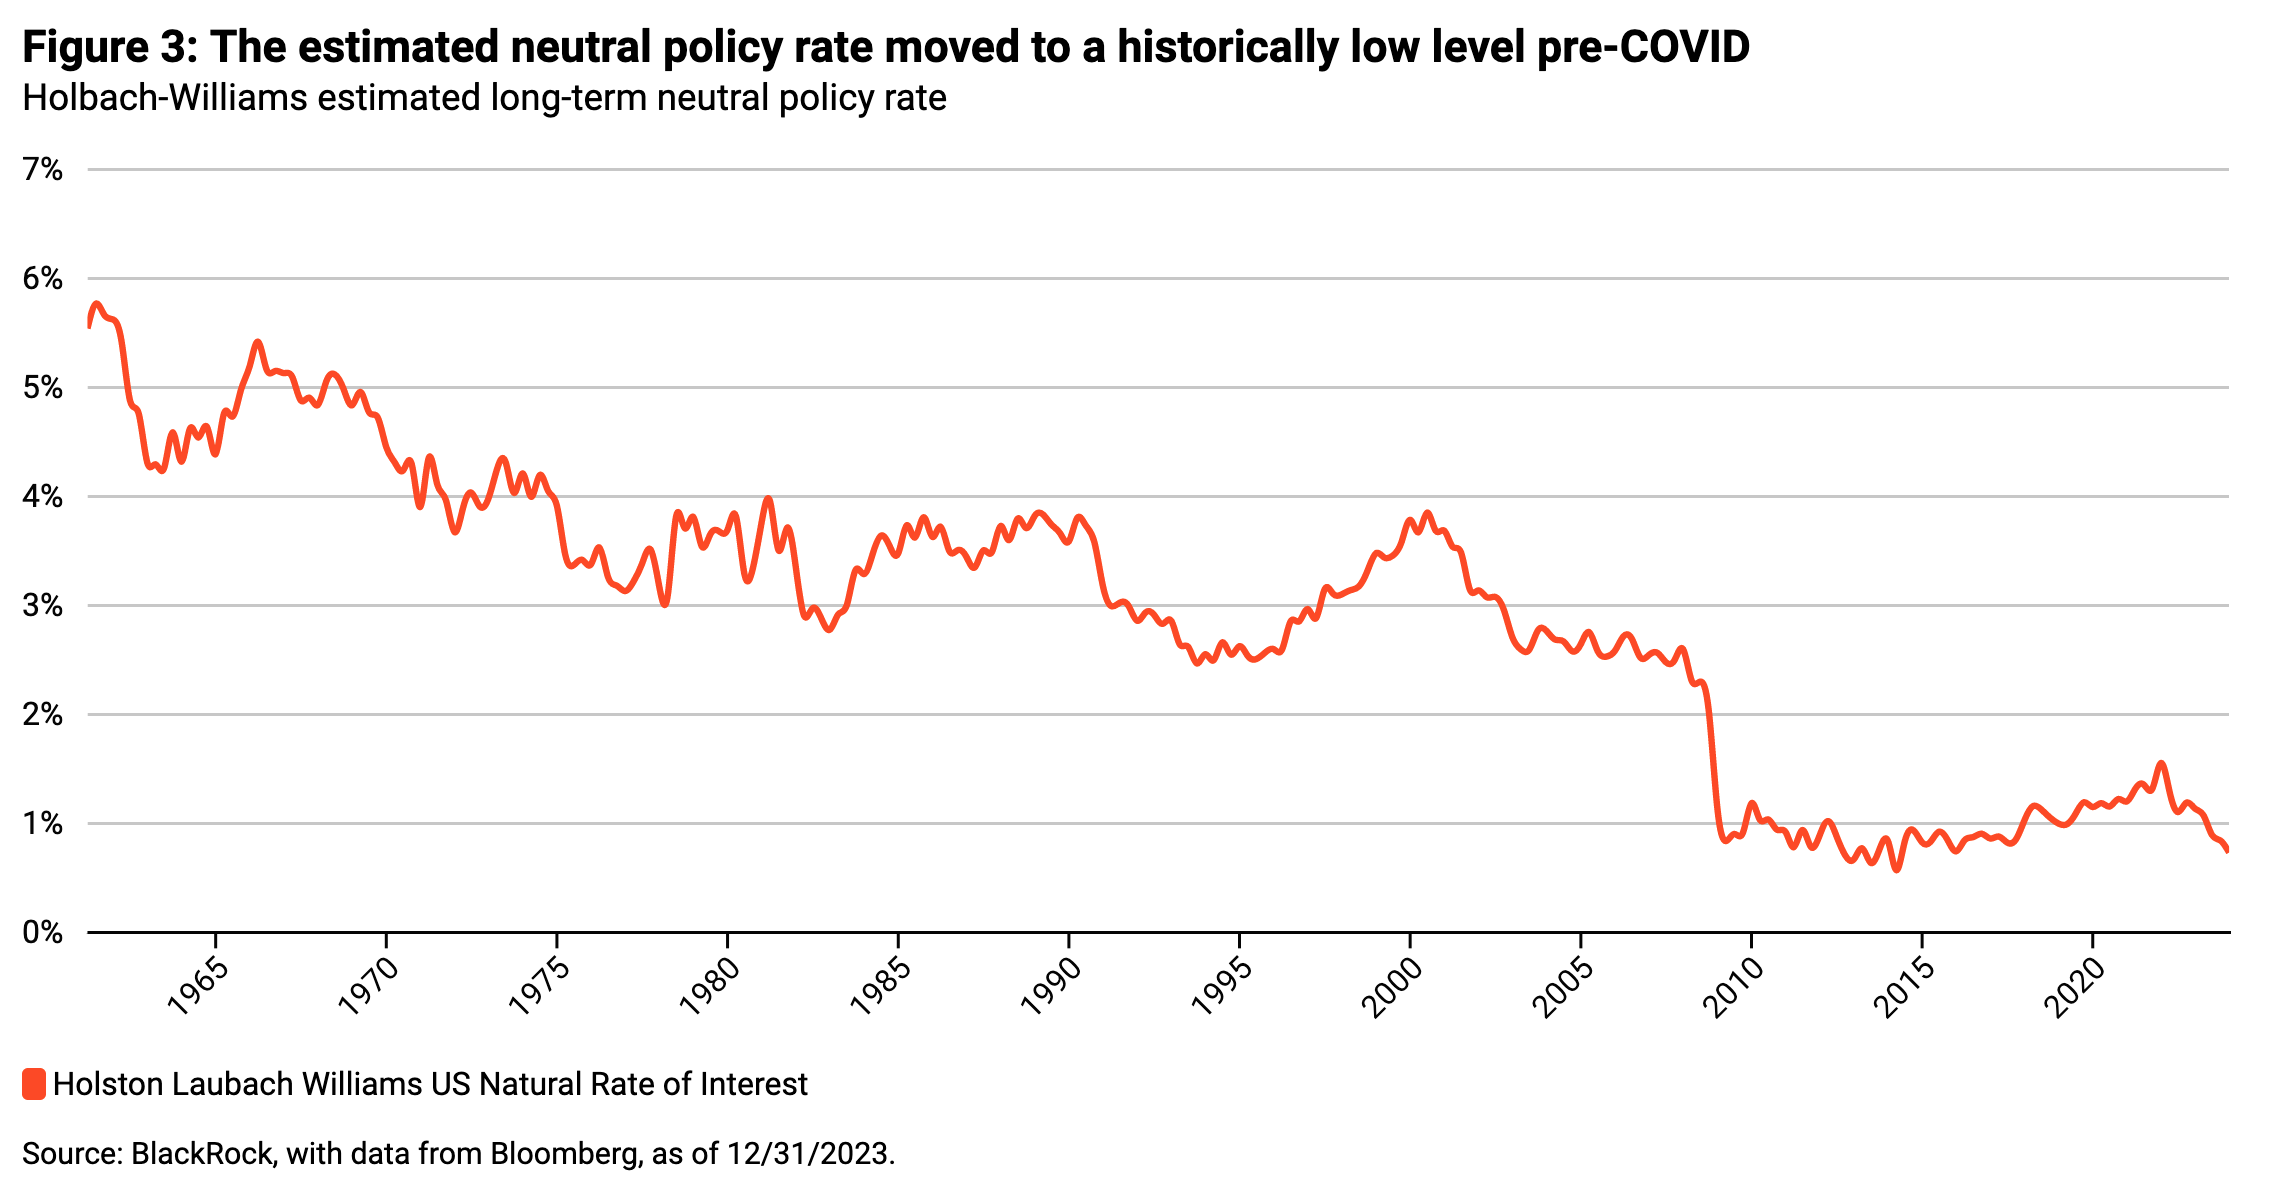
For bond markets, that dynamic may have been too much of a good thing. Policymakers’ main concern in wanting to normalize rates to maintain policy settings is to keep policy from becoming too tight. With reference to historical dynamics, Powell and other FOMC members have referred to policy as “restrictive” as real policy rates (nominal rates less inflation) stand at 250 bps (using 3% inflation) or 350 bps (using 2% inflation). That is 2-3% above where most economists have considered “neutral” rates to lie—the “north star” for this “r-star,” which is the representation of the neutral policy rate in models for setting and estimating policy.
Yet, estimates for this neutral rate have moved around throughout history and landed at this historically low level in the pre-COVID period. Figure 3 highlights this through the Holbach-Williams model estimate of the long-term neutral policy rate.
How do we know for sure if we are still in a low real neutral rate world? We’ll know r-star when we see it in the data—evidenced by the economy starting to slow. But that has yet to happen, and appears to be moving in the wrong direction with stronger growth. That may be partly due to the slippage in the passthrough from policy rates to actual restrictiveness through the easing of financial conditions. It also may reflect the unique challenges in conducting monetary policy alongside the historic swings in fiscal policy in response to COVID shocks on the supply side of the economy. And part of it may be driven by structural changes to the economy accelerated by COVID increasing the level of real neutral rates.
The bottom line is that uncertainty over exactly how restrictive policy stands increases the longer that economic growth exceeds the Fed’s forecasts, which reduces the need and desirability of normalizing interest rates.
Our expectations remain that a rate cut of 25 bps at every other meeting this year will deliver 75 bps of normalization. But like the Fed, that is data dependent in our case on inflation moderating enough (consistent with the 2.5-3% current inflation rate). This is less easing than what many hoped for at the start of the year, but still enough to deliver decent bond market returns and supportive policy to risky asset returns (mostly from income rather than price appreciation) in fixed income.
Where you hold your duration matters as much as how much you hold
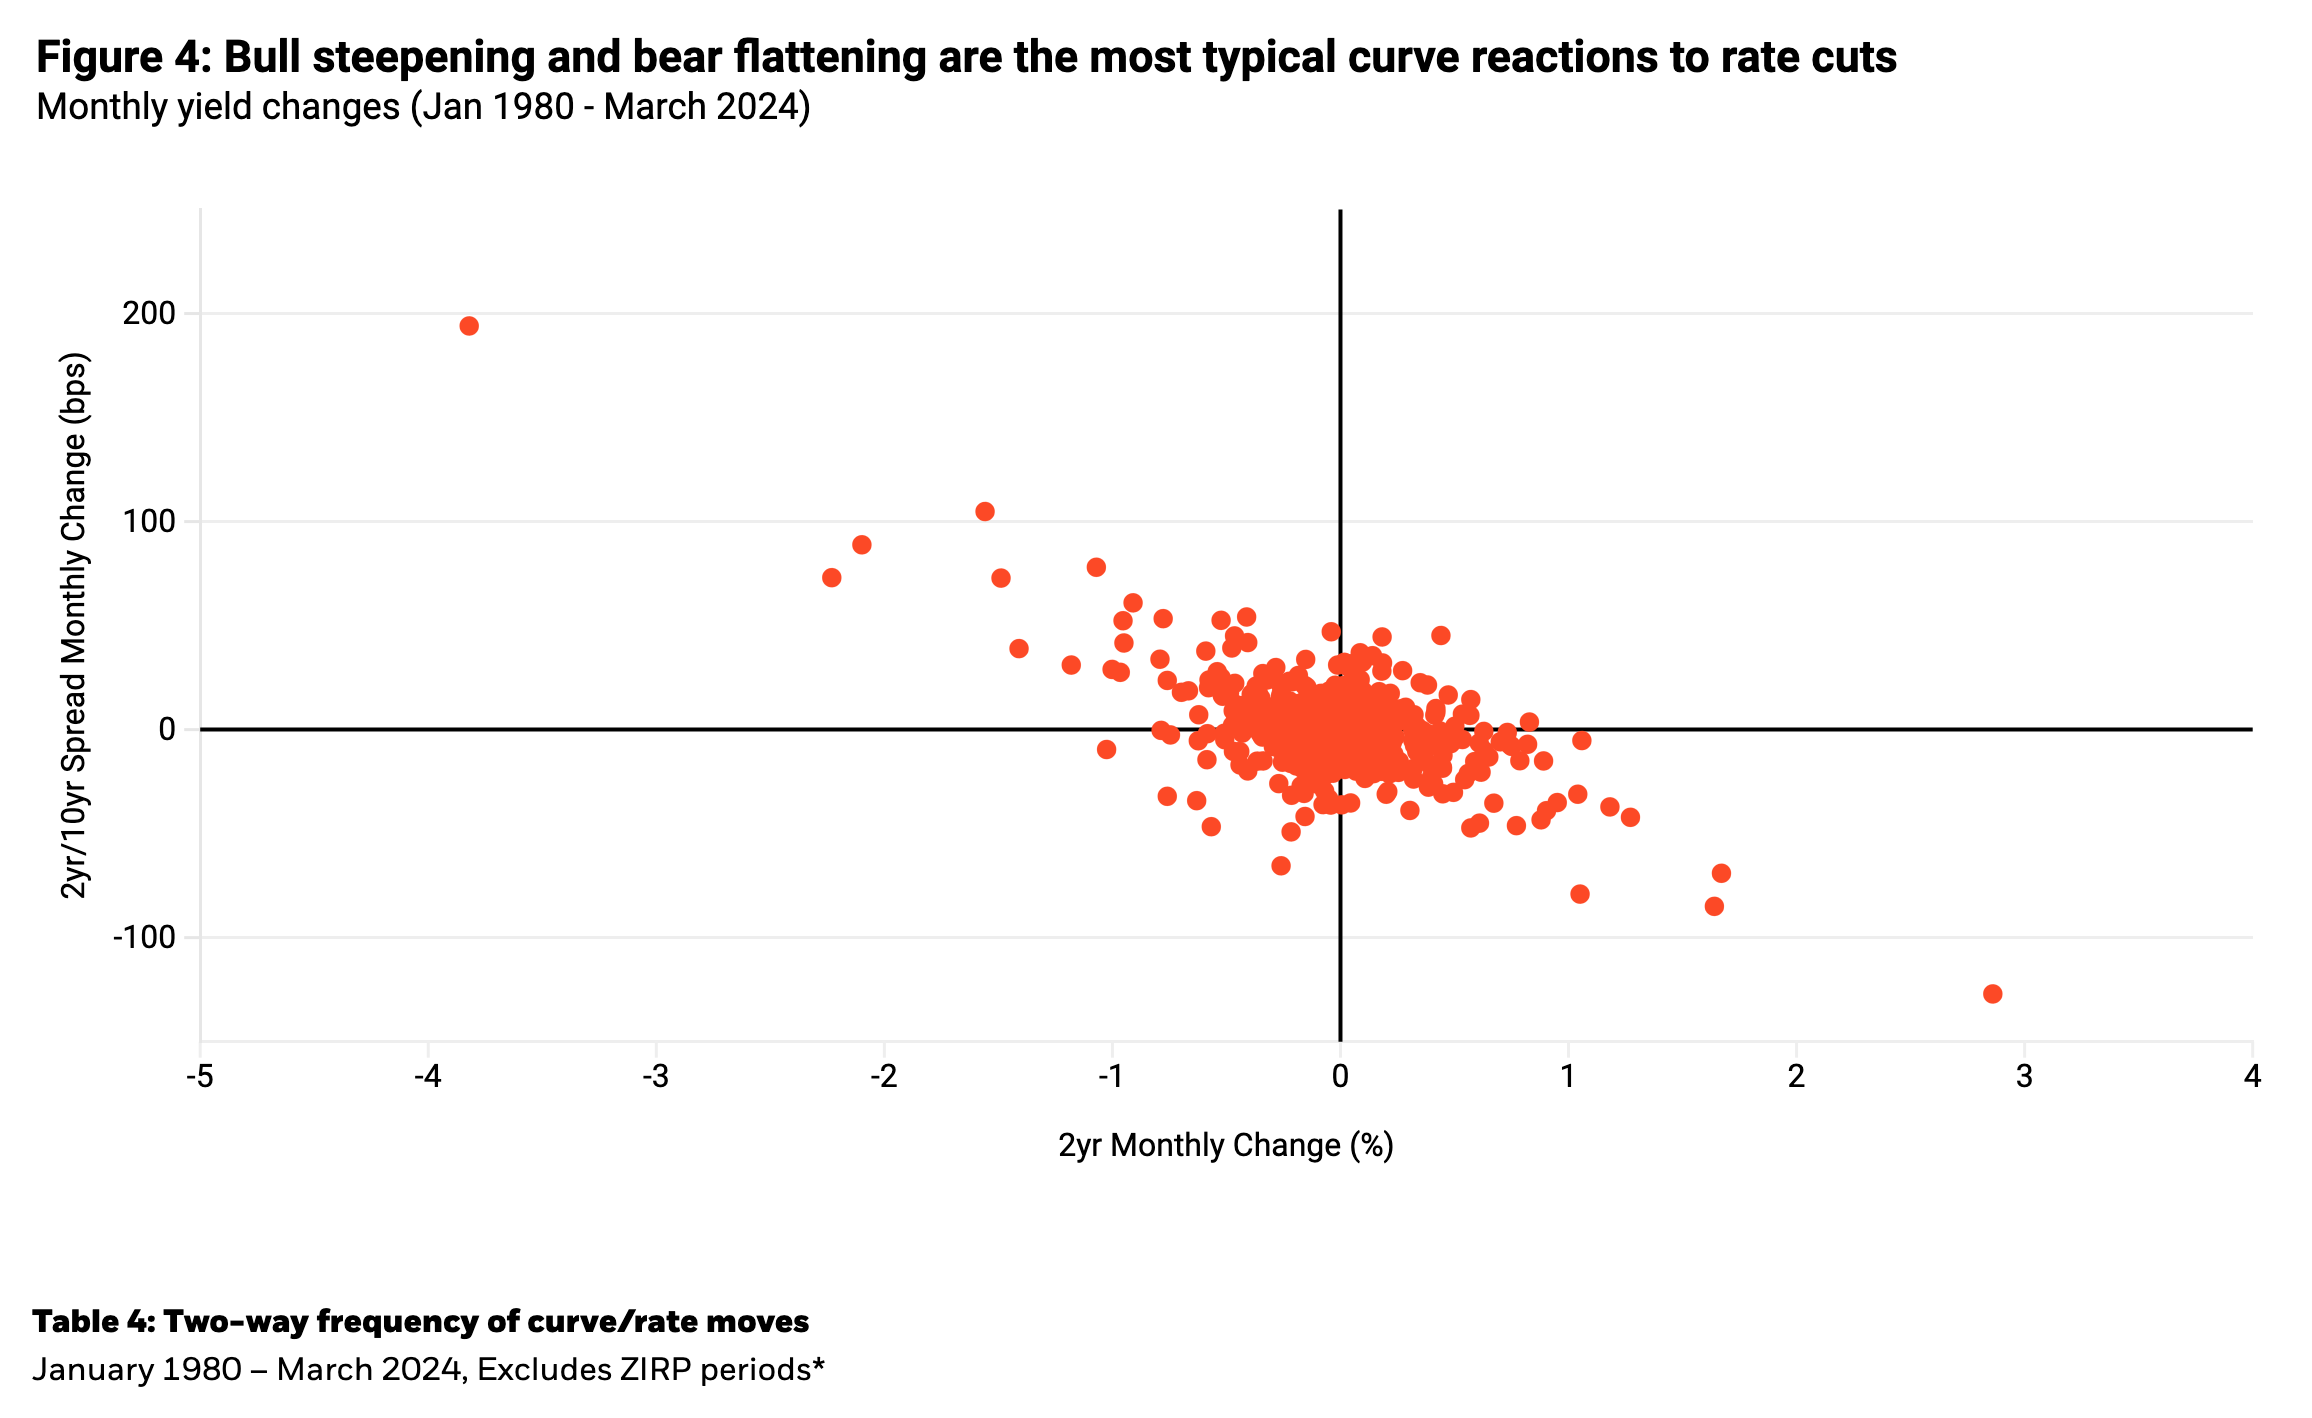
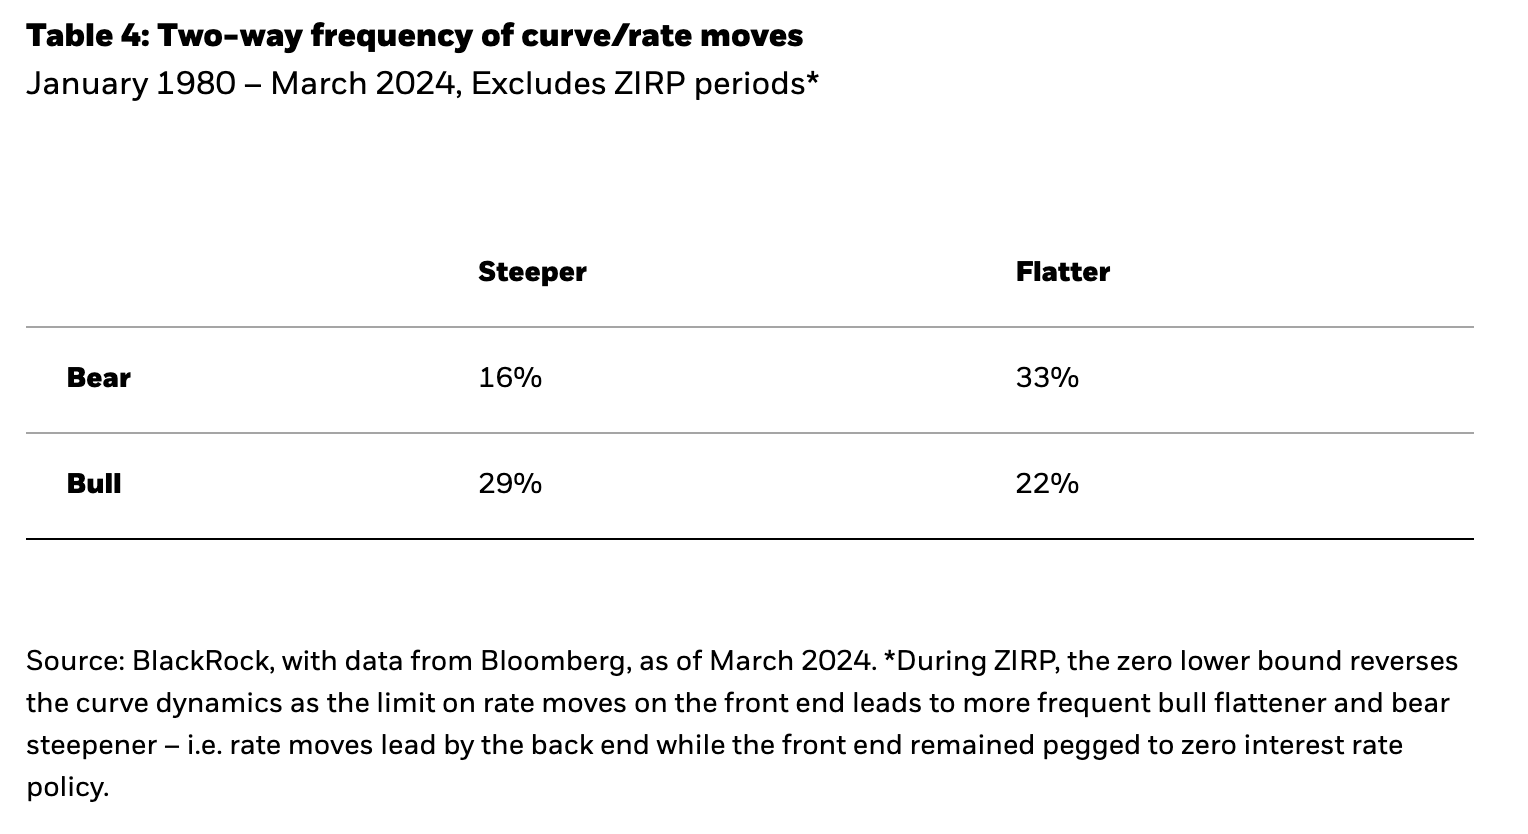
What happens to bond market returns when the Fed does start cutting rates? Expecting falling rates and buying the largest amount of duration possible may not be the optimal strategy. During Fed easing cycles, interest rates that are closest to the Fed’s policy rate react the most to rate cuts, while longer maturity rates react less. Figure 4 and Table 4 highlight this historical tendency of the curve to steepen during cutting cycles.
Source: BlackRock, with data from Bloomberg, as of March 2024. *During ZIRP, the zero lower bound reverses the curve dynamics as the limit on rate moves on the front end leads to more frequent bull flattener and bear steepener – i.e. rate moves lead by the back end while the front end remained pegged to zero interest rate policy.
Table 4 shows that most curve movements follow the “bull steepener” or “bear flattener” pattern. These patterns reflect policy easing and tightening cycles and the impact of those cycles on both the level of rates and the shape of the yield curve. Less frequently, curve and rate movements reflect other dynamics outside of these more typical rate easing and cutting cycles. As the more frequently observed bull steepening and bear flattening movements in the table lie on the negative 45 degree diagonal, we often refer to these as the “off diagonal” curve movements. The significant periods of bear steepening we observed in 2023 for example represented one of the longer periods of an off-diagonal move, which in turn reflected the unique aspects of policy expectations holding short term interest rates down while periods of rising inflation fears led to increases in longer dated interest rates. In this way, curve dynamics were less reflective of expected policy changes and more reflective of changes in inflation expectations.
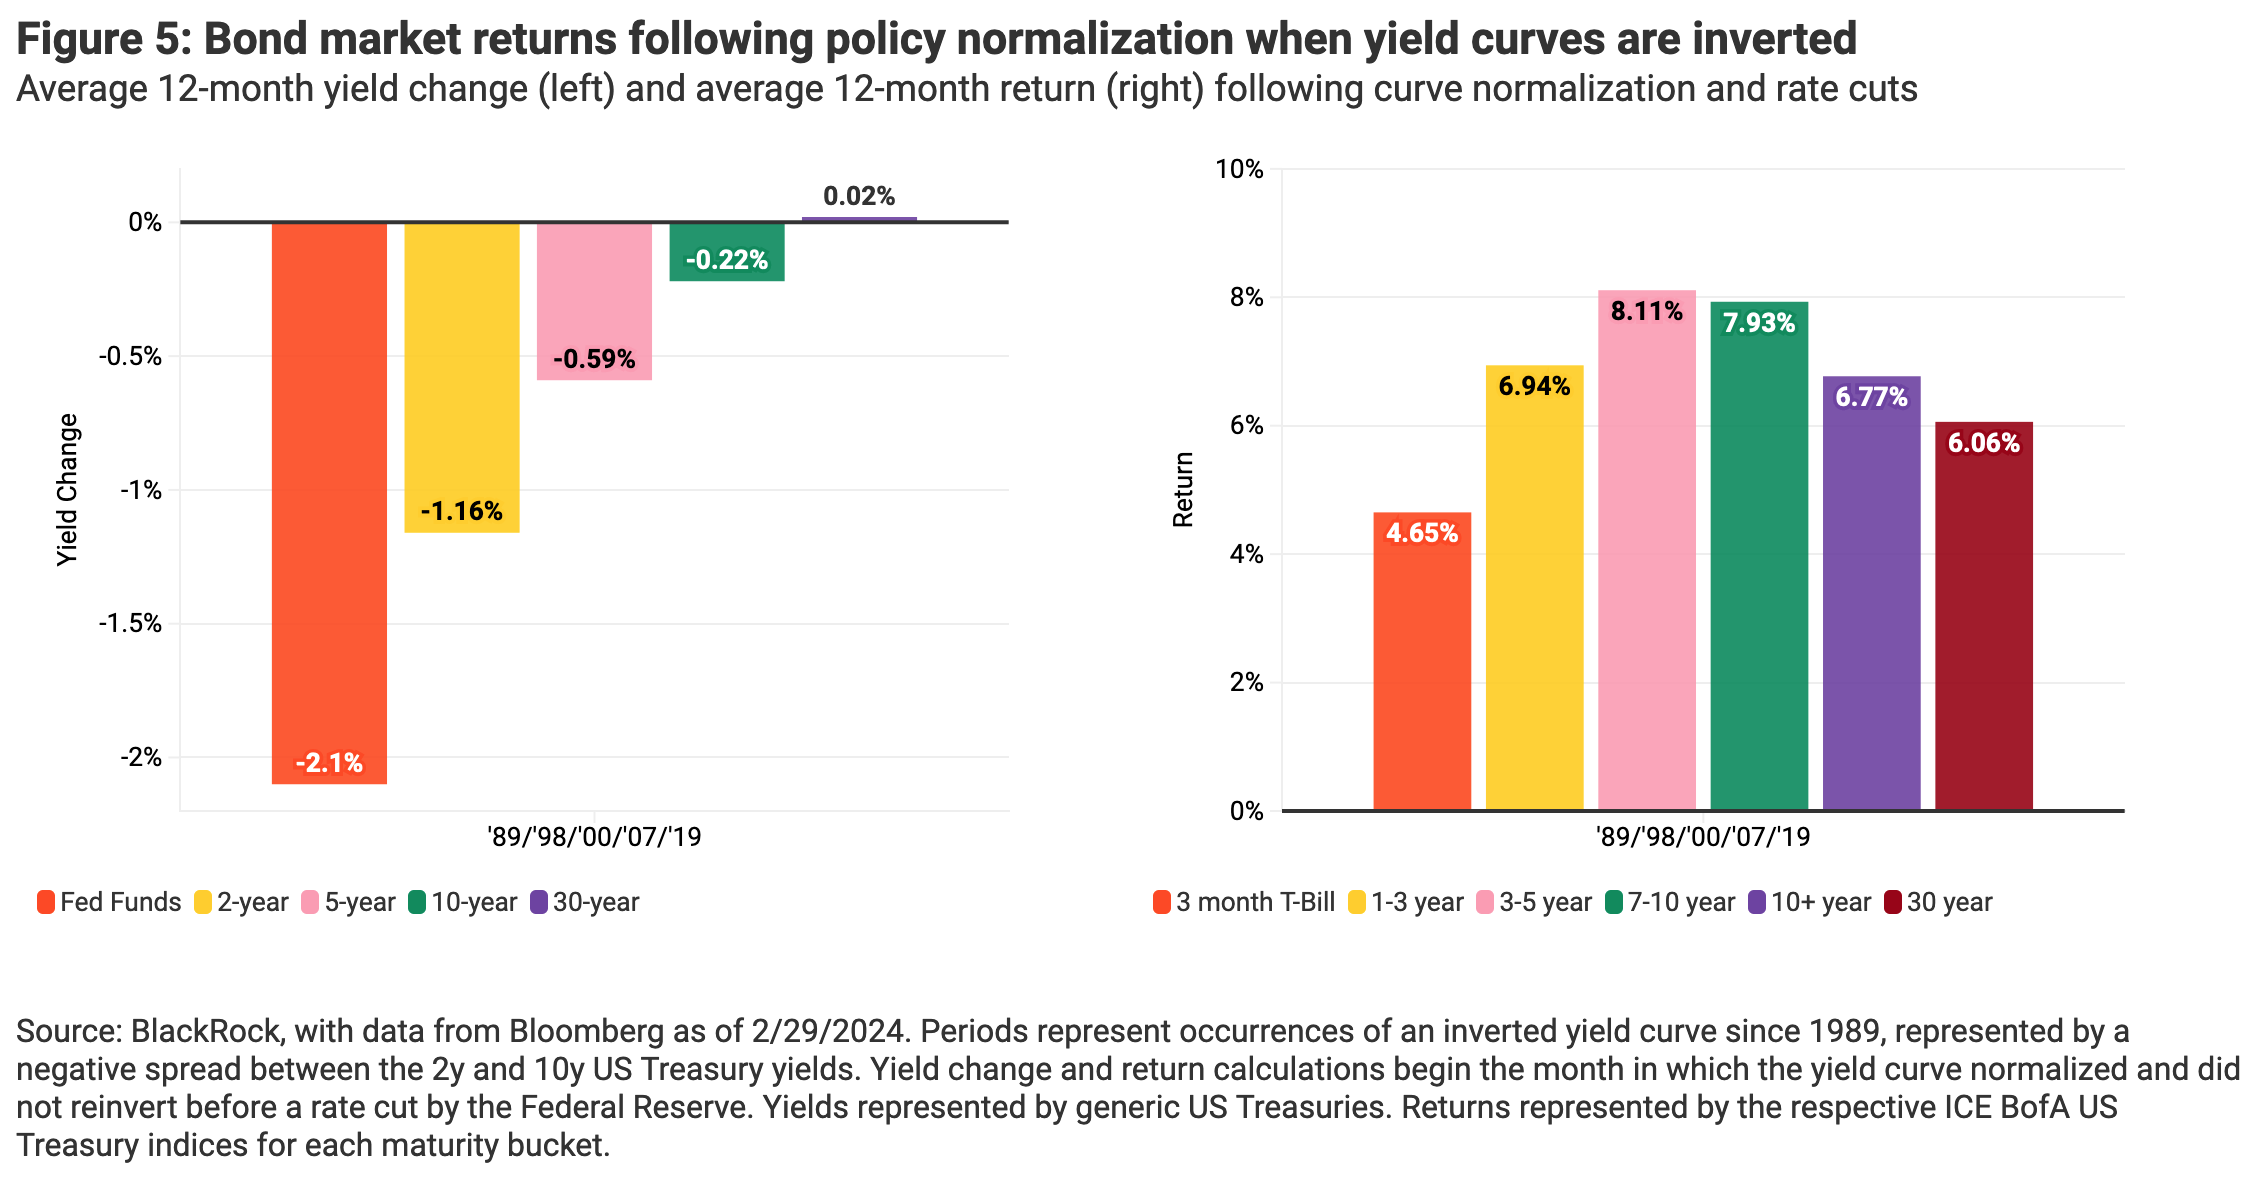
In contrast, for 2024, expectations for the Fed to begin cutting rates are driving consensus expectations for this more typical “on diagonal” behavior to reassert itself. Figure 5 highlights the impact of the expected “bull steepening” on bond market returns by maturity, adding in the unique dimensions of bond market performance during a rate cutting cycle with the starting point of shorter maturity interest rates exceeding longer dated rates (yield curve inversion).
As shown in the left chart of Figure 5, during Fed normalization, the yield curve steepens as shorter maturity rates most closely follow Fed policy rates while longer dated rates lag. The chart on the right highlights the impact of this steepening dimension on bond market returns. Taking into account the combination of both yield change and duration, the highest returns are found in the 3-5 year part of the curve. This segment combines enough duration exposure to segments of the curve with more significant yield declines. Moving shorter on the curve increases the capture of yield changes, but with less duration, leads to lower returns. In contrast, the knee-jerk reaction to hold the longest duration exposure leads to lower returns as this segment of the yield curve typically declines less as rates are cut.
St. Augustine and the curve steepener trade
It’s important to consider that bond returns are as much about yield as they are about yield change. Today’s inverted yield curve makes moving out of the shortest end of the curve—even cash—punitive in terms of total returns in the absence of anticipated curve normalization. And the longer it takes for the anticipated rate cutting cycle to prompt the bull steepening of the yield curve, the more money is lost positioning for that steepening. As St. Augustine said to his financial advisor, “Give me the bull steepener, but not yet!”
For the suggested curve positioning in Figure 5 to work, the curve needs to steepen.1 For the curve to steepen through lower front end rates, the market needs to believe the Fed will deliver on its promise of a cutting cycle. And as long as the data—whether stronger inflation data or stronger growth data—leads the Fed to question the wisdom of starting that cycle and how deep to make those cuts, market participants may question the Fed’s resolve as well.
The decoupling of “quality” in equity and credit markets
While last year’s stock returns strongly corresponded with shifts in inflation and rate expectations, this year we have seen a more steady focus on a combination of secular tech growers coupled with quality balance sheet exposures. This appears to reflect a greater dominance of the numerator (i.e. cash flows), as opposed to the expected discount rates on those cash flows that we saw last year. One possible reason for the focus on earnings and quality balance sheet exposures is related to concerns over the impact of rising rates eventually hitting more exposed (i.e. leveraged) balance sheets harder, along with the possibility of higher-for-longer Fed policy holding up refinancing rates. However, the easing of financial conditions would seem to erode this rationale for holding quality stocks.
So we consider a different explanation for this year’s outperformance of quality stocks in the context of portfolio construction. Large cap secular growth technology companies now constitute nearly 30% of the market capitalization of the stock market. For market-weighted portfolios, that means a rising concentration of risk in these names. Hence, the desirability of holding more quality companies against those increasingly concentrated tech positions makes sense to balance out portfolio risk.
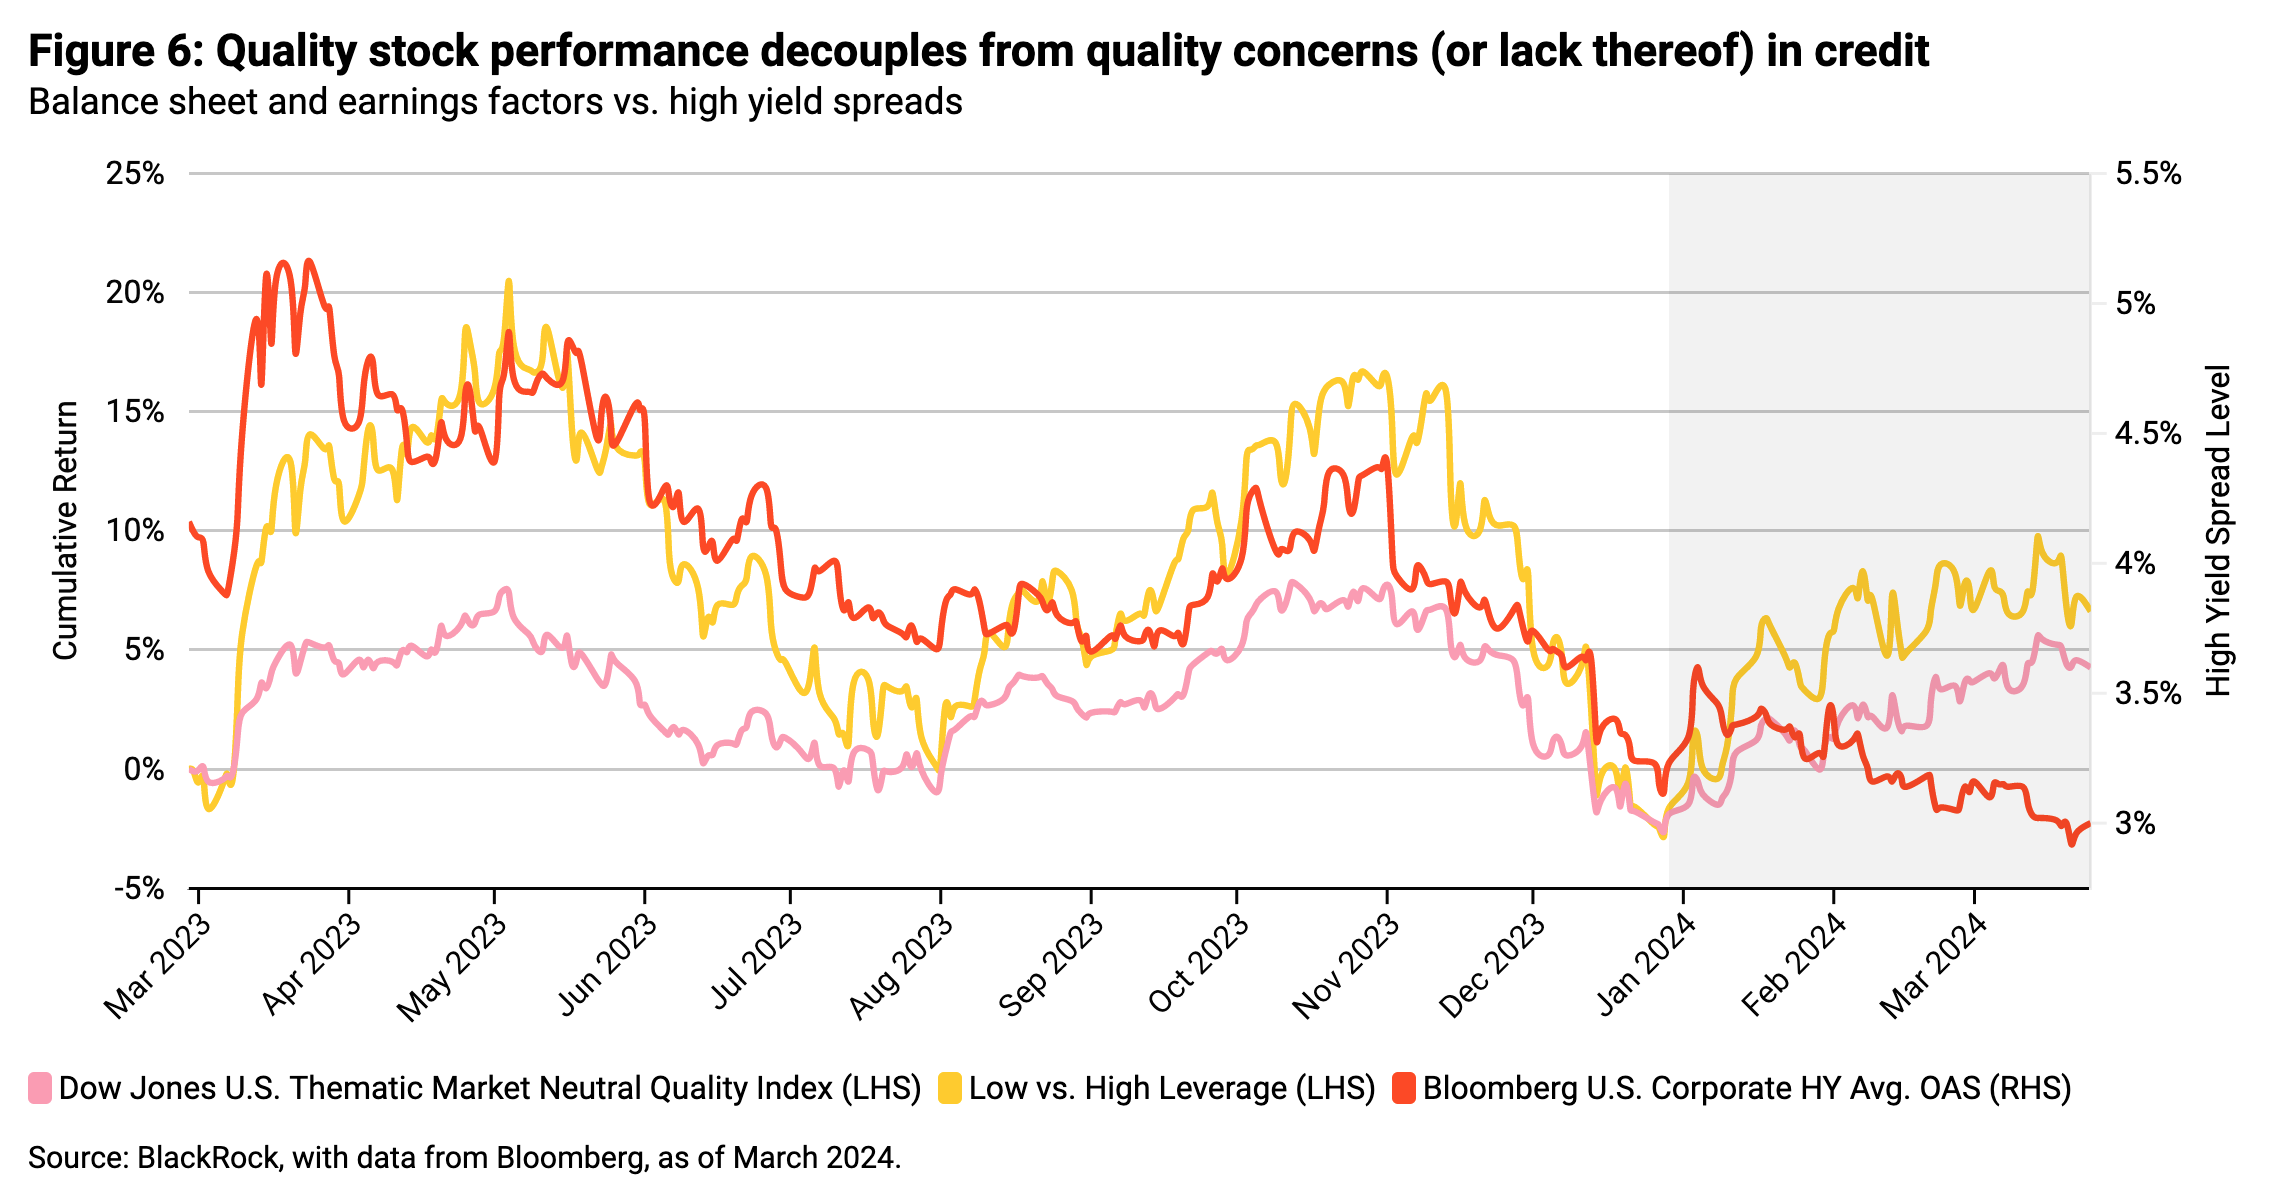
Figure 6 highlights factor performance based on quality and leverage next to High Yield credit spreads.
Frequently, we see credit and equity measures of balance sheet quality move in tandem. Wider credit spreads frequently imply credit stress, which leads to better relative equity performance from lower credit risk (high quality) names. It is notable that so far in 2024, the equity market shows a preference for quality names despite seeing little stress in credit markets. Credit markets have been “the dog that didn’t bark” during the recession fears of last year. With better growth expectations and declining default expectations, the tightness of credit spreads now appears more justified.
In this context, the outperformance of high quality stocks seems to be the most out of synch. And as suggested, the outperformance of quality stocks may have more to do with the outperformance and concentration of riskier stocks in the portfolio than with concerns over credit conditions in the bond market.
Conclusion
With bond market pricing more in line with the Fed’s anticipated June start to an every-other-meeting cutting cycle, we see better entry points for duration. And with typical steepening curve behavior anticipating that rate cut cycle, soon may be a better time to position for that with shorter maturity exposures (3-5 year maturities) vs. cash and longer dated exposures.
The outperformance of quality stocks appears more related to concerns over tech concentration than an imminent signal of economic deterioration as the latter is slowing but to a stronger end point than previously forecasted.
What we don’t know is less a worry than what we know for certain that just ain’t so. A Fed that ends up cutting less or even not at all because financial conditions easing undermined its policy tightening remains a risk to these positions to closely monitor.
Jeffrey Rosenberg, Sr. Portfolio Manager, Systematic Fixed IncomeJeffrey Rosenberg, CFA, Managing Director, leads active and factor investment for mutual funds, institutional portfolios and ETFs within BlackRock’s Systematic Fixed Income (“SFI”) portfolio management team and is the co-lead portfolio manager for the Systematic Multi-Strategy Fund.
Copyright © BlackRock


