Pre-opening Comments for Monday June 26th
U.S. equity index futures were mixed this morning. S&P 500 futures were unchanged at 8:30 AM EDT.
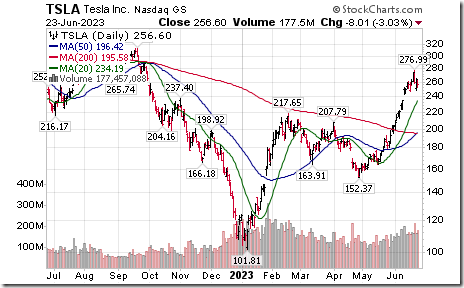
Tesla dropped $8.01 to $256.60 after Goldman Sachs downgraded the stock from Buy to Neutral.
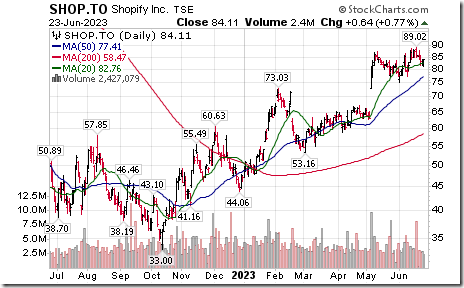
Shopify (SHOP.TO Cdn$84.61)) is expected to open lower on news that the Canada Revenue Agency is examining its tax returns for the past six years.
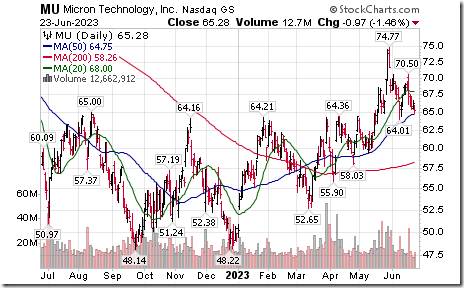
Micron added $0.35 to $65.63 after Stifel Nicolaus raised its target price from $55 to $65.
Moderna gained $2.78 to $121.28 after UBS upgraded the stock from Neutral to Buy.
EquityClock’s Daily Comment
Headline reads “Gauges of risk sentiment turning lower from horizontal points of resistance”.
http://www.equityclock.com/2023/06/24/stock-market-outlook-for-june-26-2023/
The Bottom Line
This week, investors are expected to enter into a “holiday mood” prior to national holidays on July 1st in Canada and July 4th in the United States. Volume in equity markets on both sides of the border typically drops as the week progresses. Price volatility is higher than average. Broadly based North American equity indices have a history of reaching a short term low in the last week in June.
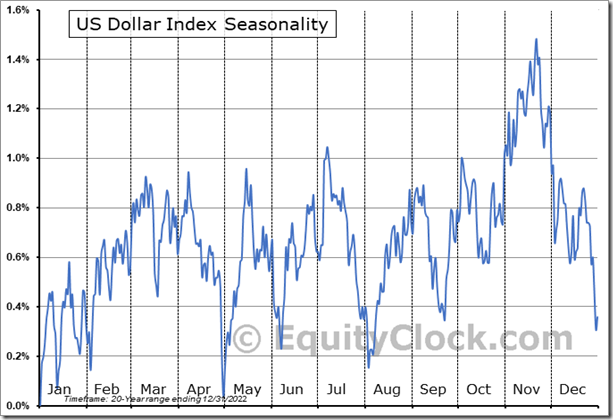
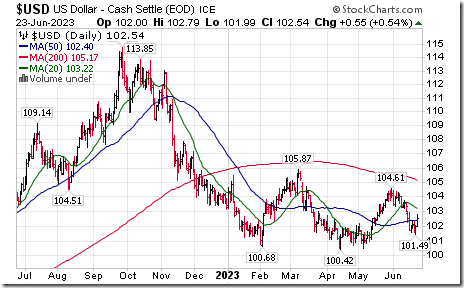
After the early July holidays, U.S. and Canadian equity markets have a history of moving higher to the end of July. Strength is related to several recurring events including anticipation of favourable second quarter corporate results and spending on international holiday travel. This year, spending on international holiday travel is booming. People finally are looking past the Pandemic. Most impacted market is the currency market. The month of July is one of the weakest months in the year for the U.S. Dollar Index. .
A test by the U.S. Dollar Index at par (i.e.100.00) is likely. Weakness in the Index has an inverse impact on other currencies, notably the Canadian Dollar.
Economic focus remains on the Federal Reserve’s Fed Fund Rate. Consensus following Federal Reserve Chairman Powell’s congressional testimony last week is that the Fed Fund Rate will increase another 0.50 basis points at its next FOMC meeting on July 25th -26th. Anticipation likely will dampen investor enthusiasm prior to the meeting.
Also dampening trader enthusiasm prior to July 10th is anticipation of second quarter earnings reports by major North American companies. Consensus for year-over-year earnings per share in the second quarter this year by S&P 500 companies calls for a 6.4% drop. Earnings prospects beyond the second quarter are positive and improving. Traders will watch for market responses to “dreadful” second quarter results. A favourable response will set the stage for a significant upside move by North American equity markets lasting until at least the end of the year.
Economic News This Week
Source: www.Investing.com
May Durable Goods Orders released at 8:30 AM EDT on Tuesday are expected to drop 1.3% versus a gain of 1.1% in April.
May Canadian Consumer Price Index on a year-over-year basis released at 8:30 AM EDT on Tuesday is expected to increase 4.2% versus a gain of 4.4% in April.
May New Home Sales released at 10:00 AM EDT on Tuesday are expected to drop to 657,000 from 683,000 in April.
Next estimate of U.S. first quarter real GDP released at 8:30 AM EDT on Thursday is expected to increase 1.4% versus a gain of 2.6% in the fourth quarter.
May Core PCE Price Index is released at 8:30 AM EDT on Friday. The Index gained 0.4% in April. On a year-over-year basis, the Index gained 4.7% in April. Consensus for May is not available.
May Personal Income released at 8:30 AM EDT on Friday is expected to increase 0.4% versus a gain of 0.4% in April. May Personal Spending is expected to increase 0.2% versus a gain of 0.8% in April.
April Canadian GDP is released at 8:30 AM EDT on Friday. GDP was unchange in March.
June Chicago Purchasing Managers Index released at 9:45 AM EDT on Friday is expected to increase to 44.0 from 40.4 in May.
June Michigan Consumer Sentiment released at 10:00 AM EDT on Friday is expected to increase to 63.9 from 59.2 in May.
Selected Earnings News This Week
Source: www.Investing.com
Trader’s Corner
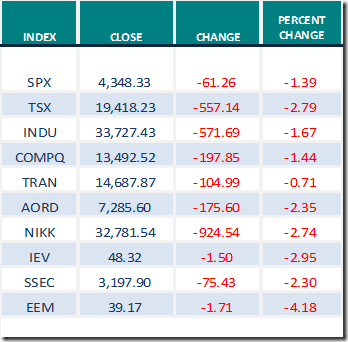
Equity Indices and Related ETFs
Daily Seasonal/Technical Equity Trends for June 23rd 2023
Green: Increase from previous day
Red: Decrease from previous day
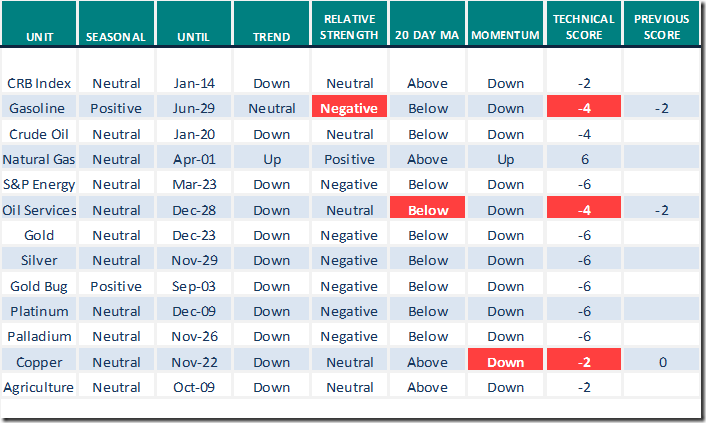
Commodities
Daily Seasonal/Technical Commodities Trends for June 23rd 2023
Green: Increase from previous day
Red: Decrease from previous day
Sectors
Daily Seasonal/Technical Sector Trends for June 23rd 2023
Green: Increase from previous day
Red: Decrease from previous day
Source for positive seasonal ratings: www.equityclock.com
Technical Scores
Calculated as follows:
Intermediate Uptrend based on at least 20 trading days: Score 2
(Higher highs and higher lows)
Intermediate Neutral trend: Score 0
(Not up or down)
Intermediate Downtrend: Score -2
(Lower highs and lower lows)
Outperformance relative to the S&P 500 Index: Score: 2
Neutral Performance relative to the S&P 500 Index: 0
Underperformance relative to the S&P 500 Index: Score –2
Above 20 day moving average: Score 1
At 20 day moving average: Score: 0
Below 20 day moving average: –1
Up trending momentum indicators (Daily Stochastics, RSI and MACD): 1
Mixed momentum indicators: 0
Down trending momentum indicators: –1
Technical scores range from -6 to +6. Technical buy signals based on the above guidelines start when a security advances to at least 0.0, but preferably 2.0 or higher. Technical sell/short signals start when a security descends to 0, but preferably -2.0 or lower.
Long positions require maintaining a technical score of -2.0 or higher. Conversely, a short position requires maintaining a technical score of +2.0 or lower
Changes Last Week
Technical Notes for Friday
S&P/TSX 60 Index moved below 1,174.38 extending an intermediate downtrend. The Index at 1,170 closed virtually unchanged from its December 31st 2022 close at 1,169.
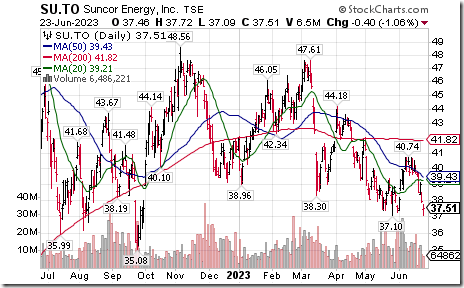
Suncor $SU.TO a TSX 60 stock moved below $37.10 extending an intermediate downtrend.
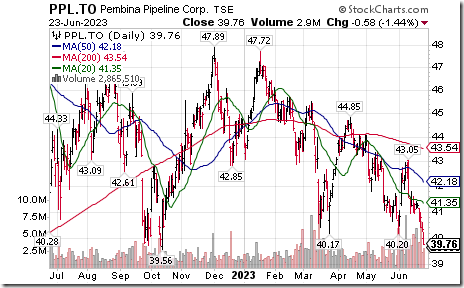
Pembina Pipeline $PPL.TO a TSX 60 stock moved below $40.20 and $40.17 extending an intermediate downtrend.
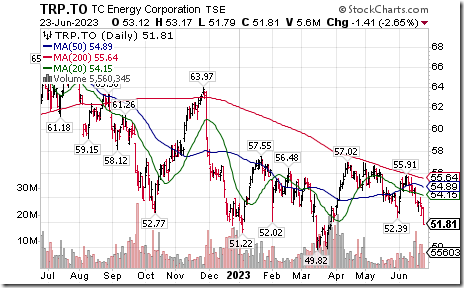
TC Energy $TRP.TO a TSX 60 stock moved below $52.39 extending an intermediate downtrend.
Thomson Reuters $TRI.TO a TSX 60 stock moved above Cdn$173.75 to an all-time high extending an intermediate uptrend.
Take Two $TTWO a NASDAQ 100 stock moved above $141.96 extending an intermediate uptrend.
Links offered by valued providers
Rebellion in Russia could trigger selloff in U.S. stocks and flight to safe assets, analysts say. Here’s what investors should know.
Mike’s Money Talks for June 24th
Michael Campbell’s MoneyTalks – Complete Show (mikesmoneytalks.ca)
MARK LEIBOVIT – HOWE STREET RADIO PODCAST INTERVIEW THURSDAY AFTERNOON JUNE 22, 2023
Could Markets Fall Towards Fall? – HoweStreet
Where To Have Skin In The Game | Mish Schneider | Your Daily Five (06.23.23)
https://www.youtube.com/watch?v=Tk3Y1khaqUg
How High Can Stock Indexes Climb? | Bruce Fraser | Power Charting (06.23.23)
https://www.youtube.com/watch?v=WEWcrwbj5Rs
Rafi Farber: Unprecedented Movement in Comex Silver Vaults This Week
https://www.youtube.com/watch?v=lDNKZye1JrA
Downside Targets For S&P 500 Pullback JUNE 23, 2023 AT 08:15 PM David Keller
Downside Targets For S&P 500 Pullback | The Mindful Investor | StockCharts.com
Are The Markets Just Pulling Back, or Is It More?JUNE 23, 2023 AT 09:00 PM
Mary Ellen McGonagle
Are The Markets Just Pulling Back, or Is It More? | The MEM Edge | StockCharts.com
The Best Since 2000! JUNE 23, 2023 AT 07:31 PM Greg Schnell
The Best Since 2000! | The Canadian Technician | StockCharts.com
Gold Chart Looks a Lot Different In Other Currencies JUNE 22, 2023 Tom McClellan
Gold Chart Looks a Lot Different In Other Currencies | Top Advisors Corner | StockCharts.com
June 22, 2023 | Could We See Higher Oil Prices Later This Year? Josef Schachter
Could We See Higher Oil Prices Later This Year? – HoweStreet
June 23, 2023 | Market “Fear Factor” At 3 Year Low. Bob Hoye
Market “Fear Factor” At 3 Year Low – HoweStreet
AlI Winners & Losers by Mark Bunting and www.uncommonsenseinvestor.com June 14, 2023
https://uncommonsenseinvestor.com/ai-winners-losers/
Technical Scoop by David Chapman and www.enrichedinvesting.com
S&P 500 Momentum Barometers
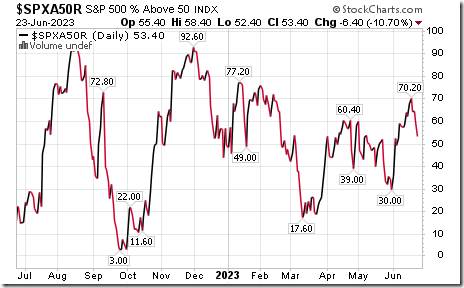
The intermediate term Barometer dropped 6.40 on Friday and 16.80 last week to 53.40. It changed from Overbought to Neutral on a move below 60.00. Daily trend is down.
The long term Barometer dropped 3.80 on Friday and 10.00 last week to 55.60. It changed from Overbought to Neutral on a move below 60.00. Daily trend is down.
TSX Momentum Barometers
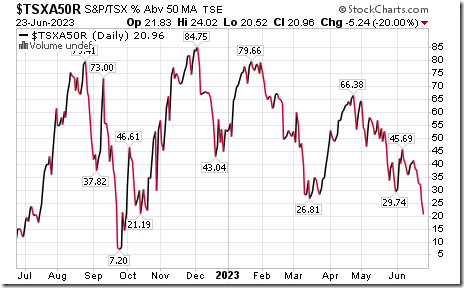
The intermediate term Barometer dropped 5.24 on Friday and 16.97 last week to 20.96. It remains Oversold. Daily trend is down.
The long term Barometer dropped 2.62 on Friday and 11.55 last week to 40.61. It remains Neutral. Daily trend is down.
Disclaimer: Seasonality ratings and technical ratings offered in this report and at
www.equityclock.com are for information only. They should not be considered as advice to purchase or to sell mentioned securities. Data offered in this report is believed to be accurate, but is not guaranteed


