by Denise Chisholm, Director of Quantitative Market Strategy, Fidelity Management & Research Company; Fidelity Viewpoints
Here's what looks appealing for the rest of 2023.
Key takeaways
- Investor pessimism about stocks could, surprisingly, set stocks up for a strong second half of the year.
- Declining inflation and reasonable valuations also support a potentially positive outlook for the stock market in general.
- Tech stocks could outperform as they bounce back from last year's depressed earnings.
- A combination of low relative valuations and improving earnings estimates could launch the consumer discretionary sector ahead.
As we near the end of the first half of the year, investors may be wondering whether the market can really keep up the modest winning streak it's been on so far in 2023.
The 8.7% total return for the S&P 500® year to date through late May has likely been welcome for investors' portfolios. But past performance is never a guarantee of future results, and those benign gains may feel at odds with the sense of economic dread that's permeated negative news headlines this year.
Yet I think there are reasons to be cautiously optimistic toward stocks in general—and certain sectors in particular—over the rest of the year.
My research focuses on analyzing market history to uncover patterns and probabilities that can help inform the current outlook. At present, I believe that several factors are contributing to a positive potential outlook for the stock market. And I think that earnings trends among both technology and consumer discretionary companies could set those sectors up for potential outperformance over the remainder of the year.
Here's why I think these could be areas to watch for the second half of the year.
1. Stocks: Supported by falling inflation, sentiment, and reasonable valuations
I see 3 factors combining to create a positive backdrop for stocks: a declining inflation rate, negative investor sentiment, and reasonable stock valuations.
Consider inflation. While high inflation is often considered a headwind, my research suggests the declining inflation rate may give the market a boost.
The inflation rate has declined by any measure, with year-over-year changes in the core Consumer Price Index (CPI)—which strips out volatile food and energy prices—falling from 6.6% as of September to 5.5% as of April. But I think those figures actually understate how fast inflation has slowed. Shelter—spending on housing, whether owned or rented—makes up a large portion of core inflation measures. Removing the impact of shelter costs, core inflation rose at an annualized rate of just 2.2% during the 6 months through April, just above the Federal Reserve's 2% annual target.
Why exclude shelter? Changes in shelter costs take a long time to show up in the official numbers, due to the way gauges like the CPI are constructed. Real-time measures suggest that housing costs have already softened considerably, implying that the official figures could arguably be overstating inflation.
Inflation declines like the recent one have historically corresponded with strong subsequent market returns. In the past, when the annual rate of core inflation, excluding shelter, started in the highest 25% of its range and fell to less than 4% (as it recently has), the stock market posted average gains in the high teens over the next 6 months.
The second factor I see potentially supporting stocks is, counterintuitively, negative investor sentiment. While you might assume that positive stock returns would reflect investor optimism, by several measures investor sentiment was dismal during the first half of the year.
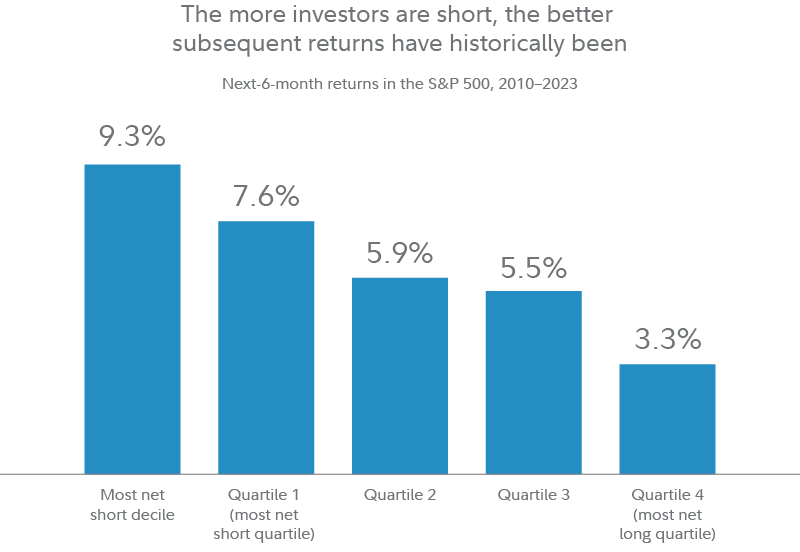
Take short sales. Short sales are essentially bets that stocks will decline, and more short-selling activity generally indicates greater investor pessimism. As of mid-May, the ratio of short sales in the S&P (not including business hedging activity) to ordinary long investments in the S&P was in the most bearish 25% of its range since 2010.
Like many sentiment measures, short sales tend to be a contrarian indicator: Historically, the more pessimism we see in shorting activity, the better the market's returns have been over the next 6 months.
 Past performance is no guarantee of future results. Net short and net long positioning is based on positioning in the S&P 500 by large speculators in options and futures contracts, as reported by the Commodity Futures Trading Commission in the Commitments of Traders report. Data gathered weekly. Source: Haver Analytics, FactSet, Fidelity Investments, as of 5/10/2023.
Finally, I think that stock valuations still look broadly reasonable, which could further support the market. The S&P's price-to-earnings ratio (P/E) recently sat at about 20 based on the last 12 months' earnings, and 18 based on estimated earnings for the next 12 months. Those figures are solidly in the middle of the index's historical range. I also compared stock valuations to bond valuations, by looking at how bond yields compare against average stock earnings yields (annual earnings divided by price). By this measure, stocks remain cheap relative to bonds based on history.
I think this combination of reasonable valuations, low investor expectations, and declining inflation may set the stock market up for a strong second half.
2. Technology: Bouncing back from depressed earnings
Last year was tough for tech stocks: Earnings in the sector plummeted, pushing up the average tech stock's P/E ratio.
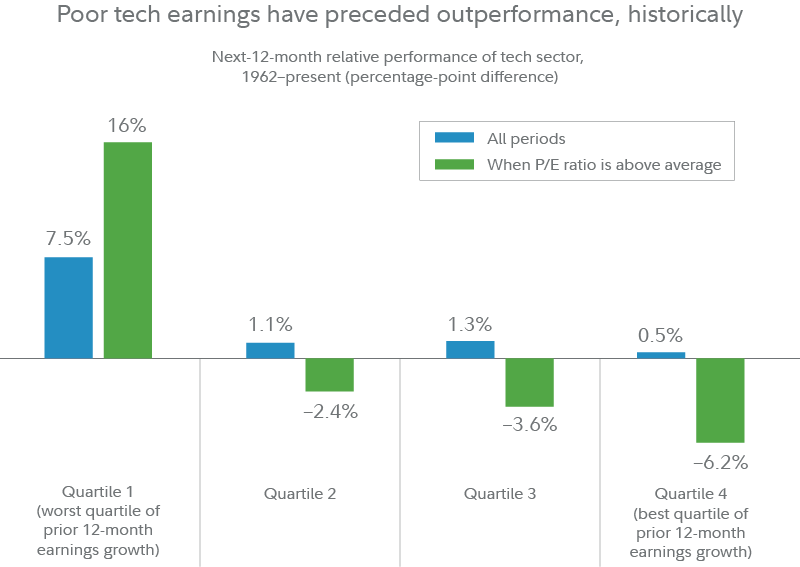
While falling earnings and rising P/Es may sound like a recipe for disaster, historically it's actually been a buying signal. I looked at past periods when the tech sector's 12-month earnings growth fell into the bottom quartile of its historical range. Historically, the sector has then gone on to outperform the broad market over the following 12 months, on average. And when the sector's P/E ratio was above its historical average, it beat the market by an average of 16 percentage points over the following year. While rough patches may have made tech stocks look expensive, they also might have paved the way for positive surprises as earnings rebounded.
 Past performance is no guarantee of future results. Analysis based on Fidelity top 3,000 stocks by market capitalization. Sector breakdown defined by Fidelity Investments. Technology sector defined as companies in technology software and services and technology hardware and equipment. Data gathered monthly. Source: Haver Analytics, FactSet, Fidelity Investments, as of 2/28/2023. P/E ratio is considered to be "above average" when forward price-to-earnings ratios were in the top half of the sector's historical range. A forward P/E ratio typically uses an average of analysts' published earnings estimates for the next 12 months.
When earnings are depressed, it can help to consider valuation measures that look beyond earnings, like price-to-book ratios (P/Bs). On that measure, semiconductor stocks look particularly attractive, with an average P/B that's in the bottom 25% of the industry's historical range. From comparable levels in the past, semiconductor stocks have outperformed the market over the next 12 months, on average, even when the companies' earnings declined.
3. Consumer discretionary: Riding upward earnings revisions
My final area to watch for the second half of the year is the consumer discretionary sector. This segment includes companies that sell nonessential goods and services to consumers, like clothing retailers, luxury brands, and travel-related companies.
One reason why I'm cautiously bullish on this sector is simply valuation. The consumer discretionary sector's average valuation is near the bottom of its historical range—when comparing the sector's average forward P/E ratio (i.e., based on estimated future earnings) to that of the market.
Earnings in the consumer discretionary sector have suffered, much as they have in technology. But similar to tech, weak earnings patches have historically been followed by strong returns—likely because they lowered investors' expectations, making them easier to beat.
Another potentially good sign? Analysts have been revising earnings estimates upward more than downward for companies in the sector. In the past, this trend has often preceded periods of strong relative returns. In historical periods when the sector's net earnings revisions (meaning positive revisions minus negative revisions) improved from the worst 25% of its historical range, the sector outperformed the market over the next 12 months more than two-thirds of the time.
Look beyond the near-term worries
As we enter the second half of 2023, I suggest investors bear in mind that the stock market always looks ahead.
Poor recent results and pessimistic sentiment can actually be tailwinds if they make it easier for stocks to beat expectations.
Copyright © Fidelity.com


