The Bottom Line
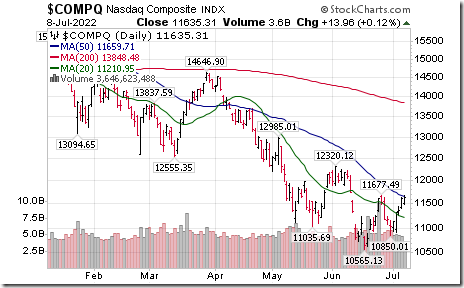
Recovery in North American equity indices continues, led by the NASDAQ Composite Index. The Index set an intermediate uptrend on Friday on an inter-day move above 11,677.49. Completion of a double bottom by ARKK on Friday shows that the “risk on” trade is back.
Earnings and Revenue Outlook for S&P 500 companies
Consensus earnings estimates for S&P 500 companies on a year-over-year basis in the second quarter of 2022 were increased slightly last week. According to www.FactSet.com second quarter earnings on a year-over-year basis increased 4.3% (versus 4.1% last week) and revenues increased 10.1%.
Consensus earnings and revenue estimates for S&P 500 companies beyond the second quarter on a year-over-year basis slipped slightly again last week. According to www.FactSet.com earnings in the third quarter are expected to increase 10.2% (versus 10.5% last week) and revenues are expected to increase 9.5% (versus 9.7% last week). Earnings in the fourth quarter are expected to increase 9.4% (versus 9.7% last week) and revenues are expected to increase 7.3%. Earnings on a year-over-year basis for all of 2022 are expected to increase 10.0% (versus 10.2% last week) and revenues are expected to increase 10.7%.
Economic News This Week
U.S. June Consumer Price Index released at 8:30 AM EDT on Wednesday is expected to increase 1.0% versus a gain of 1.0% in May. On a year-over-year basis, June CPI is expected to increase 8.7% versus a gain of 8.6% in May. Excluding food and energy, June CPI is expected to increase 0.6% versus a gain of 0.6% in May. On a year-over-year basis, June CPI is expected to increase 5.7% versus a gain of 5.0% in May.
Bank of Canada updates monetary policy at 10:00 AM EDT on Wednesday. Lending rate to Canada’s largest banks is expected to increase from 1.50% to 2.25%. Press conference is offered at 11:00 AM EDT.
June Producer Price Index released at 8:30 AM EDT on Thursday is expected to increase 0.8% versus a gain of 0.8% in May. On a year-over-year basis, June PPI is expected to increase 10.8% versus a gain of 10.8% in May. Excluding food and energy, June PPI is expected to increase 0.5% versus a gain of 0.5% in May. On a year-over-year basis, June PPI is expected to increase 8.6% versus a gain of 8.3% in May.
June U.S. Retail Sales released at 8:30 AM EDT on Friday are expected to increase 0.8% versus a drop of 0.3% in May. Excluding auto sales, June U.S. Retail Sales are expected to increase 0.6% versus a gain of 0.5% in May.
July Empire State Manufacturing Survey released at 8:30 AM EDT on Friday is expected to slip 1.25% versus a drop of 1.20 in June.
June Industrial Production released at 9:15 AM EDT on Friday is expected to increase 0.2% versus a gain of 0.1% in May. June Capacity Utilization is expected to slip to 79.2% from 80.8 in May.
May U.S. Business Inventories released at 10:00 AM EDT on Friday are expected to increase 1.2% versus a gain of 1.2% in April.
July Michigan Sentiment released at 10:00 AM EDT on Friday is expected to slip to 49.4 from 50.00 in June.
Earning News This Week
Seventeen S&P 500 companies and two Dow Jones Industrial Average companies (JP Morgan and UnitedHealth Group) are scheduled to release quarterly results this week. Focus is on the financial services sector.
Trader’s Corner
Equity Indices and Related ETFs
Daily Seasonal/Technical Equity Trends for July 8th 2022
 Green: Increase from previous day
Red: Decrease from previous day
Commodities
Daily Seasonal/Technical Commodities Trends for July 8th 2022
Green: Increase from previous day
Red: Decrease from previous day
Sectors
Daily Seasonal/Technical Sector Trends for July 8th 2021
Green: Increase from previous day
Red: Decrease from previous day
All seasonality ratings are based on performance relative to the S&P 500 Index (except TSX)
Links offered by valued providers
Greg Schnell says “Rally continues to form”
Rally Continues to Form | The Canadian Technician | StockCharts.com
Sprott Monthly Gold Report
Sprott Monthly Report: Gold Holds in Worst First Half in Decades
Mark Leibovit asks “Are we in a summer bear rally”?
Are We In a Summer Bear Rally? – HoweStreet
Michael Campbell’s Money Talks for July 9th
July 9th Episode (mikesmoneytalks.ca)
David Keller asks “What happens if FAANGs break out”?
What Happens if FAANGs Break Out? | The Mindful Investor | StockCharts.com
Greg Schnell says “Rally continues to form”.
Rally Continues to Form | The Canadian Technician | StockCharts.com
Tom Bowley says “Shhhhh! Don’t tell anyone, but here’s a Wall Street Secret”.
Mary Ellen McGonagle says “Growth stocks explode higher”.
Growth Stocks Explode Higher! | Mary Ellen McGonagle | The MEM Edge (07.08.22) – YouTube
Bob Hoye asks “When might gold stocks be a good buy”?
Why Oil Could Triple in Price? – HoweStreet
Victor Adair’s Trading Notes for July 9th
Trading Desk Notes for July 9, 2022 – The Trading Desk Notes by Victor Adair
Technical Scoop for July 11th from David Chapman and www.EnrichedInvesting.com
Links from Mark Bunting and www.uncommonsenseinvestor.com
Q3 Equity Strategy Outlook – Uncommon Sense Investor
12 Dividend Aristocrats You Can Buy at a Discount | Kiplinger
Oppenheimer Strategist Dials Back His S&P 500 Call, Wall Street’s Most Bullish (yahoo.com)
Technical Scores
Calculated as follows:
Intermediate Uptrend based on at least 20 trading days: Score 2
(Higher highs and higher lows)
Intermediate Neutral trend: Score 0
(Not up or down)
Intermediate Downtrend: Score -2
(Lower highs and lower lows)
Outperformance relative to the S&P 500 Index: Score: 2
Neutral Performance relative to the S&P 500 Index: 0
Underperformance relative to the S&P 500 Index: Score –2
Above 20 day moving average: Score 1
At 20 day moving average: Score: 0
Below 20 day moving average: –1
Up trending momentum indicators (Daily Stochastics, RSI and MACD): 1
Mixed momentum indicators: 0
Down trending momentum indicators: –1
Technical scores range from -6 to +6. Technical buy signals based on the above guidelines start when a security advances to at least 0.0, but preferably 2.0 or higher. Technical sell/short signals start when a security descends to 0, but preferably -2.0 or lower.
Long positions require maintaining a technical score of -2.0 or higher. Conversely, a short position requires maintaining a technical score of +2.0 or lower
Changes Last Week
Technical Notes for Friday
Healthcare Providers iShares $IHF moved above intermediate resistance at $269.02.
Regeneron $REGN a NASDAQ 100 stock moved above $613.15 setting an intermediate uptrend.
Palladium ETN $PALL moved above intermediate resistance at $192.99.
Ark Innovation $ARKK moved above $46.94 completing a double bottom pattern.
Alphabet $GOOGL a NASDAQ 100 stock moved above $2,386.94 completing a double bottom pattern.
Constellation Software $CSU.TO a TSX 60 stock moved above $1,984.40 completing an intermediate bottoming pattern.
S&P 500 Momentum Barometers
The intermediate term Barometer slipped 0.60 on Friday, but added 4.20 last week to 28.40. It remains Oversold. Trend is up.
The long term Barometer added 0.20 to 23.40 on Friday, but slipped 2.40 last week to 23.40. It remains Oversold.
TSX Momentum Barometers
The intermediate term Barometer added 0.42 on Friday and 11.40 last week to 23.95. It remains Oversold. Trend is up.
The long term Barometer eased 0.84 on Friday, but added 2.62 last week to 26.47. It remains Oversold. Trend is up.
Disclaimer: Seasonality and technical ratings offered in this report and at
www.equityclock.com are for information only. They should not be considered as advice to purchase or to sell mentioned securities. Data offered in this report is believed to be accurate, but is not guaranteed.


