The Bottom Line
North American equity markets are extremely Oversold. Technical signs of an intermediate low have yet to be confirmed, but a mild recovery by broadly based indices on Friday gives early evidence of a developing bottom.
Last week the “talking heads” on CNBC and Bloomberg attributed recent weakness by U.S. equity indices to lower expectation for quarterly revenues and earnings by major companies starting in the second quarter. However, data accumulated by www.Factset.com says otherwise. More gains were recorded last week
Observations
Consensus earnings estimates from www.Factset.com for S&P 500 companies on a year-over-year basis in the second quarter of 2022 surprisingly increased last week despite Wall Street talk of an economic slowdown in the U.S. in the second quarter. According to www.FactSet.com second quarter earnings on a year-over-year basis increased to 4.3% (versus 4.0% last week) and revenues increased 10.1% (up from 9.9% last week).
Consensus earnings and revenue estimates for S&P 500 companies beyond the second quarter on a year-over-year basis also increased slightly last week. According to www.FactSet.com earnings in the third quarter are expected to increase 10.7% (versus 10.6% last week) and revenues are expected to increase 9.7% (versus 9.4% last week). Earnings in the fourth quarter are expected to increase 10.1% and revenues are expected to increase 7.5% (versus 7.2% last week). Earnings on a year-over-year basis for all of 2022 are expected to increase 10.5% (versus 10.4% last week) and revenues are expected to increase 10.7% (versus 10.5% last week).
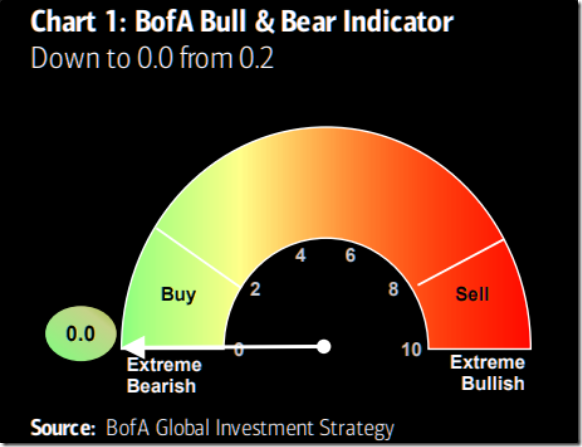
Investor sentiment is as low as it can go. Also, see intermediate term momentum Barometer at the end of this report.
North American equity markets responded significantly to the downside following release of a “hotter than expected” year-over-year inflation reports in the U.S: May CPI jumped 8.6% and May PPI advanced 10.9%. The FOMC may have been “spooked” by market responses to these reports prompting an increase in the Fed Fund Rate with forewarning by 0.75% last Wednesday instead of an anticipated 0.50% increase. However, primary indicator used by the FOMC to measure inflation is the PCE Price Index, not CPI and PPI. The PCE Price Index on a year-to-year basis peaked in March at 6.6% and slipped to 6.3% in April. Excluding food and energy, the Index peaked in March at 5.2% and slipped to 4.9% in April. All likely will increase slightly in May to near March levels. If the March reports prove to have recorded an intermediate peak, the stage is set for a significant upside move by North American equity indices. The May PCE Price report is released on June. 30th.
Economic News This Week
U.S. Holiday on Monday.
Canadian April Retail Sales to be released at 8:30 AM EDT on Tuesday are expected to increase 1.4% versus a gain of 0.2% in March. Excluding auto sales, April Retail Sales are expected to increase 2.0% versus a gain of 2.4% in March.
May U.S. Existing Home Sales to be released at 10:00 AM EDT on Tuesday are expected to slip to 5.41 million units from 5.61 million units in April.
Canadian May Consumer Price Index to be released at 8:30 AM EDT on Wednesday is expected to increase 0.5% versus a gain of 0.6% in April. On a year-over-year basis May CPI is expected to increase 6.7% versus a gain of 6.8% in April. Excluding food and energy, Canadian May Consumer Price Index is expected to increase 0.4% versus a gain of 0.7% in April. On a year-over-year basis, May CPI is expected to increase 5.4% versus a gain of 5.7% in April.
Federal Reserve Chairman Powell is expected to testify at 10:00 AM EDT on Wednesday and Thursday.
June Michigan Consumer Sentiment to be released at 10:00 AM EDT on Friday is expected to recover from 50.2 in May to 59.1.
May U.S. New Home Sales to be released at 10:00 AM EDT on Friday are expected to reach 605,000 units versus 591,000 units in April.
Selected Earnings News This Week
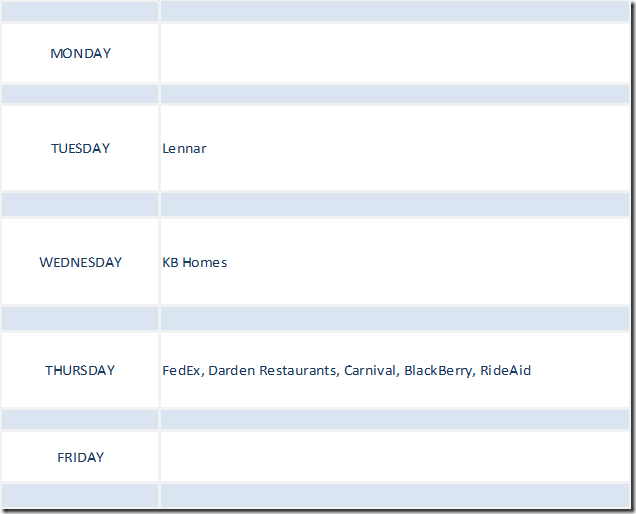
Seven S&P 500 companies and one TSX 60 companies are scheduled to report quarterly results this week.
Trader’s Corner
Equity Indices and Related ETFs
Daily Seasonal/Technical Equity Trends for June 17th 2022
Green: Increase from previous day
Red: Decrease from previous day
Commodities
Daily Seasonal/Technical Commodities Trends for June 17th 2022
Green: Increase from previous day
Red: Decrease from previous day
Sectors
Daily Seasonal/Technical Sector Trends for June 17th 2021
 Green: Increase from previous day
Red: Decrease from previous day
All seasonality ratings are based on performance relative to the S&P 500 Index (except TSX)
Technical Scores
Calculated as follows:
Intermediate Uptrend based on at least 20 trading days: Score 2
(Higher highs and higher lows)
Intermediate Neutral trend: Score 0
(Not up or down)
Intermediate Downtrend: Score -2
(Lower highs and lower lows)
Outperformance relative to the S&P 500 Index: Score: 2
Neutral Performance relative to the S&P 500 Index: 0
Underperformance relative to the S&P 500 Index: Score –2
Above 20 day moving average: Score 1
At 20 day moving average: Score: 0
Below 20 day moving average: –1
Up trending momentum indicators (Daily Stochastics, RSI and MACD): 1
Mixed momentum indicators: 0
Down trending momentum indicators: –1
Technical scores range from -6 to +6. Technical buy signals based on the above guidelines start when a security advances to at least 0.0, but preferably 2.0 or higher. Technical sell/short signals start when a security descends to 0, but preferably -2.0 or lower.
Long positions require maintaining a technical score of -2.0 or higher. Conversely, a short position requires maintaining a technical score of +2.0 or lower
Changes Last Week
Links offered by Valued Providers
Gold and gold equity outlook from Sprott
John Hathaway & Ted Oakley: Gold Outlook, Inflation & Bullion vs. Miners (sprott.com)
Seeking Alpha comment on the Biotech sector
Biotech posts biggest intraday gain since 2020 as deal making heats up (NASDAQ:IBB) | Seeking Alpha
Michael Campbell’s Money Talks for June 18th
June 18th Episode (mikesmoneytalks.ca)
David Keller asks “Looking for a bottom? Watch RSI”.
Looking For a Bottom? Watch RSI. | The Mindful Investor | StockCharts.com
Jane Gallina says “It’s time for gold to shine”.
It’s Time For Gold To Shine | Jane Gallina | Your Daily Five (06.17.22) – YouTube
Links from Mark Bunting and www.uncommonsenseinvestor.com
These Two Stocks May Be the Best Inflation Hedges Out There – Uncommon Sense Investor
The Cheapest Stocks in Canada Right Now | Morningstar
Stock Market Outlook: More Misery Ahead Amid S&P 500 Bear Market (businessinsider.com)
The Essential Hedgeye Summer Reading List
Mark Leibovit comment for June 18th
This Week in Money – HoweStreet
Victor Adair’s Trading Notes for June 18th
Trading Desk Notes for June 18, 2022 – The Trading Desk Notes by Victor Adair
Excellent Time to Take Advantage of Carnage: Gabelli’s Ward
https://www.youtube.com/watch?v=TX7CF05TkPo
Technical Scoop from David Chapman and www.EnrichedInvesting.com for June 20th
Technical Notes for Friday
Taiwan iShares EWT moved below $52.19 extending an intermediate downtrend.
Oil Services ETF $OIH moved below $242.19 extending an intermediate downtrend.
Copper Miners ETF $COPX moved below $33.93 extending an intermediate downtrend.
Base Metals ETF $PICK moved below $38.19 extending an intermediate downtrend.
S&P 500 stocks breaking intermediate support on Friday.
Visa $V a Dow Jones Industrial stock moved below $186.31 extending a downtrend.
Raytheon Technologies $RTX an S&P 100 stock moved below $88.43 extending a downtrend.
Match $MTCH a NASDAQ 100 stock moved below $62.87 extending a downtrend
Chevron $CVX a Dow Jones Industrial stock moved below support at $150.12.
General Dynamics $GDX) an S&P 100 stock moved below $210.19 extending a downtrend.
KLA Tencor $KLAC a NASDAQ 100 stock moved below $305.41 extending a downtrend.
Brookfield Infrastructure $BIP a TSX 60 stock moved below US$37.96 extending an intermediate downtrend.
Manulife Financial $MFC.TO a TSX 60 stock moved below $21.43 extending a downtrend.
S&P 500 Momentum Barometers
The intermediate term Barometer was unchanged on Friday and down 10.22 last week to 2.00. It is extremely Oversold. Trend is down. Short term technical signs of a bottom have yet to appear.
The long term Barometer eased 0.20 to 17.80 on Friday and 12.85 last week to 12.80. It
Also is deeply Oversold. Trend is down. Short term technical signs of a bottom have yet to appear.
TSX Momentum Barometers
The intermediate term Barometer dropped 2.93 on Friday and fell 22.81 last week to 6.28. It remains Oversold. Trend is down. Technical signs of a short term bottom have yet to appear.
The long term Barometer slipped 2.09 on Friday and 14.30 last week to 22.43. It remains Oversold. Trend is down. Technical signs of a short term bottom have yet to appear.
Disclaimer: Seasonality and technical ratings offered in this report and at
www.equityclock.com are for information only. They should not be considered as advice to purchase or to sell mentioned securities. Data offered in this report is believed to be accurate, but is not guaranteed.


