by Don Vialoux, EquityClock.com
The Bottom Line
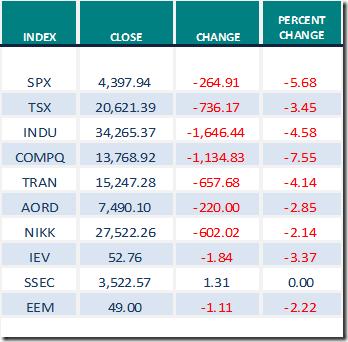
Taper or not to tapper, that is the question! Equity markets around the world began to focus on the Federal Reserve decision on interest rates to be released on Wednesday at 2:00 PM. Inflation gains in the U.S. are pressuring the FOMC to change their monetary policy sooner than planned. The FOMC currently is scheduled to taper monetary stimulus into the U.S. economy from $90 billion in January to $60 billion in February and a finally to $30 billion in March. Thereafter, hikes in the Fed Fund Rate are possible if inflation pressures remain at an elevated level beyond 2.0%. Traders are guessing that the FOMC meeting this Wednesday will truncate the process implying a first rate hike from its official rate at 0.00%-0.25% by March. Equity and interest rate markets responded accordingly last week
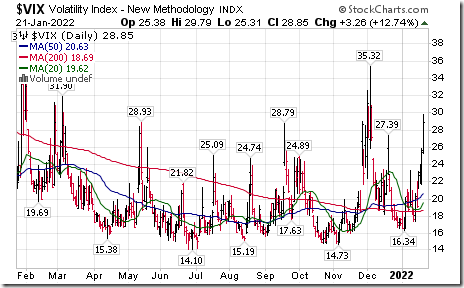
The VIX Index responded accordingly
The Bank of Canada also is under pressure to increase its overnight lending rate to Canada’s major banks. Bay Street economists have discussed the possibility of a 0.25% increase in Canada’s Bank Rate on Wednesday morning. Chances are high that the Bank of Canada will wait for the Federal Reserve decision before changing the rate.
Observations
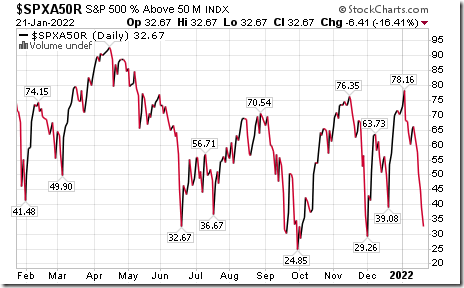
Intermediate term technical indicator for U.S. equity markets (Percent of S&P 500 stocks trading above their 50 day moving average) changed from Neutral to Oversold last week. Trend remained down and has yet to show signs of bottoming. See Momentum Barometer chart at the end of this report.
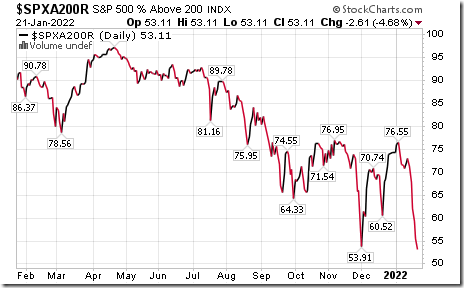
Long term technical indicator for U.S. equity markets (Percent of S&P 500 stocks trading above their 200 day moving average) changed from Overbought to Neutral last week. Trend remains down. See Momentum Barometer chart at the end of this report.
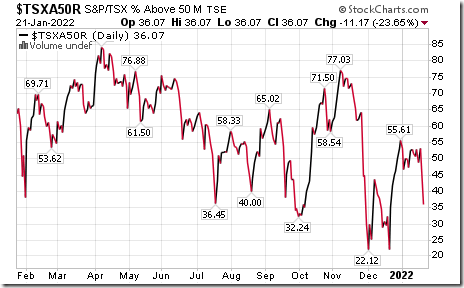
Intermediate term technical indicator for Canadian equity markets changed from Neutral to Oversold last week. . Trend remains down. See Momentum Barometer chart at the end of this report.
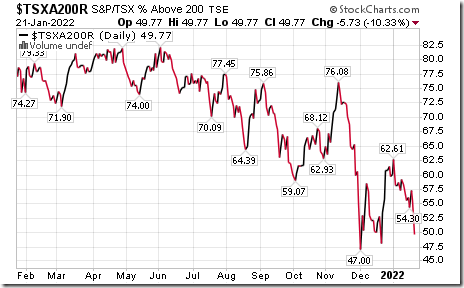
Long term technical indicator for Canadian equity markets (Percent of TSX stocks trading above their 200 day moving average) remained Neutral last week. Trend is down. See Momentum Barometer chart at the end of this report.
Changes last week to consensus earnings and revenue estimates for S&P 500 companies for the fourth quarter of 2021 and 2022 were unavailable at the time of writing. Approximately 8 percent of S&P 500 companies have reported to date. Most reporting companies have exceeded consensus estimates. However, responses to date generally have been negative. Weakness was notable among technology stocks with the NASDAQ 100 Index dropping 7.52% last week. Netflix was a big contributor with a drop of 24.4%.
Economic News This Week
U.S. December New Home Sales to be released at 10:00 AM EST on Wednesday is expected to increase to 770,000 from 744,000 in November.
Bank of Canada Monetary Policy Statement to be released at 10:00 AM EST on Wednesday is expected to maintain its overnight lending rate to major banks at 0.25%.
FOMC Interest Rate Decision to be released at 2:00 PM EST on Wednesday is expected to maintain a $30 billion per month tapering program. Press conference is held at 2:30 PM EST.
December Durable Goods Orders to be released at 8:30 AM EST on Thursday are expected to slip 0.2% versus a gain of 2.6% in November. December Durable Goods Orders ex aircraft orders are expected to increase 0.5% versus a gain of 0.9% in November.
U.S. fourth quarter real annualized GDP to be released at 8:30 AM EST on Thursday is expected to increase to 5.8% from 2.3% in the third quarter.
December Personal Income to be released at 8:30 AM EST on Friday is expected to increase 0.4% versus a gain of 0.4% in November. December Personal Spending is expected to increase 0.1% versus a gain of 0.6% in November
January Michigan Sentiment to be released at 10:00 AM EST on Friday is expected to remain unchanged from December at 68.8
Selected Earnings News This Week
Trader’s Corner
Equity Indices and Related ETFs
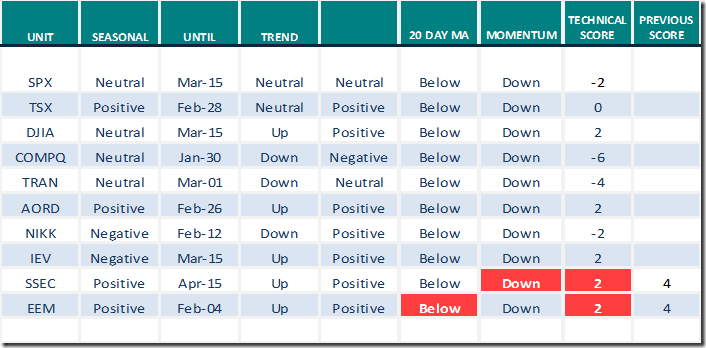
Daily Seasonal/Technical Equity Trends for Jan.21st 2022
Green: Increase from previous day
Red: Decrease from previous day
Commodities
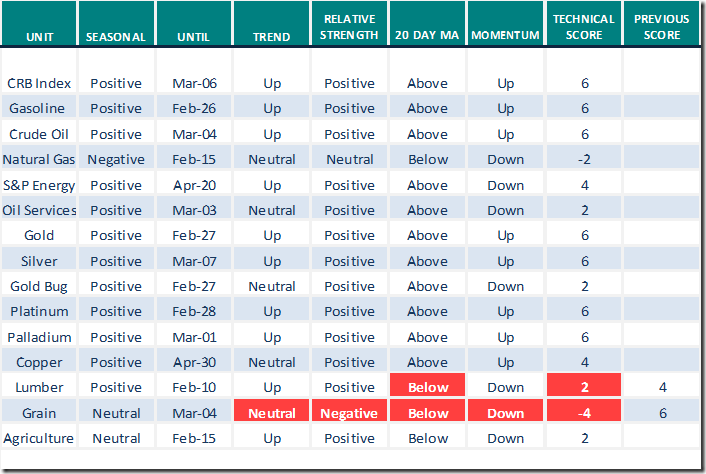
Daily Seasonal/Technical Commodities Trends for Jan.21st 022
Green: Increase from previous day
Red: Decrease from previous day
Sectors
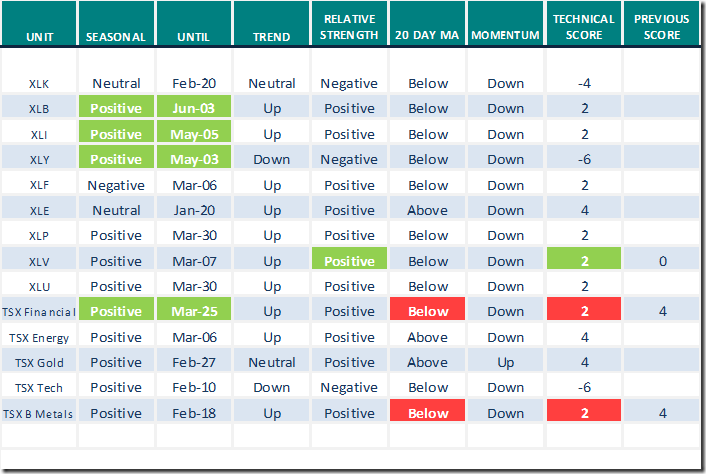
Daily Seasonal/Technical Sector Trends for Jan.21st 2021
Green: Increase from previous day
Red: Decrease from previous day
All seasonality ratings are based on performance relative to the S&P 500 Index (except TSX)
Links from valued providers
Michael Campbell’s Money Talks for January 22nd
January 22nd Episode (mikesmoneytalks.ca)
Mark Bunting and www.uncommoninvestor.com notes
How to Deal with the Wolves at the Door – Uncommon Sense Investor
Greg Schnell notes “The real problem arrives”
The Real Problem Arrives | ChartWatchers | StockCharts.com
Erin Swenlin discusses evidence for a Bear Market
Evidence for a Bear Market | ChartWatchers | StockCharts.com
Mark Leibovit says “Historically, this is an uncertain time for equity markets”.
https://www.howestreet.com/2022/01/historically-this-is-an-uncertain-time-for-markets-mark-leibovit/
Technical Scoop from David Chapman and www.EnrichedInvesting.com
Technical Scores
Calculated as follows:
Intermediate Uptrend based on at least 20 trading days: Score 2
(Higher highs and higher lows)
Intermediate Neutral trend: Score 0
(Not up or down)
Intermediate Downtrend: Score -2
(Lower highs and lower lows)
Outperformance relative to the S&P 500 Index: Score: 2
Neutral Performance relative to the S&P 500 Index: 0
Underperformance relative to the S&P 500 Index: Score –2
Above 20 day moving average: Score 1
At 20 day moving average: Score: 0
Below 20 day moving average: –1
Up trending momentum indicators (Daily Stochastics, RSI and MACD): 1
Mixed momentum indicators: 0
Down trending momentum indicators: –1
Technical scores range from -6 to +6. Technical buy signals based on the above guidelines start when a security advances to at least 0.0, but preferably 2.0 or higher. Technical sell/short signals start when a security descends to 0, but preferably -2.0 or lower.
Long positions require maintaining a technical score of -2.0 or higher. Conversely, a short position requires maintaining a technical score of +2.0 or lower
Changes Last Week
Technical Notes released yesterday at
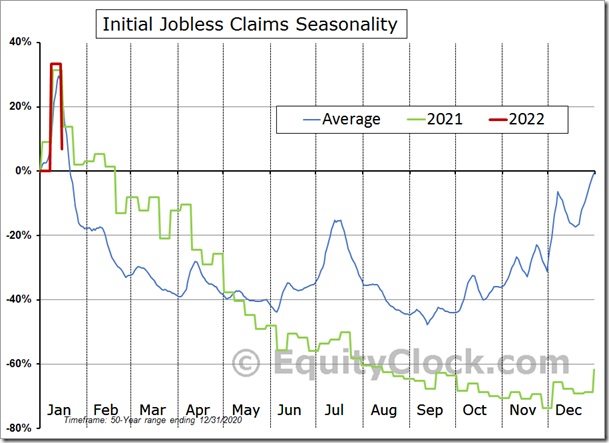
Concerns pertaining to the labor market and the manufacturing economy have been alleviated, for now, based on reports released on Thursday. equityclock.com/2022/01/20/… $STUDY $MACRO #Economy #Employment #JoblessClaims
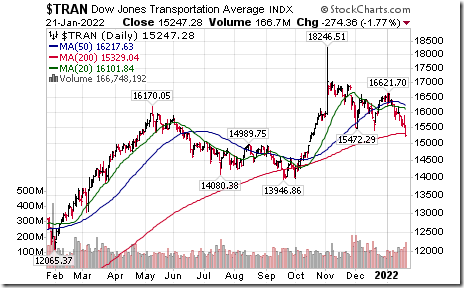
Dow Jones Transportation Average $DJT moved below 15,472.29 and 15,423.42 setting extending an intermediate downtrend.
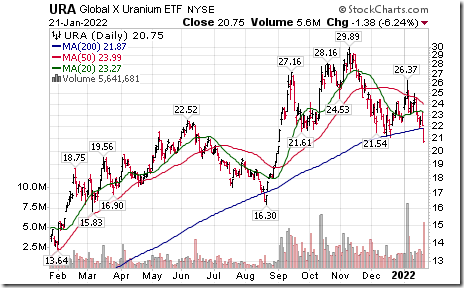
Uranium ETF $URA moved below $21.54 completing a Head & Shoulders pattern.
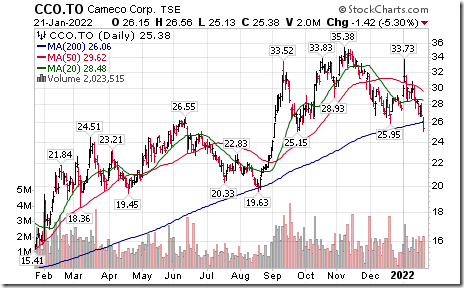
Cameco $CCO.CA a TSX 60 stock moved below Cdn$25.95 completing a Head & Shoulders pattern.
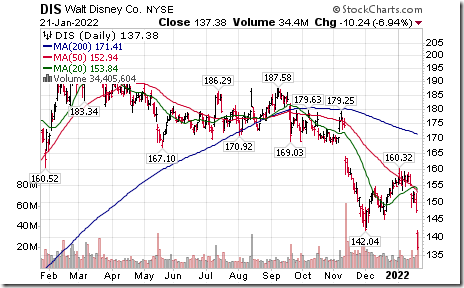
Walt Disney $DIS a Dow Jones Industrial Average stock moved below $142.04 extending an intermediate downtrend
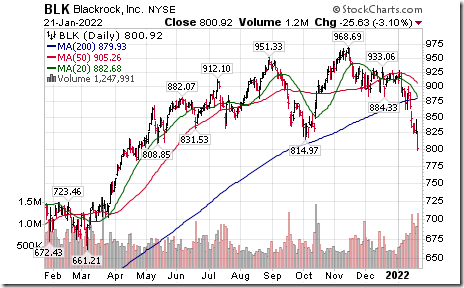
Blackrock $BLK an S&P 100 stock moved below $814.97 extending an intermediate downtrend.
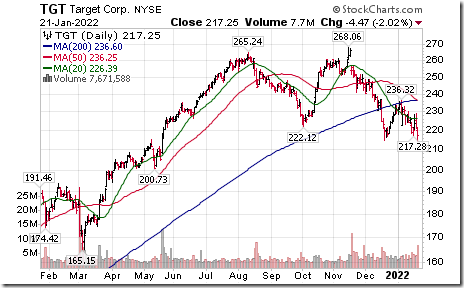
Target $TGT an S&P 100 stock moved below $214.60 extending an intermediate downtrend.
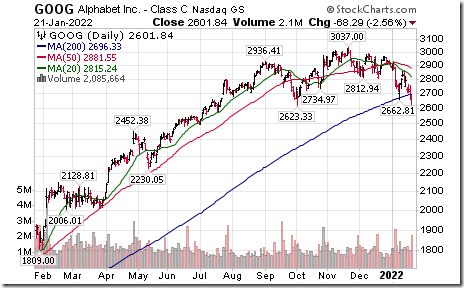
More weakness by big cap technology stocks! Alphabet $GOOG a NASDAQ 100 stock moved below $2,623.33 extending an intermediate downtrend.
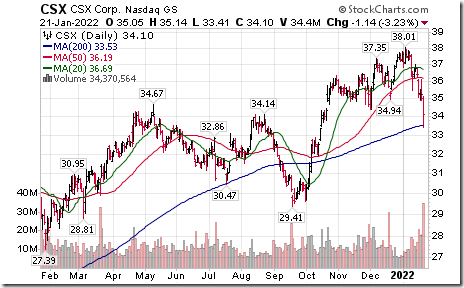
CSX Corp $CSX a NASDAQ 100 stock moved below $34.94 and $34.42 setting an intermediate downtrend.
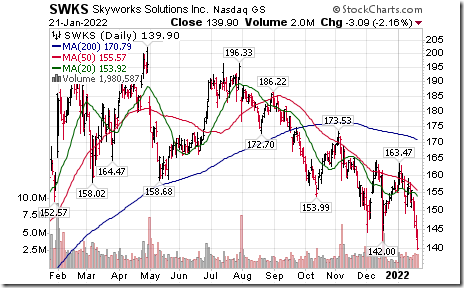
Skyworks $SWKS a NASDAQ 100 stock moved below $142.00 extending an intermediate downtrend.
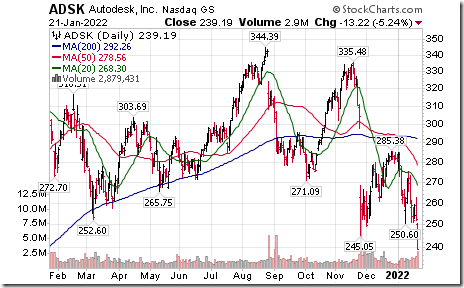
Autodesk $ADSK a NASDAQ 100 stock moved below $245.05 extending an intermediate downtrend
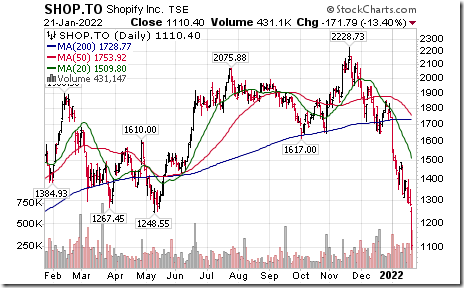
Shopify $SHOP.CA a TSX 60 stock moved below $1,248.55 extending an intermediate downtrend.
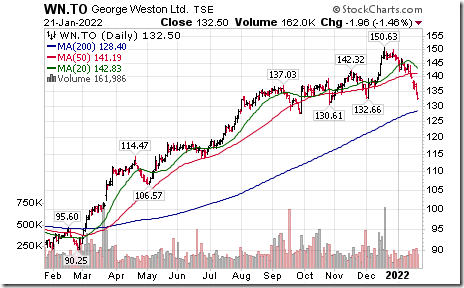
George Weston $WN.CA a TSX 60 stock moved below intermediate support at $132.66
S&P 500 Momentum Barometers
The intermediate term Barometer dropped 6.41 on Friday and 24.84 last week to 32.67. It changed from Neutral to Oversold on a move below 40.00, but has yet to show signs of bottoming.
The long term Barometer dropped 2.61 on Friday and 14.63 last week to 53.11. It changed from Overbought to Neutral on a move below 60.00. It has yet to show signs of bottoming.
TSX Momentum Barometers
The intermediate term Barometer dropped 11.17 on Friday and 14.61 last week to 36.07. It changed from Neutral to Oversold on a move below 40.00. Trend is down.
The long term Barometer dropped 5.73 on Friday and 5.89 last week to 49.77. It remains Neutral. Trend remains down.
Disclaimer: Seasonality and technical ratings offered in this report and at
www.equityclock.com are for information only. They should not be considered as advice to purchase or to sell mentioned securities. Data offered in this report is believed to be accurate, but is not guaranteed
This post was originally publised at Vialoux's Tech Talk.


