by Abhishek Ashok, M.A., MFE, CFA®, AGF Management Ltd.
Defensive segments of the equity market could benefit from a potential slowdown in economic activity next year, but, in this environment, investors shouldn’t entirely dismiss “riskier” high-beta stocks that move up and down more aggressively than the overall market. While equities that exhibit this factor may generally underperform in the first few months of a cyclical downshift in the economy, many of them exhibit characteristics that could limit losses or position them for possible outperformance following the initial reaction of investors.
At the heart of this analysis is the global Purchasing Managers Index (PMI) cycle and whether the key manufacturing gauge is on the cusp of a rotation from expansion to decline. In the United States, for instance, the PMI has been well above the expansionary score of 50 for more than a year, but has also declined from a recent high near 65 in March to 61 in November and could fall further in the months ahead. This is especially true if Omicron, the latest COVID-19 variant of concern, leads to more stringent restrictions in the coming weeks, but may occur regardless because of how long the current expansionary phase has lasted to date.
More importantly, if PMIs do continue rolling over, investors can anticipate the following to happen based on recent history of similar rotations from manufacturing peaks to troughs:
- The first three months almost always coincides with a defensive “knee jerk” reaction whereby low-beta (and low-volatility) equities outperform. So-called quality stocks have also in the past done well during this initial timeframe, while value – and deep value names, in particular – have lagged.
- At some point between three to six months after PMIs peak, the defensive tenor of the market has tended to fade with low-beta stocks underperforming the overall market by around 6% to 7%. The shift away from deep value stocks also typically accelerates to the benefit of growth and quality stocks.
Of course, none of that means high-beta stocks necessarily win out over time in a scenario of weakening PMI scores. Yet, when considered through a multi-factor lens, our research shows they may hold their own and could perform better than expected in some instances. In fact, if history repeats, not only could high-beta stocks benefit from another lag in low-beta stock performance three to six months past the PMI peak, many of them could also gain from their strengthening association with both growth and quality attributes that have also performed well in the conditions described above.
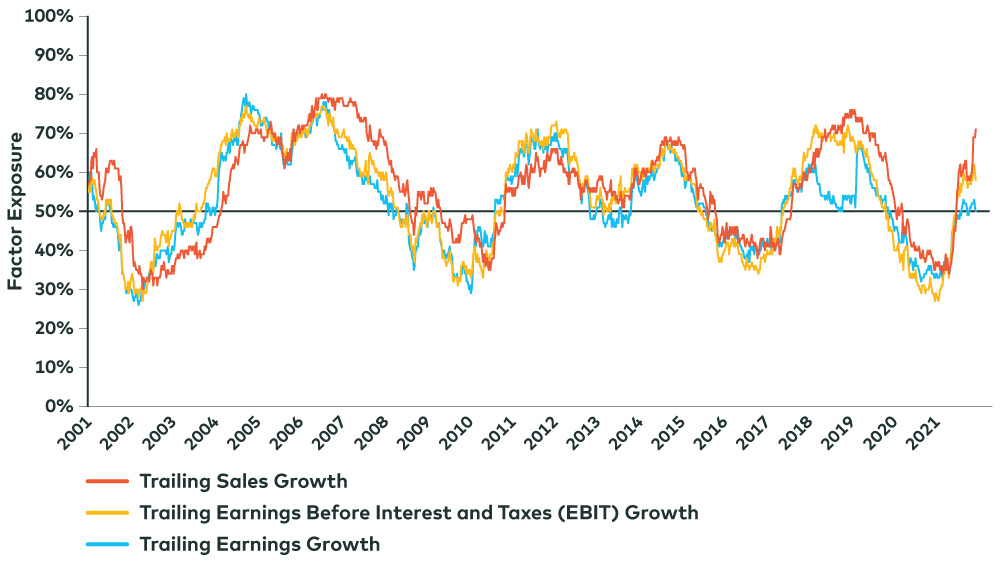
Over the past year alone, for example, high-beta stocks listed on the S&P 500 Index have seen substantial improvement in metrics such as trailing sales growth, trailing operating income and trailing earnings growth. The same is true on a forward-looking basis, all of which has resulted in high-beta stocks now having healthier growth profiles as a group than the average U.S. stock.
The “Growth” Profile of High-Beta Stocks

Source: AGFiQ with data from FactSet as of November 30, 2021. Relative factor exposure of the top quintile of stocks within the largest 550 securities in the U.S. by market capitalization sorted by trailing one-year beta scores. Each stock is ranked relative to the universe of securities and has a corresponding factor exposure based on the factor characteristic. 50% exposure corresponds to the median security based on the factor characteristic.
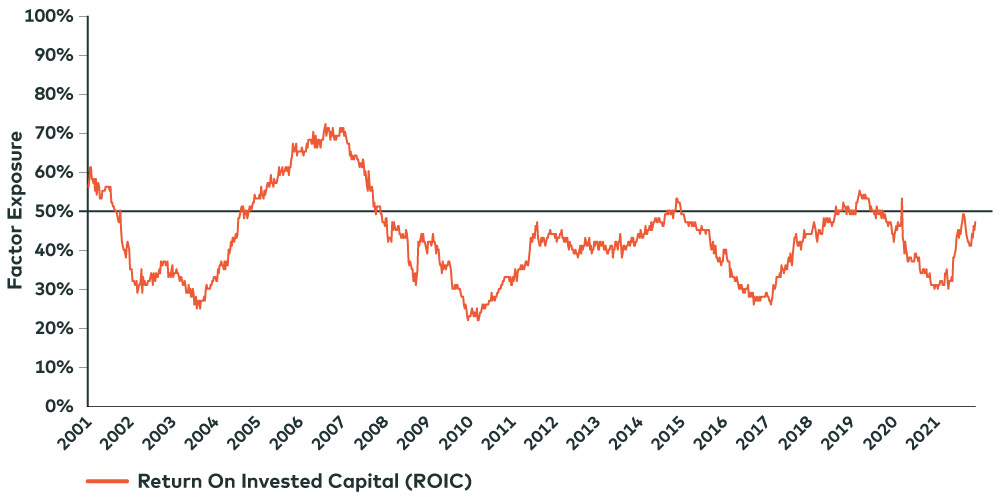
Quality, meanwhile, is also an attribute of high-beta stocks on the upswing. And while it isn’t quite as prominent a factor as growth, the current trend suggests that quality may become more synonymous with high-beta – not less so – over the next while.
The “Quality” Profile of High-Beta Stocks

Source: AGFiQ with data from FactSet as of November 30, 2021. Relative factor exposure of the top quintile of stocks within the largest 550 securities in the U.S. by market capitalization sorted by trailing one-year beta scores. Each stock is ranked relative to the universe of securities and has a corresponding factor exposure based on the factor characteristic. 50% exposure corresponds to the median security based on the factor characteristic.
Still, not all high-beta stocks are created equal and stark differences in growth and quality profiles can be found across and within sectors. In particular, our research shows higher-beta names in information technology (IT) subsectors including hardware and semiconductors are higher quality on average than in other subsectors like automobiles and consumer services where quality is harder to find right now and potential opportunities to this end are less evident, but not entirely scarce. Moreover, the quality profile of higher-beta names in the energy sector may be relatively low compared to other sectors in our analysis, but it has also improved the most of any over the past year and is trending in a favourable direction for what may lie ahead.
The “Quality” Profile of High-Beta Stocks: A Sector Comparison

Source: AGFiQ with data from FactSet as of November 30, 2021. Relative factor exposure of the top quintile of stocks within the largest 550 securities in the U.S. by market capitalization sorted by trailing one-year beta scores. Each stock is ranked relative to the universe of securities and has a corresponding factor exposure based on the factor characteristic. 50% exposure corresponds to the median security based on the factor characteristic.
Ultimately, investors will need to think long and hard about how they approach high-beta stocks in the new year. While a further decline in global PMIs should favour their low-beta counterparts in the short-term, there may be good reason to believe high-beta names with strong quality and growth characteristics can weather the storm of a more defensive stance in equity markets if not actually benefit from the next phase in the economic cycle over time.
The views expressed in this blog are those of the author and do not necessarily represent the opinions of AGF, its subsidiaries or any of its affiliated companies, funds, or investment strategies.
The commentaries contained herein are provided as a general source of information based on information available as of December 23, 2021 and are not intended to be comprehensive investment advice applicable to the circumstances of the individual. Every effort has been made to ensure accuracy in these commentaries at the time of publication, however, accuracy cannot be guaranteed. Market conditions may change and AGF Investments accepts no responsibility for individual investment decisions arising from the use or reliance on the information contained here.
References to specific securities are presented to illustrate the application of our investment philosophy only and do not represent all of the securities purchased, sold or recommended for the portfolio. It should not be assumed that investments in the securities identified were or will be profitable and should not be considered recommendations by AGF Investments.
This document is intended for advisors to support the assessment of investment suitability for investors. Investors are expected to consult their advisor to determine suitability for their investment objectives and portfolio.
AGFiQ is a quantitative investment platform powered by an intellectually diverse, multi-disciplined team that combines the complementary strengths of investment professionals from AGF Investments Inc. (AGFI), a Canadian registered portfolio manager, and AGF Investments LLC (AGFUS), a U.S. registered adviser.
AGF Investments is a group of wholly owned subsidiaries of AGF Management Limited, a Canadian reporting issuer. The subsidiaries included in AGF Investments are AGF Investments Inc. (AGFI), AGF Investments America Inc. (AGFA), AGF Investments LLC (AGFUS) and AGF International Advisors Company Limited (AGFIA). AGFA and AGFUS are registered advisors in the U.S. AGFI is registered as a portfolio manager across Canadian securities commissions. AGFIA is regulated by the Central Bank of Ireland and registered with the Australian Securities & Investments Commission. The subsidiaries that form AGF Investments manage a variety of mandates comprised of equity, fixed income and balanced assets.
® The “AGF” and ™ “AGFiQ” logos are registered trademarks of AGF Management Limited and used under licence.
20220105-1971865
About AGF Management Limited
Founded in 1957, AGF Management Limited (AGF) is an independent and globally diverse asset management firm. AGF brings a disciplined approach to delivering excellence in investment management through its fundamental, quantitative, alternative and high-net-worth businesses focused on providing an exceptional client experience. AGF’s suite of investment solutions extends globally to a wide range of clients, from financial advisors and individual investors to institutional investors including pension plans, corporate plans, sovereign wealth funds and endowments and foundations.
For further information, please visit AGF.com.
© 2022 AGF Management Limited. All rights reserved.
This post was first published at the AGF Perspectives Blog.


