by Don Vialoux, EquityClock.com
The Bottom Line
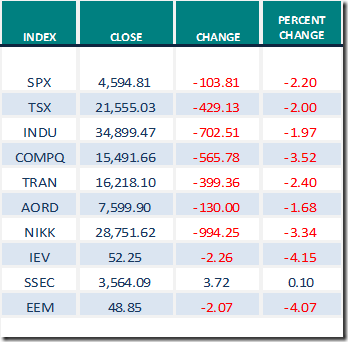
Broadly based equity indices around the world moved sharply lower on Friday Concerns about a new COVID 19 variant took its toll. If history is used as a guide, North American equity markets have entered into a choppy period between now and December 14th followed by a the strongest three week period during the year from December 15th to January 6th .
Observations
Short term short term indicators for U.S. equity indices and sectors (20 day moving averages, short term momentum indicators) moved sharply lower last week.
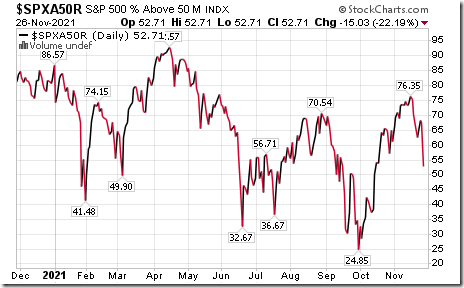
Intermediate term technical indicator for U.S. equity markets (Percent of S&P 500 stocks trading above their 50 day moving average) moved lower last week. It changed from Overbought to Neutral. Trend is down and has yet to show signs of bottoming. See Barometer chart at the end of this report.
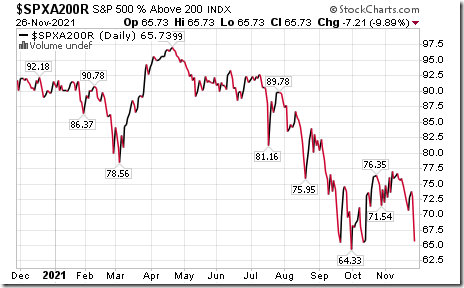
Long term technical indicator for U.S. equity markets (Percent of S&P 500 stocks trading above their 200 day moving average) moved lower last week. It remained Overbought. Trend remains down. See Barometer chart at the end of this report.
Short term momentum indicators for Canadian indices and sectors moved lower last week.
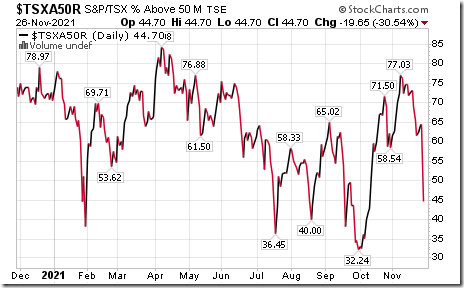
Intermediate term technical indicator for Canadian equity markets changed from Overbought to Neutral last week on a move below 60.00. Trend remains down and has yet to show signs of bottoming. See Barometer chart at the end of this report.
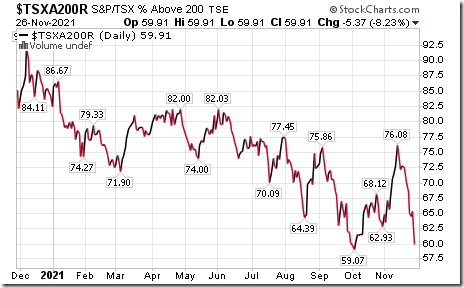
Long term technical indicator for Canadian equity markets (Percent of TSX stocks trading above their 200 day moving average) moved lower again last week. It changed from Overbought to Neutral on a move below 60.00. Trend remains down and has yet to show signs of bottoming. See Barometer charts at the end of this report.
Economic News This Week
Federal Reserve Chairman Powell and Treasury Secretary Yellon give testimony on the U.S. economy to congressional committees on Monday and Tuesday.
September Canadian GDP to be released at 8:30 AM EST on Tuesday is expected to increase 0.1% versus a gain of 0.4% in August.
November Chicago PMI to be released at 9:45 AM EST on Tuesday is expected to slip to 68.2 from 68.4 in October.
October Construction Spending to be released at 10:00 AM EST on Wednesday is expected to increase 0.4$ versus a decline of 0.5% in September
November ISM Manufacturing PMI to be released at 10:00 AM EST on Wednesday is expected to increase to 61.0 from 60.8 in October.
Beige Book is expected to be released at 2:00 AM EST on Wednesday.
Weekly Initial Jobless Claims to be released at 8:30 AM EST on Thursday are expected to increase to 250,000 from 199,000 last week.
November Non-farm Payrolls to be released at 8:30 AM EST on Friday is expected to increase to 563,000 from 531,000 in October. November Unemployment Rate is expected to slip to 4.5% from 4.6% in October. November Hourly Earnings are expected to increase 0.4% versus a gain of 0.4% in October.
November Canadian Employment to be released at 8:30 AM EST on Friday is expected to increase 40,000 versus a gain of 31,200 in October.
October Factory Orders to be released at 8:30 AM EST on Friday are expected to increase 0.5% versus a gain of 0.2% in September.
November ISM Non-Manufacturing PMI to be released at 10:00 AM EST on Friday is expected to slip to 65.0 from 66.7 in October.
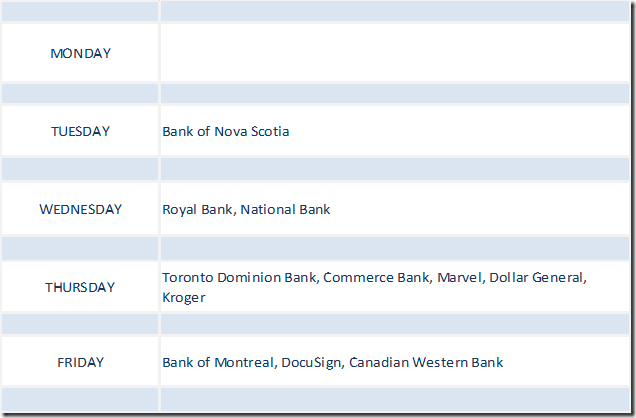
Selected Earnings News This Week
Focus is on fourth quarter earnings reports released by Canada’s big banks
Trader’s Corner
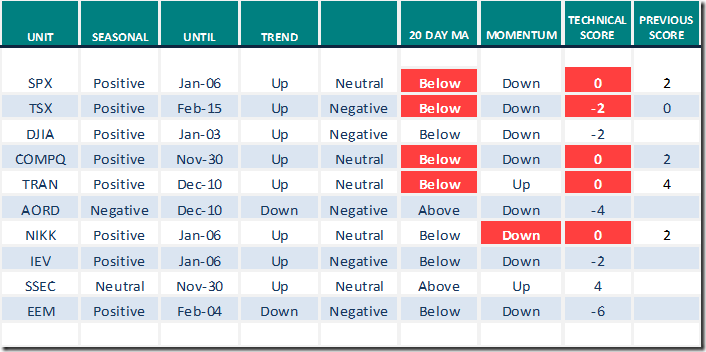
Equity Indices and Related ETFs
Daily Seasonal/Technical Equity Trends for Nov.26th 2021
Green: Increase from previous day
Red: Decrease from previous day
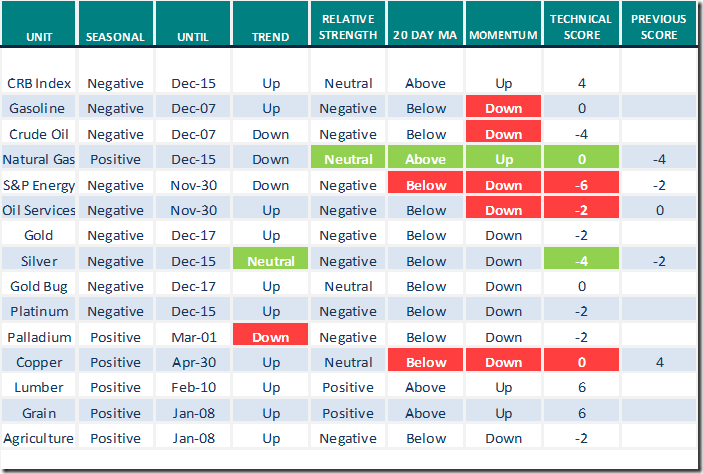
Commodities
Daily Seasonal/Technical Commodities Trends for Nov.26th 2021
Green: Increase from previous day
Red: Decrease from previous day
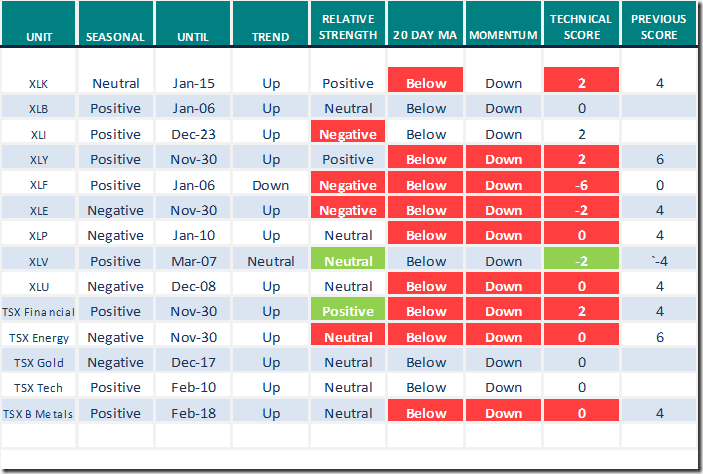
Sectors
Daily Seasonal/Technical Sector Trends for Nov.26th 2021
Green: Increase from previous day
Red: Decrease from previous day
All seasonality ratings are based on performance relative to the S&P 500 Index (except TSX).
Links offered by Valued Providers
Michael Campbell’s Money Talks for Saturday November 27th
https://omny.fm/shows/money-talks-with-michael-campbell/november-27th-episode
Thank you to David Chapman and www.EnrichedInvesting.com for a link to Technical Scoop
Thank you to Mark Bunting and www.uncommonsenseinvestor.com for the following links:
Innovative Low-Risk Way to Play the Copper Boom – Uncommon Sense Investor
The 30 Best Stocks of the Past 30 Years | Kiplinger
Greg Schnell says “Ignore the news”. Following is the link:
Ignore The News | ChartWatchers | StockCharts.com
Mark Leibovit on Howe Street Radio: Will there be a Santa Claus rally this year?
HOWE-STREET-VISUAL-NOV-25.jpg (1906×827) (leibovitvrnewsletters.com)
Technical Scores
Calculated as follows:
Intermediate Uptrend based on at least 20 trading days: Score 2
(Higher highs and higher lows)
Intermediate Neutral trend: Score 0
(Not up or down)
Intermediate Downtrend: Score -2
(Lower highs and lower lows)
Outperformance relative to the S&P 500 Index: Score: 2
Neutral Performance relative to the S&P 500 Index: 0
Underperformance relative to the S&P 500 Index: Score –2
Above 20 day moving average: Score 1
At 20 day moving average: Score: 0
Below 20 day moving average: –1
Up trending momentum indicators (Daily Stochastics, RSI and MACD): 1
Mixed momentum indicators: 0
Down trending momentum indicators: –1
Technical scores range from -6 to +6. Technical buy signals based on the above guidelines start when a security advances to at least 0.0, but preferably 2.0 or higher. Technical sell/short signals start when a security descends to 0, but preferably -2.0 or lower.
Long positions require maintaining a technical score of -2.0 or higher. Conversely, a short position requires maintaining a technical score of +2.0 or lower
Changes Last Week
Technical Notes released on Friday at
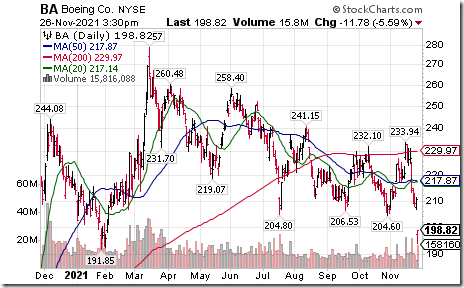
A wide variety of big cap U.S. and Canadian equities have moved below intermediate support this morning. U.S. equities include $TCOM $BA $HON $BMY $CSX . TSX 60 stocks included $ARX.CA $CCL.B.CA $SNC.CA
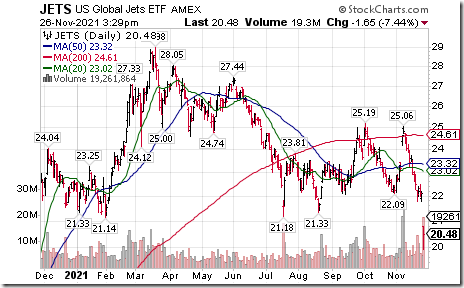
U.S. Airlines ETF $JETS moved below $21.18 extending an intermediate downtrend. Impacted by rising COVID 19 concerns.
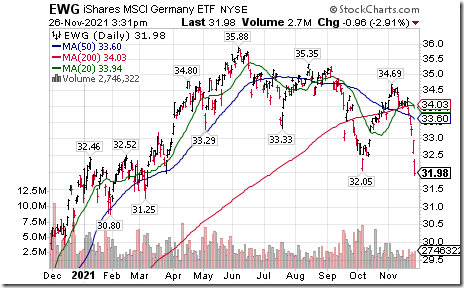
Germany iShares $EWG moved below $32.05 extending an intermediate downtrend. Responding to rising COVID 19 concerns.
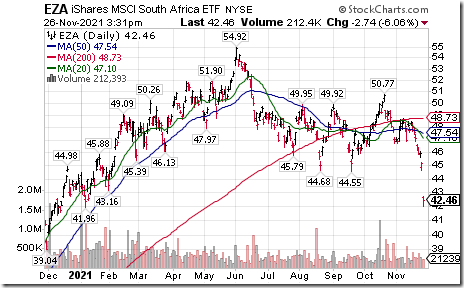
South Africa iShares $EZA moved below extending an intermediate downtrend. Reacting to new variant of COVID 19 initially detected in South Africa
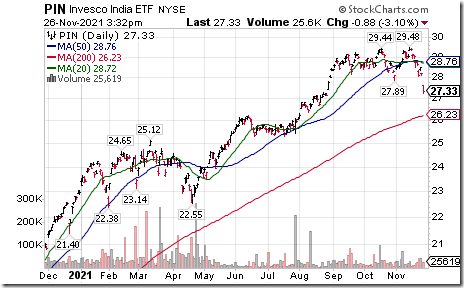
India ETF $PIN moved below $27.89 completing a double top pattern. Responding to rising COVID 19 infections.
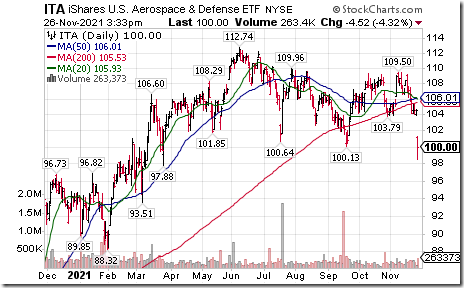
Aerospace & Defense iShares $ITA moved $100.13 extending an intermediate downtrend.
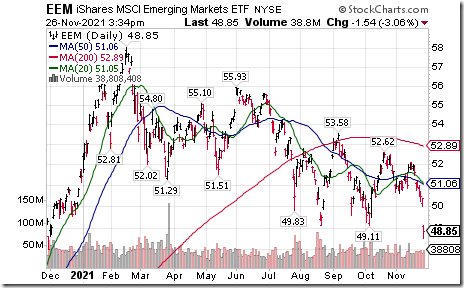
Emerging markets ETF $EEM moved below $49.11 extending an intermediate downtrend.
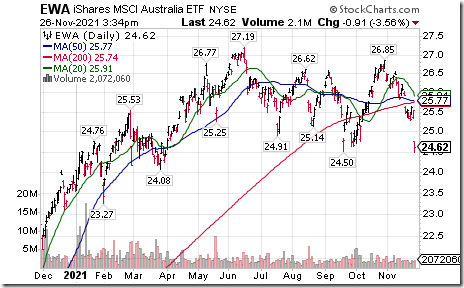
Australia iShares $EWA moved below $24.50 resuming an intermediate downtrend.
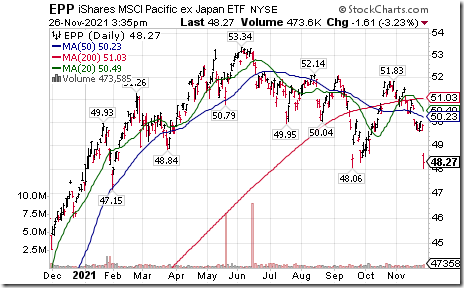
Pacific ex Japan iShares $EPP moved below$48.06 extending an intermediate downtrend.
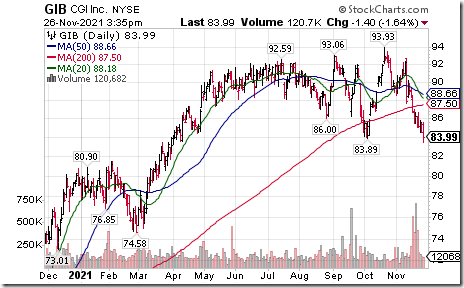
CGI Group $GIB a TSX 60 stock moved below US$83.89 setting an intermediate downtrend.
S&P 500 Momentum Barometers
The intermediate term Barometer plunged 15.03 to 52.71 on Friday and 9.82 last week to 52.71.. It changed from Overbought to Neutral on a drop below 60.00. Trend remains down.
The longer term Barometer dropped 7.21 on Friday and 5.01 last week to 65.73. It remains Overbought and continues to trend down.
TSX Momentum Barometers
The intermediate term Barometer plunged 19.65 on Friday and 20.72 last week to 44.70. It changed from Overbought to Neutral on a drop below 60.00. Trend remains down.
The long term Barometer dropped 5.27 on Friday and 10.18 last week to 59.91. It changed from Overbought to Neutral on a move below 60.00. Trend remains down.
Disclaimer: Seasonality and technical ratings offered in this report and at
www.equityclock.com are for information only. They should not be considered as advice to purchase or to sell mentioned securities. Data offered in this report is believed to be accurate, but is not guaranteed
This post was originally publised at Vialoux's Tech Talk.


