by Don Vialoux, EquityClock.com
The Bottom Line
Developed world equity indices were higher last week. Star performers by far were Far East indices. Greatest influences remain ramping up of a fourth wave by COVID 19 (negative) and continued expansion of distribution of a COVID 19 vaccine (positive).
Observations
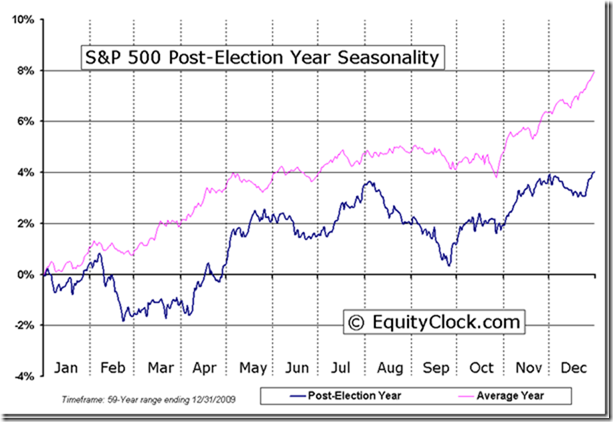
North American equity indices were mixed last week. The S&P 500 Index, NASDAQ Composite Index and TSX Composite Index moved slightly higher to all-time highs. On the other hand, the Dow Jones Industrial Average and the Dow Jones Transportation Average moved slightly lower. North American equity indices have a history of recording a mild correction of 3%-4% between now and the beginning of October followed by resumption of an intermediate uptrend to the end of the year.
U.S. equity indices responded slightly to discouraging economic news on Friday. August non-farm payrolls substantially missed consensus estimates. U.S. equity indices interpreted the news as a slower than consensus economic recovery this fall (negative) and a delay by the Federal Reserve’s plan to taper treasury bond purchases (positive).
After the close on Friday, S&P announced three new additions to the S&P 500 Index. They were Match (MTCH), Ceridian (CDAY) and Brown & Brown (BRO). All popped higher on the news.
Short term short term indicators for U.S. equity indices and sectors (20 day moving averages, short term momentum indicators) were virtually unchanged at overbought levels last week.
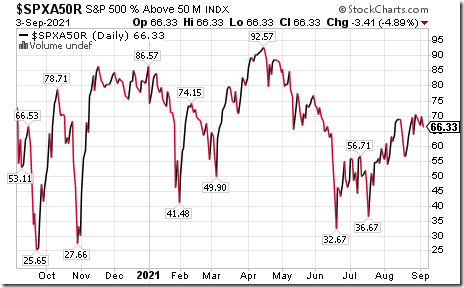
Intermediate term technical indicator for U.S. equity markets (Percent of S&P 500 stocks trading above their 50 day moving average) moved slightly lower last week. It remained Overbought. See Barometer charts at the end of this report.
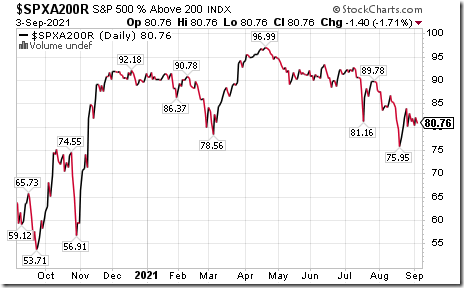
Long term technical indicator for U.S. equity markets (Percent of S&P 500 stocks trading above their 200 day moving average) also moved slightly lower last week. It remained Extremely Overbought. See Barometer chart at the end of this report.
Short term momentum indicators for Canadian indices and sectors were virtually unchanged last week at overbought levels.
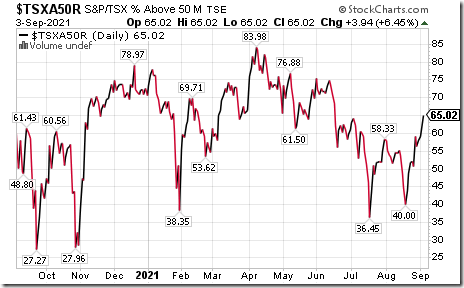
Intermediate term technical indicator for Canadian equity markets moved higher last week. It remained Neutral. See Barometer chart at the end of this report.
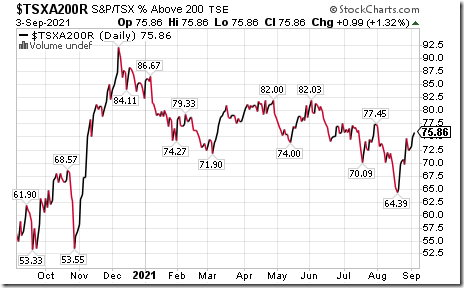
Long term technical indicator for Canadian equity markets (Percent of TSX stocks trading above their 200 day moving average) moved higher last week. It remained Overbought. See Barometer charts at the end of this report.
Consensus estimates for earnings by S&P 500 companies continued to increase from our previous report on August 16th. With over 99% of companies reported to date earnings in the second quarter on a year-over-year basis increased 90.9% (versus previous estimate at 89.3%) and revenues increased 25.2% (versus previous estimate at 24.8%). Earnings in the third quarter are projected to increase 28.1% (versus previous estimate at 27.8%) and revenues are projected to increase 14.8% (versus previous estimate at14.4%. Earnings in the fourth quarter are projected to increase 21.6% (versus previous estimate at 21.3%) and revenues are projected to increase 11.3% (versus previous estimate at 11.0). Earnings for all of 2021 are projected to increase 42.6% (versus previous estimate at 41.9%) and revenues are projected to increase 14.8% (versus previous estimate at 14.5%). Earnings in 2022 are projected to increase 9.3% (versus previous estimate at 9.4%) and revenues are projected to increase 6.5%.
Economic News This Week
Bank of Canada interest rate to be released at 10:00 AM EDT on Wednesday is expected to remain unchanged at 0.25%.
ECB interest rate decision and monetary policy statement to be released at 7:45 AM EDT on Thursday are expected to remain unchanged.
Bank of Canada Governor Macklem speaks on monetary policy at 12:00 Noon on Thursday.
August Producer Price Index to be released at 8:30 AM EDT on Friday is expected to increase 0.6% versus a gain of 1.0% in July. Excluding food and energy, August Producer Price Index is expected to increase 0.5% versus a gain of 1.0% in July.
Canada’s August Employment Change to be released at 8:30 AM EDT is expected to . August Unemployment Rate is expected to slip to 7.4% from 7.5% in July.
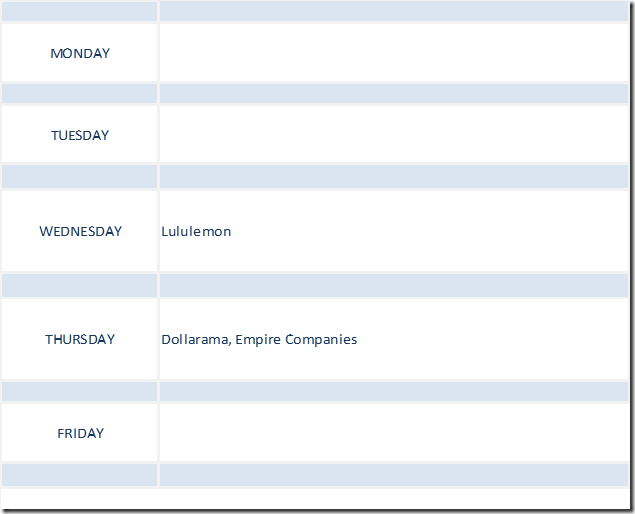
Selected Earnings News This Week
Quiet week for quarterly reports!
Trader’s Corner
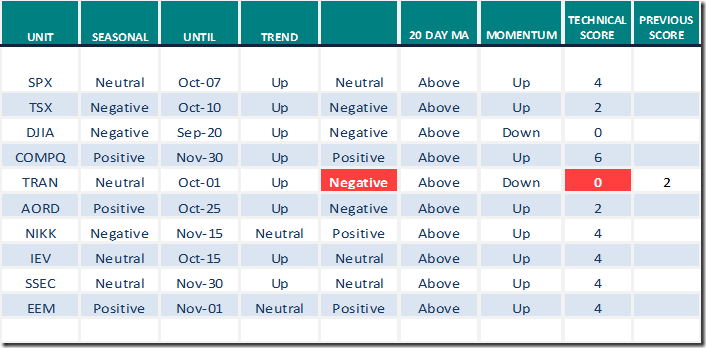
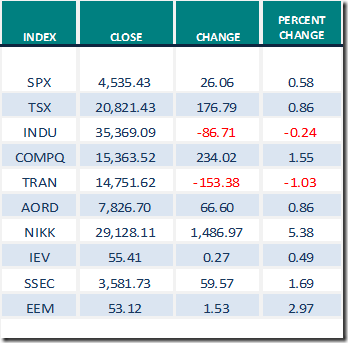
Equity Indices and Related ETFs
Green: Increase from previous day
Red: Decrease from previous day
Commodities
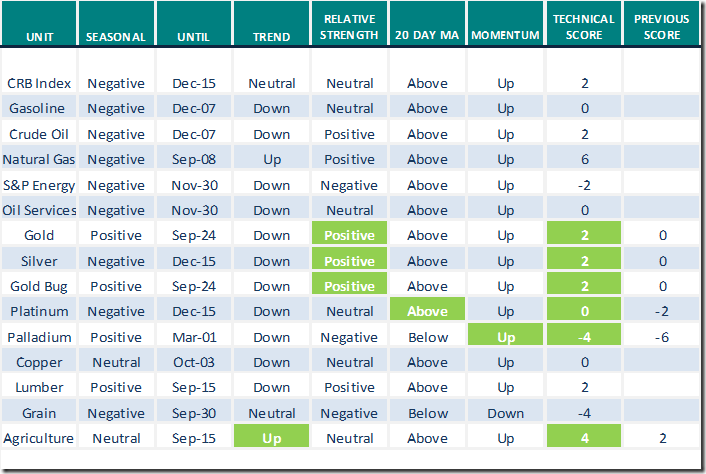
Daily Seasonal/Technical Commodities Trends for September 3rd 2021
Green: Increase from previous day
Red: Decrease from previous day
Sectors
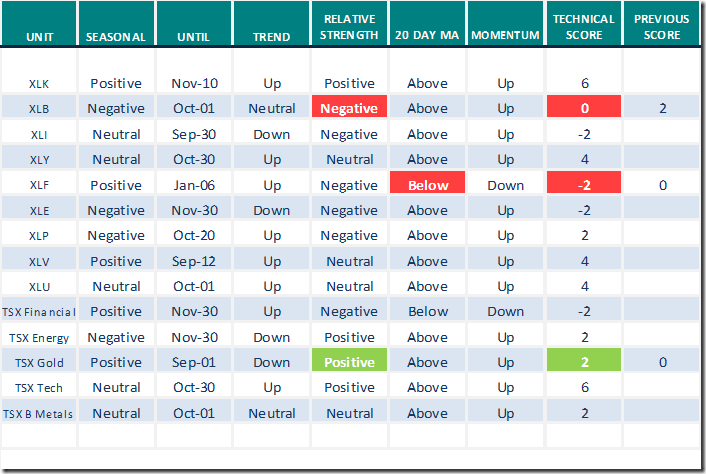
Daily Seasonal/Technical Sector Trends for September 3rd 2021
Green: Increase from previous day
Red: Decrease from previous day
All seasonality ratings are based on performance relative to the S&P 500 Index
Links offered by valued providers
Mike’s Money Talks
Link to the Saturday September 4th show
Entire Show – Sept 4th – Money Talks with Michael Campbell – Omny.fm
Comments from www.uncommonsenseinvestor.com
Thank you to Mark Bunting and Uncommon SENSE Investor for a link to the following report:
Four Shipping Stocks That Could Keep Sailing Higher – Uncommon Sense Investor
Seven Things That Could Derail Stocks – Uncommon Sense Investor
https://uncommonsenseinvestor.com/this-book-is-somewhat-of-a-bible-to-me
FREE EDITION | The Macro Show with Keith McCullough (9/1/21) (hedgeye.com)
McCullough: My Top 5 Positions Right Now (Including Crypto) (hedgeye.com)
Still Room to Grow in Tech | Morningstar
David Rosenberg: How Canada’s election could affect stocks, bonds and the loonie | Financial Post
Technical Scoop
Thank you to David Chapman and www.EnrichedInvesting.com for a link to their weekly report
Catch more of these stunning returns
Greg Schell examines the energy sector.
Catch More of These Stunning Returns! | ChartWatchers | StockCharts.com
Technical Scores
Calculated as follows:
Intermediate Uptrend based on at least 20 trading days: Score 2
(Higher highs and higher lows)
Intermediate Neutral trend: Score 0
(Not up or down)
Intermediate Downtrend: Score -2
(Lower highs and lower lows)
Outperformance relative to the S&P 500 Index: Score: 2
Neutral Performance relative to the S&P 500 Index: 0
Underperformance relative to the S&P 500 Index: Score –2
Above 20 day moving average: Score 1
At 20 day moving average: Score: 0
Below 20 day moving average: –1
Up trending momentum indicators (Daily Stochastics, RSI and MACD): 1
Mixed momentum indicators: 0
Down trending momentum indicators: –1
Technical scores range from -6 to +6. Technical buy signals based on the above guidelines start when a security advances to at least 0.0, but preferably 2.0 or higher. Technical sell/short signals start when a security descends to 0, but preferably -2.0 or lower.
Long positions require maintaining a technical score of -2.0 or higher. Conversely, a short position requires maintaining a technical score of +2.0 or lower
Changes Last Week
Note exceptional performance by NIKK, SSEC and EEM. Other Far East indices and their ETFs recording exceptional performance last week included Taiwan, Vietnam and South Korea
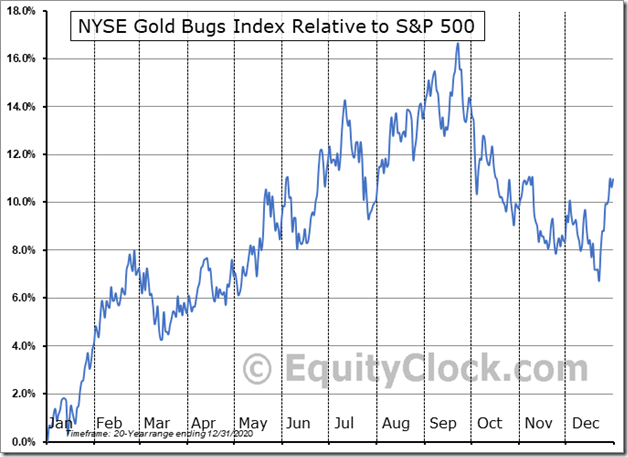
Seasonality Chart of the Day from www.EquityClock.com
Seasonal influences for gold and gold equities finally are showing their period of seasonal strength into the month of September.
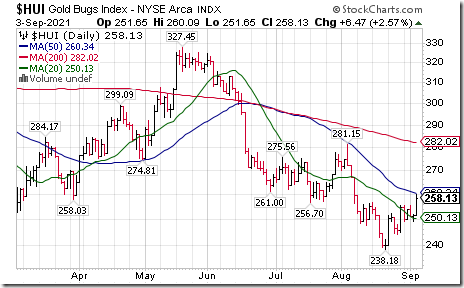
Nice pop in gold and silver equities and related ETFs on Friday! HUI moved above its 20 day moving average.
Technical Notes for Friday at
StockTwits.com@EquityClock
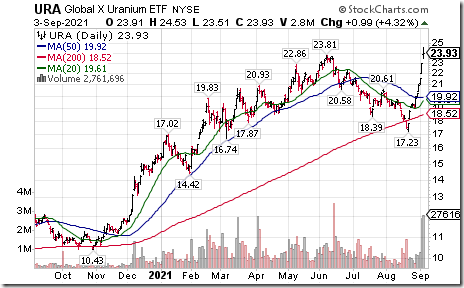
Global X Uranium ETF $URA moved above US$23.81 to six year high extending an intermediate uptrend.
Editor’s Note: Impressive volume increase on Friday.
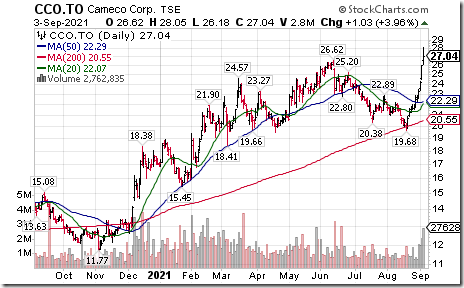
Cameco $CCJ a TSX 60 stock moved above US$21.95 to a 6 year high extending an intermediate uptrend.
Editor’s Note: Target price for the stock was increased substantially by RBC on Friday.
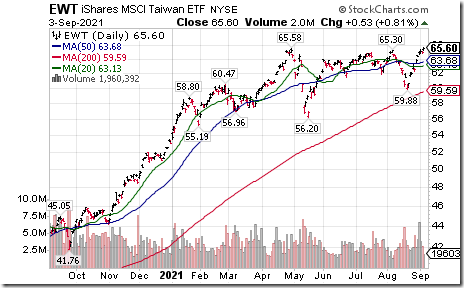
Taiwan iShares $EWT moved above $65.58 to an all-time high extending an intermediate uptrend.
Editor’s Note: Far East equity markets continue to surge.
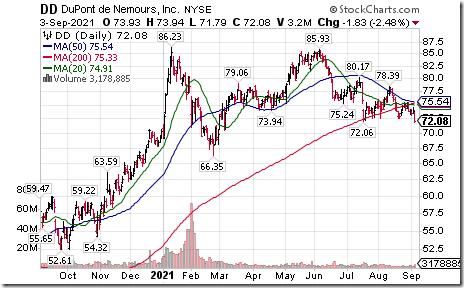
Dupont $DD an S&P 100 stock moved below $72.35 extending an intermediate downtrend.
S&P 500 Momentum Barometers
The intermediate term Barometer slipped 3.41 on Friday and 4.31 last week to 66.33. It remains Overbought.
The long term Barometer slipped 1.40 on Friday and 2.21 last week to 80.76. It remains Extremely Overbought.
TSX Momentum Barometers
The intermediate term Barometer added 3.94 on Friday and 5.80 last week to 65.02. It remains Overbought.
The long term Barometer added 0.99 on Friday and 1.10 last week to 75.86. It remains Overbought.
Disclaimer: Seasonality and technical ratings offered in this report and at
www.equityclock.com are for information only. They should not be considered as advice to purchase or to sell mentioned securities. Data offered in this report is believed to be accurate, but is not guaranteed
This post was originally publised at Vialoux's Tech Talk.


