by Don Vialoux, EquityClock.com
The Bottom Line
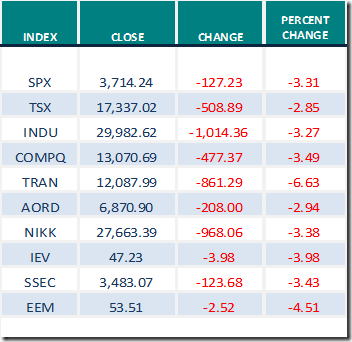
Equity markets around the world moved lower last week. Greatest influences on North American equity markets remain growing evidence of a second wave of the coronavirus (negative) and timing of distribution of a vaccine (positive). Seasonal influences for U.S. equity markets are remain negative until the second half of February.
Observations
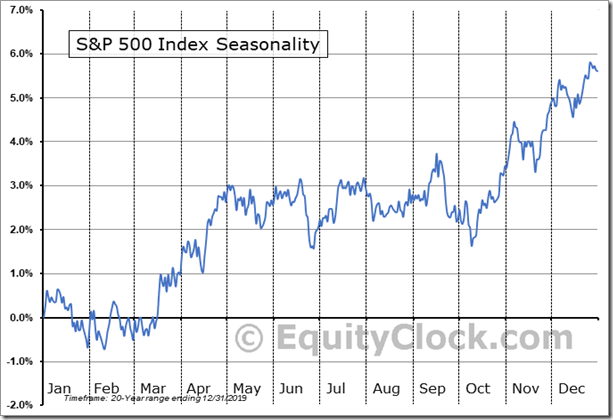
“Santa Claus Hangover” period continues. On average, the S&P 500 Index during the past 20 periods from January 8th to February 14th dropped 1.5% per period: All of the gains recorded during the Santa Claus Rally period from December 14th to January 8th were lost during the Santa Claus Hangover period. This is the time of year when U.S. consumers and investors are paying down debts accrued during the Santa Claus Rally period.
What about this year? In January 2021, the S&P 500 Index dropped 1.11% and the TSX Composite Index slipped 0.55%.Weakness in U.S. equity indices this year is compounding by another recurring event, response to regime change from one party to the other in the year after a U.S. Presidential election. On average, the Dow Jones Industrial Average and S&P 500 Index have dropped slightly more than 3.3% from the second week in January to the third week in February.
On January 21st, the day after President Biden took office, the Dow Jones Industrial Average at 31,272.22 and S&P 500 Index at 3,870.90 reached at least a short term peak.
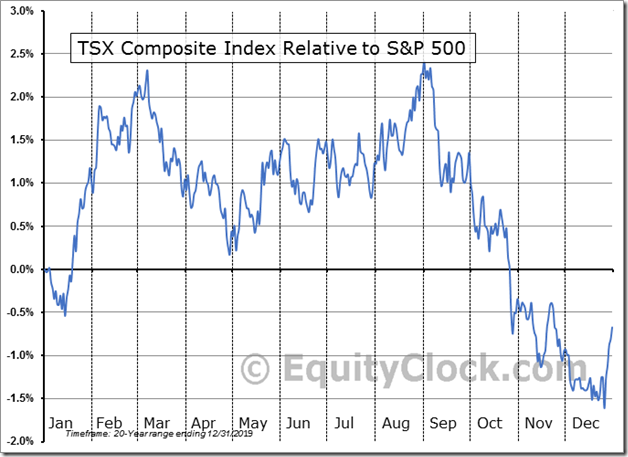
Note that the “Santa Claus Hangover” normally does not happen in the Canadian equity market. The main reason: Canadian investors focus on contributing to their RRSPs during the first 60 days in the New Year and subsequently invest more funds into the equity market. Strongest period in the year for the TSX Composite Index relative to the S&P 500 Index is from mid-December to the first week in March. As indicated in the chart below, average gain per period for the TSX Composite Index relative to the S&P 500 Index during the past 20 periods was 3.3%. The TSX Composite Index has slightly outperformed the S&P 500 Index since December 31st (notably last week when both indices moved lower) .
Intermediate term technical indicator for U.S. equity markets (e.g. Percent of S&P 500 stocks trading above their 50 day moving average) moved lower again last week. It changed from intermediate overbought to intermediate neutral and is trending down. See Barometer chart at the end of this report.
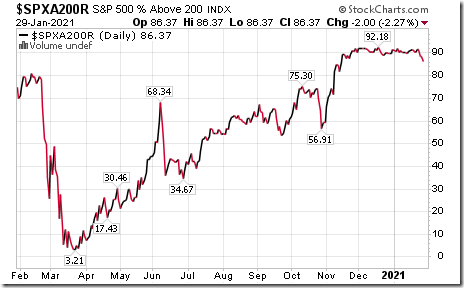
Long term technical indicator for U.S. equity markets (e.g. Percent of S&P 500 stocks trading above their 200 day moving average).began moving lower last week from an extremely overbought levels. It remains extremely intermediate overbought. See chart at the end of this report.
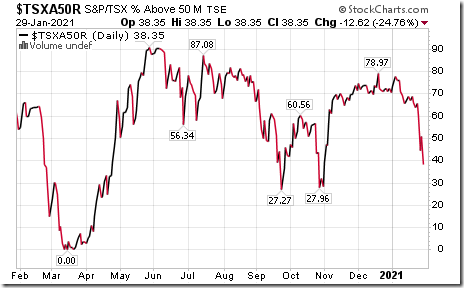
Medium term technical indicator for Canadian equity markets moved lower again last week. It changed from intermediate neutral to intermediate oversold and its short term trend remains down. See Barometer chart at the end of this report.
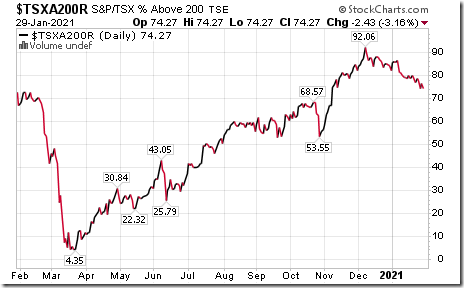
Long term technical indicators for Canadian equity markets (i.e. Percent of TSX stocks trading above their 200 day moving average) also moved lower again last week. It remains intermediate overbought and trending down. See Barometer chart at the end of this report.
Short term short term indicators for U.S. equity indices (20 day moving averages, short term momentum indicators) moved lower last week. Short term indicators for commodities and sectors (with the notable exception of the Silver and Grain sectors) also moved lower.
Short term momentum indicators for Canadian indices and sectors also moved lower last week.
Year-over-year 2020 consensus earnings declines by S&P 500 companies ebbed again last week. According to www.FactSet.com, fourth quarter earnings are expected to drop 2.3% on a year-over-year basis (versus previous decline of 4.7% last week) and revenues are expected to increase 1.7% (versus previous 0.7% increase last week). Earnings for all of 2020 are expected to fall 12.1% (versus previous 12.3% decline) and revenues are expected to decline 1.3% (versus previous 1.5% decline).
Consensus estimates for earnings and revenues by S&P 500 companies turn positive on a year-over-year basis in the first quarter of 2021. According to www.FactSet.com earnings in the first quarter of 2021 on a year-over-year basis are expected to increase 19.6% (versus previous 18.1% increase last week) and revenues are expected to increase 4.8% (versus previous 3.9% increase). Earnings in the second quarter are expected to increase 48.7 % (versus previous 47.8% increase) and revenues are expected to increase 15.1% (versus previous 14.8% increase). Earnings in the third quarter are expected to increase 16.0% (versus previous 15.3% increase) and revenues are expected to increase 9.0% (versus previous 8.7% increase). Earnings in the fourth quarter are expected to increase 17.2% (versus previous 18.1% increase) and revenues are expected to increase 7.0% (versus previous 7.3% increase). Earnings for all of 2021 are expected to increase 23.6% (versus previous 22.7%) and revenues are expected to increase 8.7% (versus previous 8.3% increase).
Economic News This Week
December Construction Spending to be released on Monday at 10:00 AM EST is expected to increase 0.9% versus a gain of 0.9% in November.
January Manufacturing ISM to be released on Monday at 10:00 AM EST is expected to slip to 60.0 from 60.5 in December.
January ADP Non-farm Employment to be release on Wednesday at 8:15 AM EST is expected to increase 45,000 versus a drop of 123,000 in December.
January Non-manufacturing ISM to be released on Wednesday at10:00 AM EST is expected drop to 55.0 from 60.5 in December.
Annualized Fourth Quarter Non-farm Productivity to be released on Thursday at 8:30 AM EST is expected to drop 2.9% versus a gain of 4.6% in the third quarter.
Initial Jobless Claims to be released at 8:30 AM EST on Thursday are expected to reach 830,000 versus 847,000 last week.
December Factory Orders to be released on Thursday at 10:00 AM EST are expected to increase 0.7% versus a gain of 1.0% in November.
January Non-farm Payrolls to be released on Friday at 8:30 AM EST are expected to increase 50,000 versus a drop of 140,000 in December. January Unemployment Rate is expected to remain unchanged from December at 6.7%. January Average Hourly Earnings are expected to increase 0.3% versus a gain of 0.8% in December.
December U.S. Trade Deficit to be released on Friday at 8:30 AM EST is expected to ease to $65.70 billion from $68.10 billion in November.
Canadian January Employment to be released on Friday at 8:30 AM EST is expected to drop 55,000 versus a decline of 62,600 in December. Canadian January Unemployment Rate is expected to increase to 8.9% from December at 8.6%.
Canadian December Trade Deficit to be released on Friday at 8:30 AM EST is expected to dip to $2.60 billion from $3.31 billion in November.
Selected Earnings News This Week
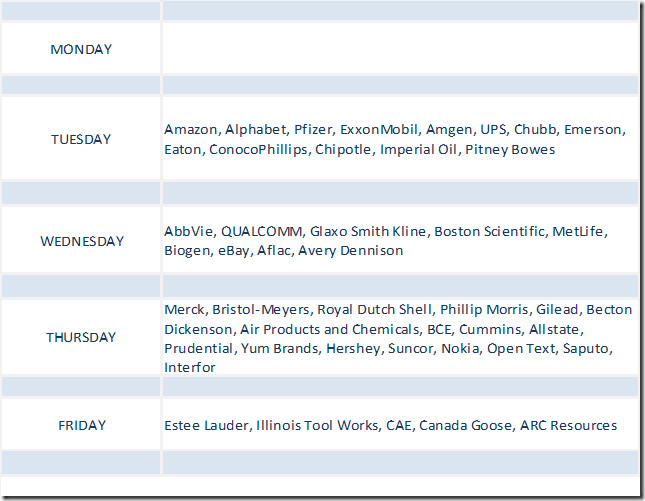
Frequency of quarterly earnings reports ramped up last week. To date, 37% of S&P 500 companies have reported: 76% have exceeded earnings consensus and 82% have exceeded revenue consensus. Next week, another 110 S&P 500 companies (including two Dow Jones Industrial Average companies) are scheduled to report. TSX 60 companies begin their reporting period this week.
Trader’s Corner
Equity Indices and Related ETFs
Daily Seasonal/Technical Equity Trends for January 29th 2021
Green: Increase from previous day
Red: Decrease from previous day
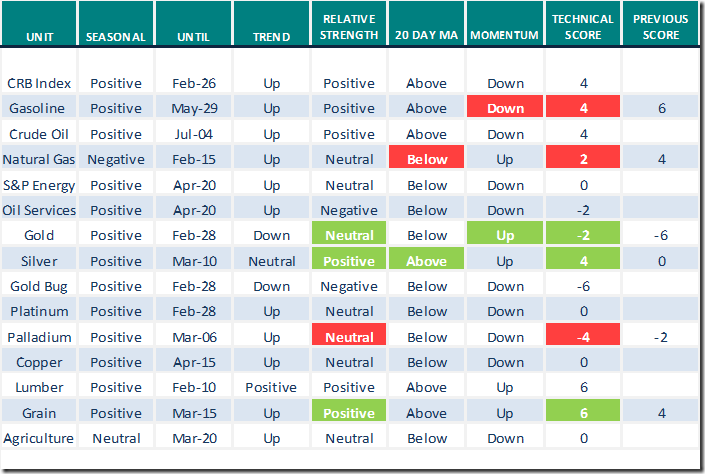
Commodities
Daily Seasonal/Technical Commodities Trends for January 29th 2021
Green: Increase from previous day
Red: Decrease from previous day
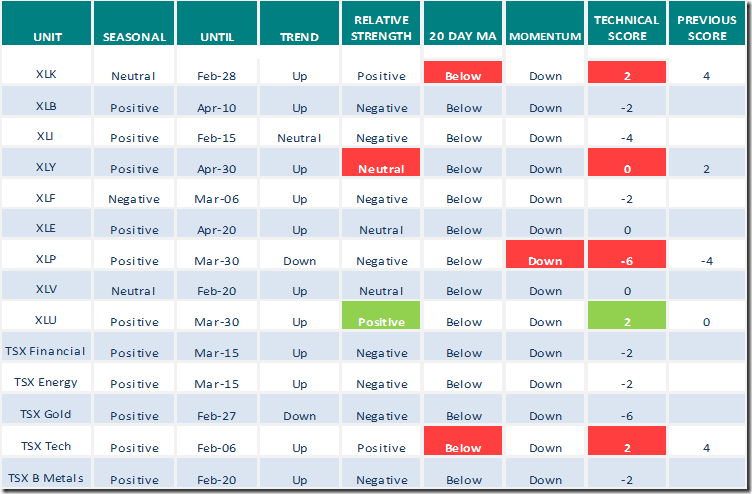
Sectors
Daily Seasonal/Technical Sector Trends for January 29th 2021
Green: Increase from previous day
Red: Decrease from previous day
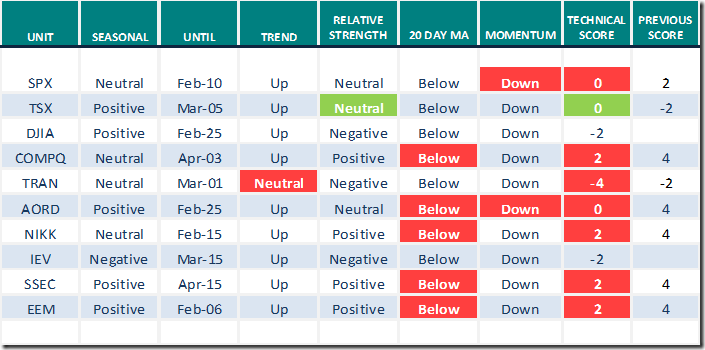
Technical Scores
Calculated as follows:
Intermediate Uptrend based on at least 20 trading days: Score 2
(Higher highs and higher lows)
Intermediate Neutral trend: Score 0
(Not up or down)
Intermediate Downtrend: Score -2
(Lower highs and lower lows)
Outperformance relative to the S&P 500 Index: Score: 2
Neutral Performance relative to the S&P 500 Index: 0
Underperformance relative to the S&P 500 Index: Score –2
Above 20 day moving average: Score 1
At 20 day moving average: Score: 0
Below 20 day moving average: –1
Up trending momentum indicators (Daily Stochastics, RSI and MACD): 1
Mixed momentum indicators: 0
Down trending momentum indicators: –1
Technical scores range from -6 to +6. Technical buy signals based on the above guidelines start when a security advances to at least 0.0, but preferably 2.0 or higher. Technical sell/short signals start when a security descends to 0, but preferably -2.0 or lower.
Long positions require maintaining a technical score of -2.0 or higher. Conversely, a short position requires maintaining a technical score of +2.0 or lower
Changes Last Week
Technical Notes for Friday January 29th
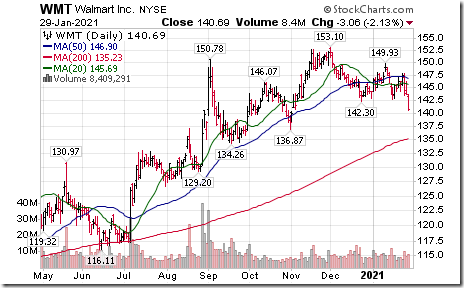
Walmart (WMT), a Dow Jones Industrial Average stock moved below $142.30 setting an intermediate downtrend.
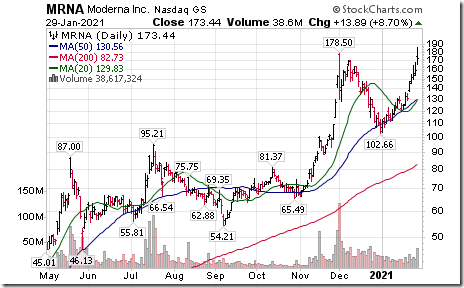
Moderna (MRNA), a NASDAQ 100 stock moved above $178.50 to an all-time high extending an intermediate uptrend.
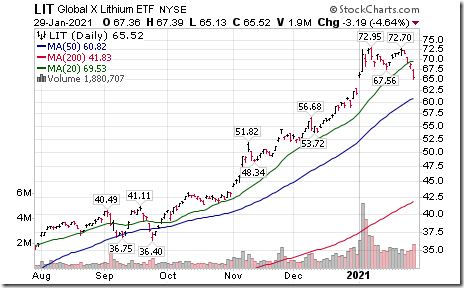
Lithium ETN (LIT) moved below $67.56 completing a short term double top pattern.
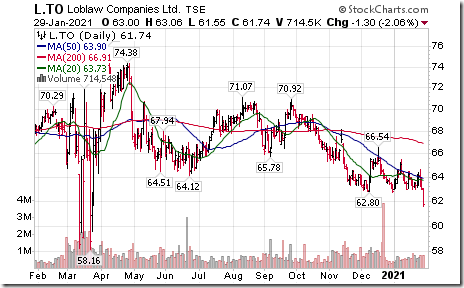
Loblaw Companies (L), a TSX 60 stock moved below $62.80 extending an intermediate downtrend.
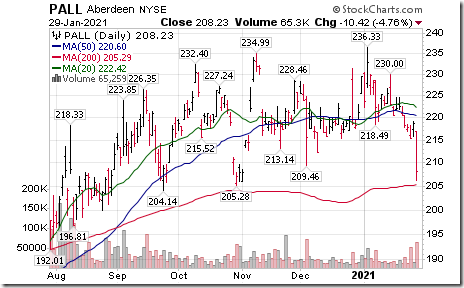
Palladium ETN (PALL) moved below intermediate support at $209.46.
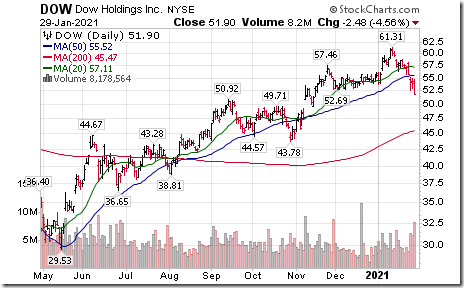
Dow (DOW), an S&P 100 stock moved below intermediate support at $52.69.
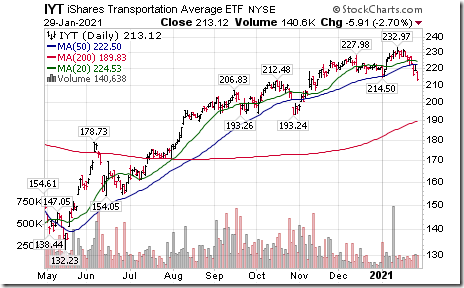
Transportation iShares (IYT) moved below intermediate support at $214.50
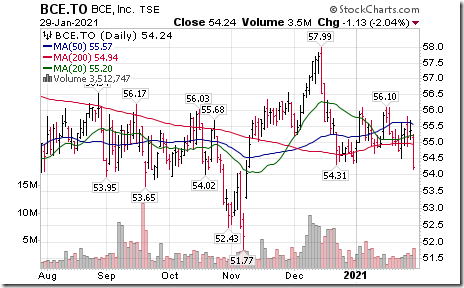
BCE (BCE), a TSX 60 stock moved below $54.31 setting an intermediate downtrend.
S&P 500 Momentum Barometers
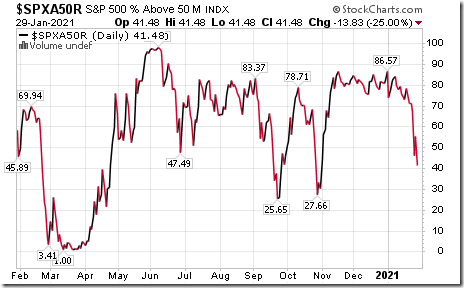
The intermediate Barometer plunged 13.83 on Friday and 29.86 last week to 41.48. It changed from intermediate overbought to intermediate neutral on a move below 60.00. Short term trend is down.
The long term Barometer dropped 2.00 on Friday and 3.81 last week to 86.37. It remains extremely intermediate overbought and showing early short term signs of trending down.
TSX Momentum Barometers
The intermediate Barometer dropped 12.82 on Friday and 25.55 last week to 38.35. It changed on Friday from intermediate neutral to intermediate oversold on a move below 40.00. It continues in a short term downtrend.
The long term Barometer slipped 2.43 on Friday and 2.80 last week to 74.27. It remains long term overbought and its trend is down.
Disclaimer: Seasonality and technical ratings offered in this report and at
www.equityclock.com are for information only. They should not be considered as advice to purchase or to sell mentioned securities. Data offered in this report is believed to be accurate, but is not guaranteed
This post was originally publised at Vialoux's Tech Talk.


