


Bedding and furniture producer Leggett & Platt (LEG) continues to climb within the Green Favored Zone of the SIA S&P 500 Index Report, moving up 11 spots yesterday to 40th place.
Since bottoming out in March, Leggett & Platt shares have been under accumulation, steadily advancing in a rising channel of higher highs and higher lows. This bullish trend recently received positive confirmation from a Golden Cross of the 50-day average back above the 200-day average, and a breakout that filled in an old gap.
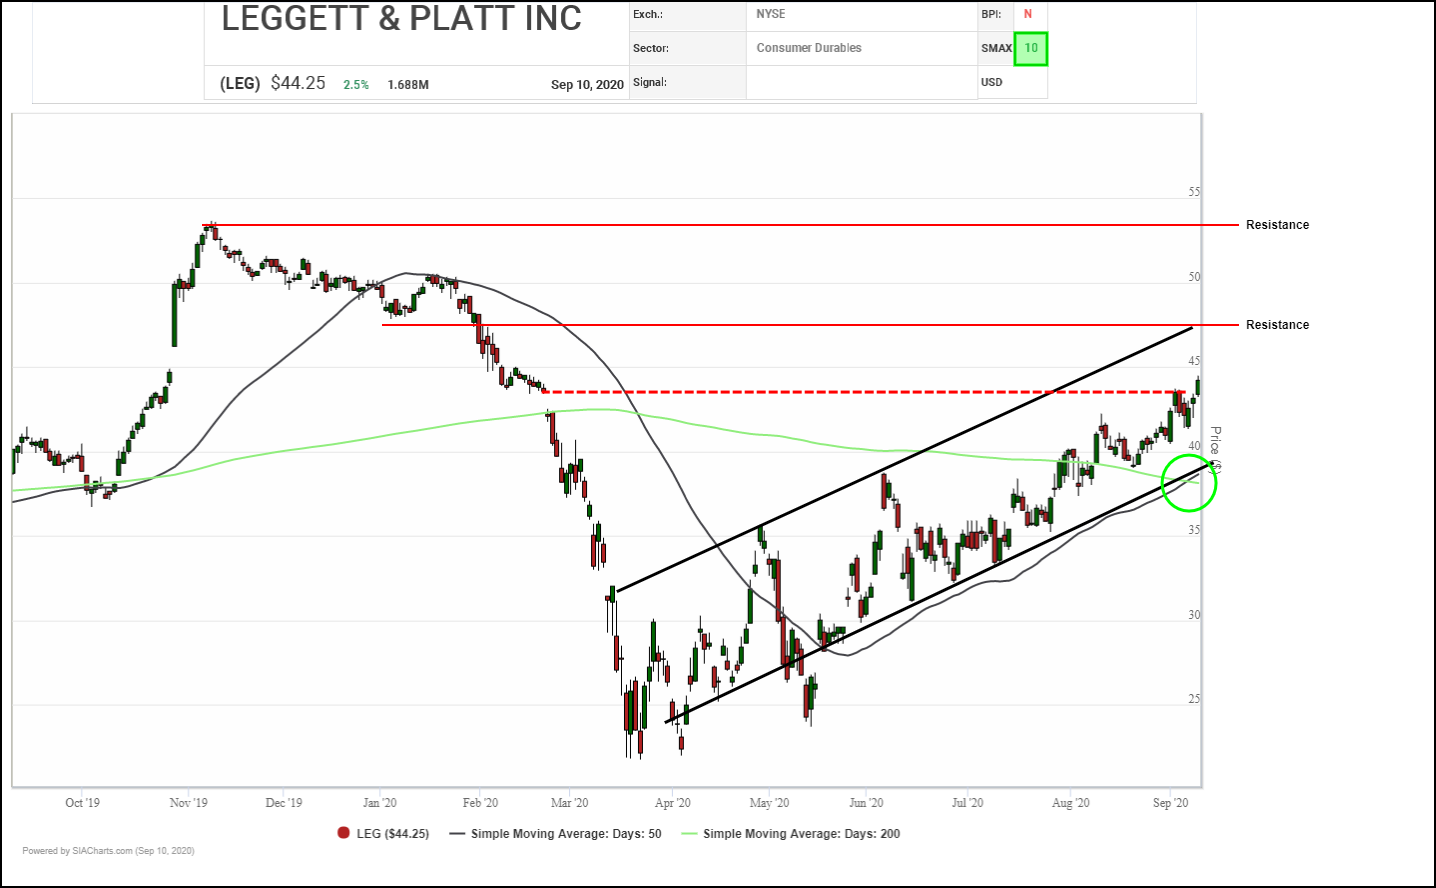
Next potential upside resistance appears at previous highs and lows near $47.50 and $53.50 with the $50.00 round number in between them. Initial support appears between $40.00 and $42.00.
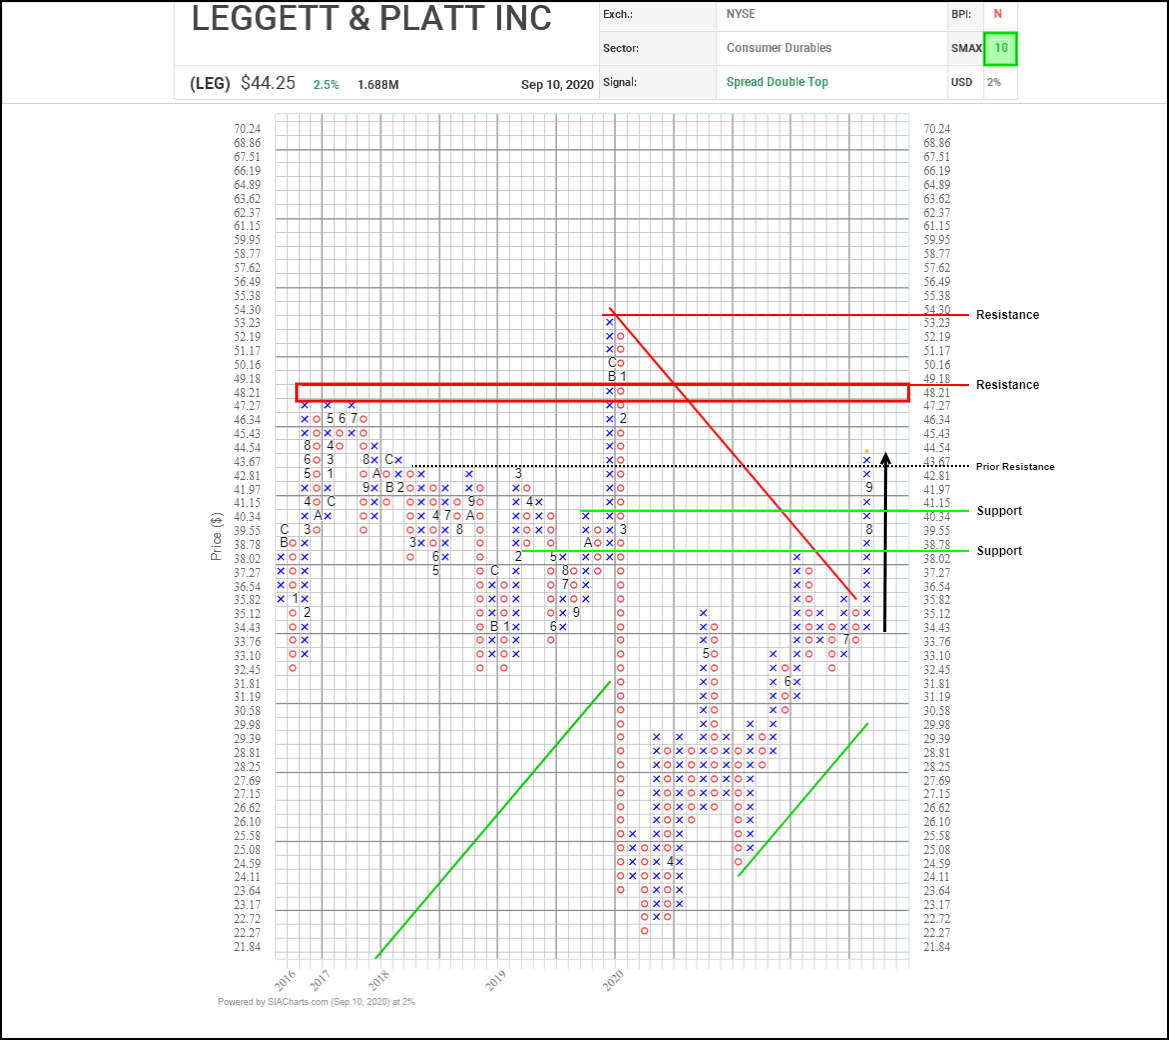
Back in July, Leggett & Platt (LEG) snapped a downtrend line and completed a bullish Spread Double Top, signaling the start of a new advance. The shares have remained under accumulation since then, breaking through previous highs near $43.65 this week.
Next potential upside resistance appears in the $48.20 to $49.20 range where previous column highs and a horizontal count converge just below the $50.00 round number, then the previous peak near $54.30. Initial support appears near $40.35 based on a 3-box reversal.
With its bullish SMAX score increasing to a perfect 10, LEG is exhibiting near-term strength across the asset classes.
Disclaimer: SIACharts Inc. specifically represents that it does not give investment advice or advocate the purchase or sale of any security or investment whatsoever. This information has been prepared without regard to any particular investors investment objectives, financial situation, and needs. None of the information contained in this document constitutes an offer to sell or the solicitation of an offer to buy any security or other investment or an offer to provide investment services of any kind. As such, advisors and their clients should not act on any recommendation (express or implied) or information in this report without obtaining specific advice in relation to their accounts and should not rely on information herein as the primary basis for their investment decisions. Information contained herein is based on data obtained from recognized statistical services, issuer reports or communications, or other sources, believed to be reliable. SIACharts Inc. nor its third party content providers make any representations or warranties or take any responsibility as to the accuracy or completeness of any recommendation or information contained herein and shall not be liable for any errors, inaccuracies or delays in content, or for any actions taken in reliance thereon. Any statements nonfactual in nature constitute only current opinions, which are subject to change without notice.