


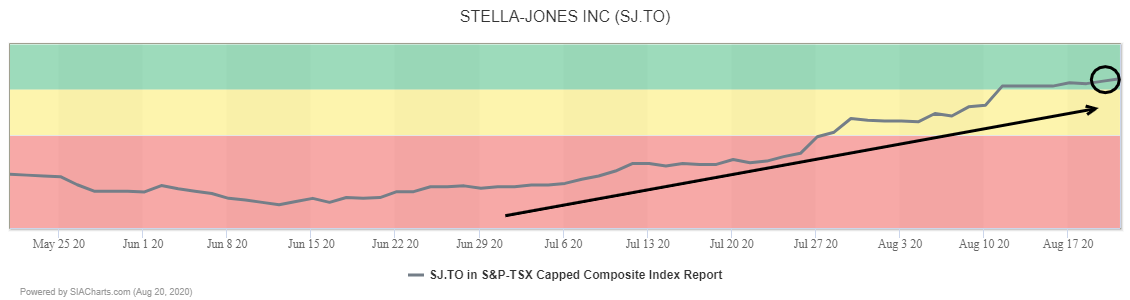
Stella Jones Inc. which produces, markets, and sells pressure treated wood products in Canada and the United States, has enjoyed the upside momentum the rest of the lumber space has seen, Currently up in the daily, weekly, monthly and quarterly rankings, SJ.TO now sits within the green favored zones 44th spot of the SIA S&P/TSX Capped Composite Index Report.
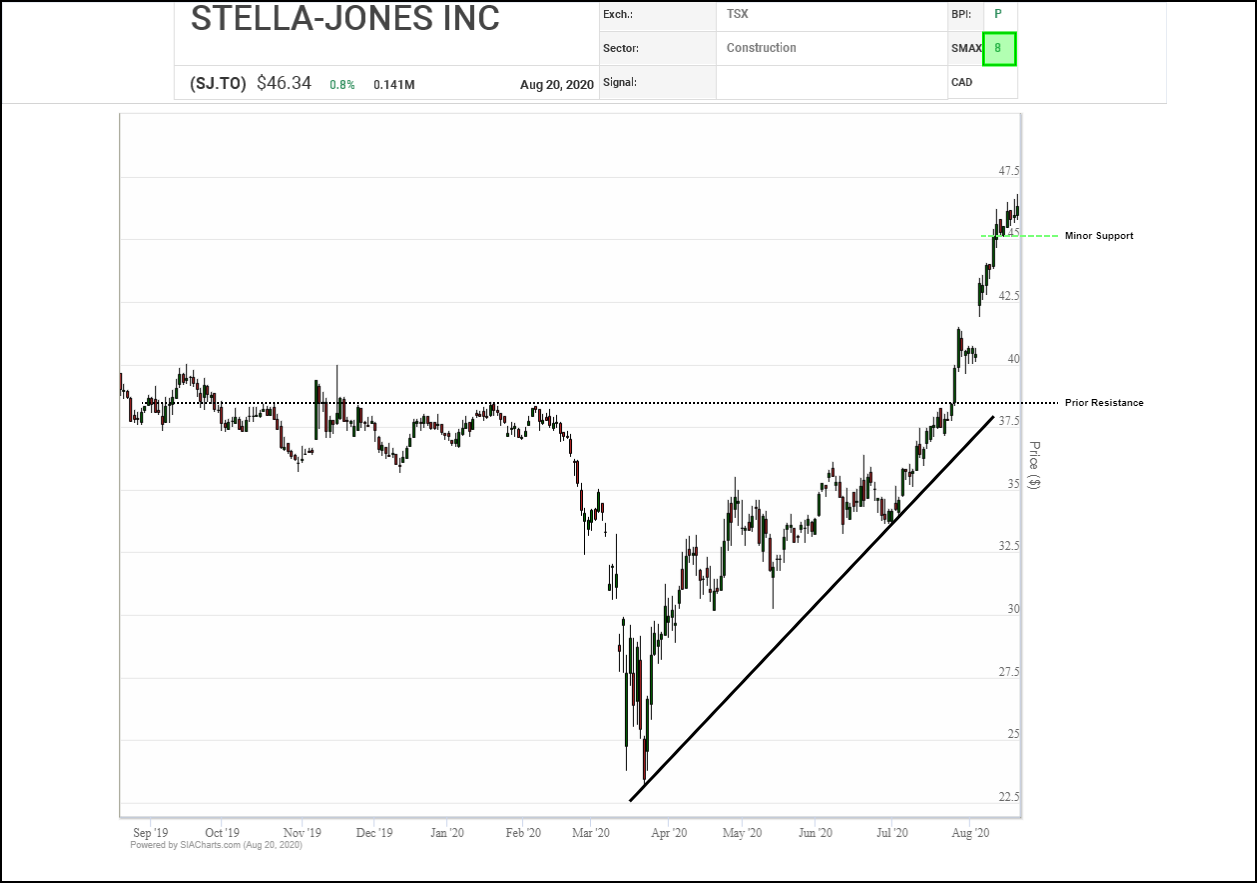
On July 27th, 2020, Stella Jones moved through prior resistance around $38 with conviction. After breaking this resistance SJ.TO consolidated for a few days before gapping higher on Wednesday August 5th due to an earnings report of 1.02 on an estimate of 0.74. If we are to see any kind of selling pressure in the near term, watch for potential minor support which appears near the $45 round number.
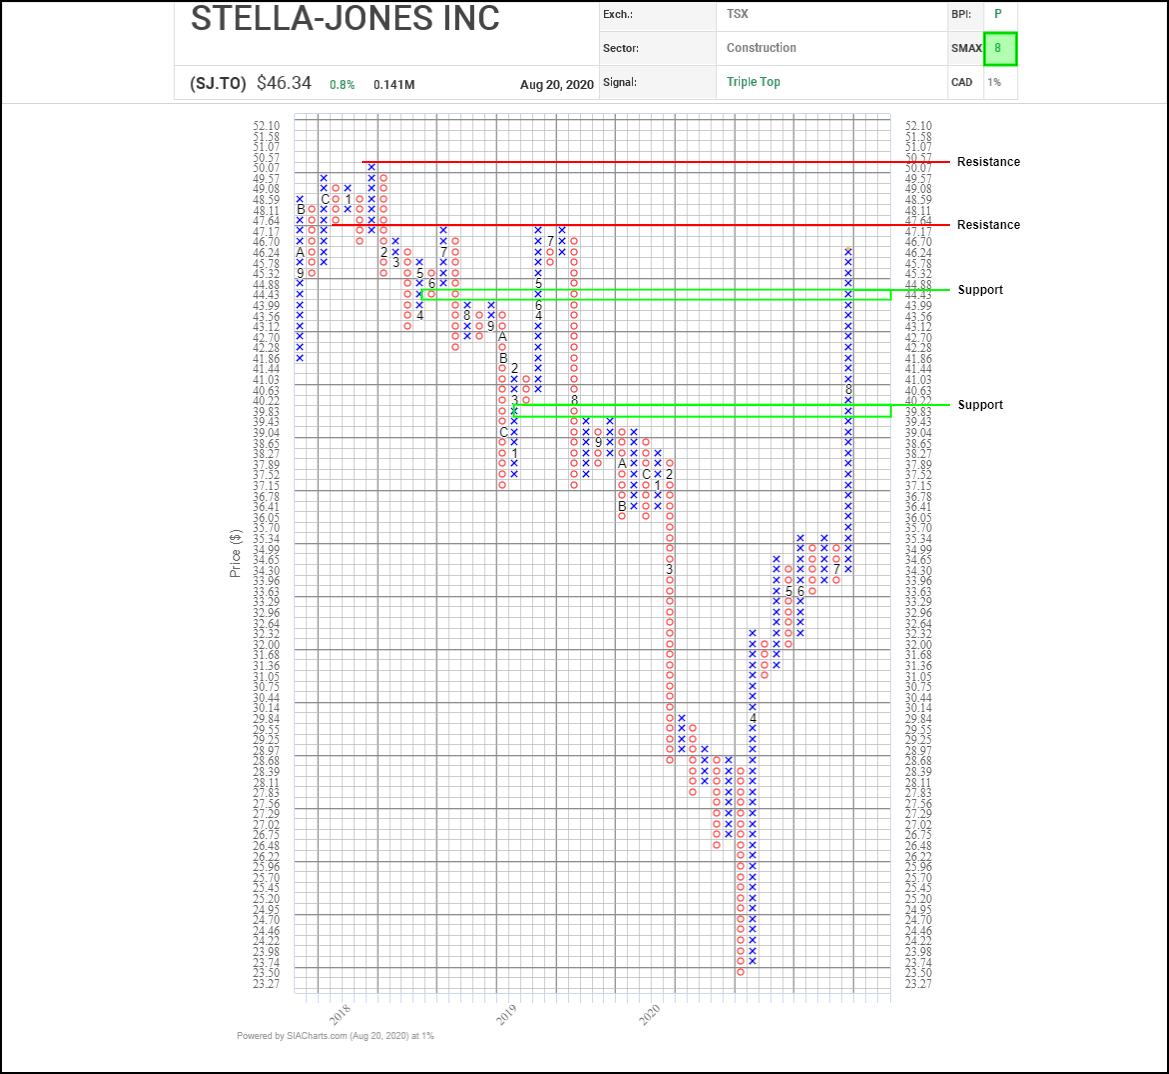
Clearing numerous points of potential resistance, Stella Jones (SJ.TO) has accelerated higher. Watch for next potential resistance at $47.64, and if that does not seem to be a barrier to this current trend, watch for resistance next around the $50 round number. If instead any broader market instability is to creep in as we move into September and downside selling pressure presents itself, watch for initial support between $44 and $44.50, after that look for support down in the $39.50-$40 range.
With its bullish SMAX Score of 8, SJ.TO is exhibiting near-term strength across the asset classes.
Disclaimer: SIACharts Inc. specifically represents that it does not give investment advice or advocate the purchase or sale of any security or investment whatsoever. This information has been prepared without regard to any particular investors investment objectives, financial situation, and needs. None of the information contained in this document constitutes an offer to sell or the solicitation of an offer to buy any security or other investment or an offer to provide investment services of any kind. As such, advisors and their clients should not act on any recommendation (express or implied) or information in this report without obtaining specific advice in relation to their accounts and should not rely on information herein as the primary basis for their investment decisions. Information contained herein is based on data obtained from recognized statistical services, issuer reports or communications, or other sources, believed to be reliable. SIACharts Inc. nor its third party content providers make any representations or warranties or take any responsibility as to the accuracy or completeness of any recommendation or information contained herein and shall not be liable for any errors, inaccuracies or delays in content, or for any actions taken in reliance thereon. Any statements nonfactual in nature constitute only current opinions, which are subject to change without notice.