Here are the signals we are watching in the bond and equity markets, as a U-shaped economic recovery becomes increasingly possible.
by Jim McDonald, Chief Investment Strategist, Northern Trust
We have written about the key market signals we are monitoring to assess the effectiveness of the monetary, fiscal and health policy responses to the COVID-19 virus. We are seeing some progress on the monetary and health policy front, while fiscal support has yet to contribute much beyond an important psychological support.
Rapid and forceful action by global central banks, aimed at bolstering financial conditions through improved market liquidity, has started to have an impact. In this report, we review the state of liquidity in corporate bond markets, and the outlook for the impact of “fallen angels” on the prospects for high yield bonds. Looking toward the equity markets, we have seen similar factor performance to that experienced during the last bear market with quality and low volatility stocks performing best. As the recession unfolds, history suggests that value stocks should start to stand out. Fiscal policy initiatives are being rolled out globally, but sufficiency of scope and effectiveness remain unknown. Discussion of a fourth spending package in the U.S. touches on the potential need for further support for areas like state and local governments. On the health policy front, the most significant development has been the passage of time and the maturation of case levels across some countries (most importantly Italy). The next two to three weeks could lead to a peak in new cases across the U.S. (broadly in line with our expectations), but the focus is increasingly on health policy — even after the number of new cases eventually peaks. Our view is that there is unlikely to be a “silver bullet” therapeutic or vaccine over the next 6 to12 months, so health policy makers will rely on social distancing and other mitigation strategies to manage the ongoing risk. This bolsters the case for a “U-shaped” recovery as the developed world economies slowly come back on line in coming months.
FIXED INCOME SIGNALS: SLOWER GROWTH, ILLIQUIDITY AND CREDIT DETERIORATION
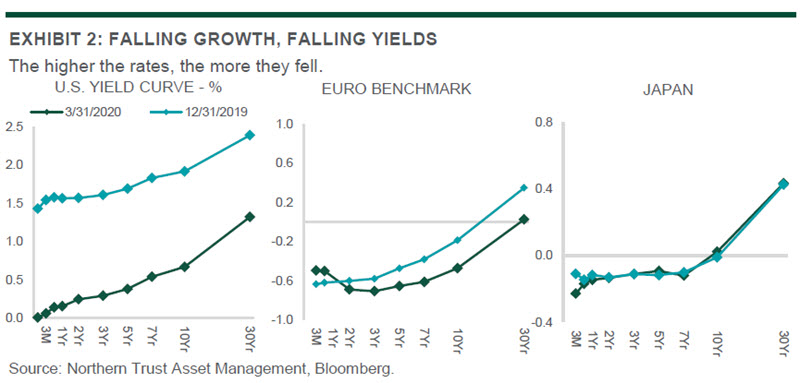
While interest rate markets have been choppy — pulled by the opposing forces of insufficient liquidity and degrading fundamentals — the general direction has been downward. This has been seen most in the U.S., where yields across the entire yield curve have shifted lower, reflecting a much more subdued growth and inflation outlook. We believe the lower growth and inflation trajectory, combined with ongoing concerns over liquidity, will keep the Federal Reserve at its zero interest rate policy positioning for at least the next couple years.
Economic activity may start to generate traction towards the end of this year, but policy makers will be hesitant to prematurely raise rates. Their patience will be driven by lessons learned during the Great Depression (where rates were increased too quickly) and in accordance with the global financial crisis playbook (where zero interest rate policy remained in place for seven years). While we believe the Fed will not raise rates any time soon, the likelihood of negative rates is also very low. Fed Chair Jerome Powell has stated on numerous occasions that negative interest rates are not the right policy prescription for the U.S. economy, despite negative rates being deployed elsewhere in the world. However, that will not — and has not — stopped rates (notably those in the 1- to 3-month maturity portion of the curve) from briefly going negative due to market forces — specifically demand overwhelming supply as market participants rush to safety, even if it means realizing a negative return in the process.
The U.S. yield curve — starting from a higher rate starting point — has seen the quickest and most dramatic reduction in interest rates while Europe has also seen some shift downward. However, given that its curve was already in negative territory out to the 10-year tenor at the beginning of the year, the move downward has been less pronounced. Meanwhile, Japan has seen barely any movement in its yield curve as a result of its yield curve control policies — something that other major markets may explore. A review of the yield curves across the major markets, comparing the beginning of 2020 to current levels, can be found in Exhibit 2 below.
Some question how long U.S. interest rates will remain subdued, as the 10-year Treasury yield at 0.60% is near the all-time low. Their argument posits that easy money combined with fiscal stimulus is the perfect recipe for increased demand and higher inflation, which would push interest rates higher to accommodate that higher inflation and provide investors an adequate after-inflation yield. But that stimulus is “only” 10% of the size of the U.S. economy, whereas the amount of demand destruction we are seeing as a result of stay-at-home policies is significant — possibly 30% of gross domestic product. That said, a second major stimulus package, including infrastructure spending along with a shift in company policies from efficiency (e.g. just-in-time inventory) to resiliency (e.g. diversified supply chains) could eventually mark the end of the Stuckflation environment. This will be a key debate in our annual Capital Market Assumptions discussions, which start later this quarter. For now, inflation expectations are very contained and this risk remains one of a longer-term nature.
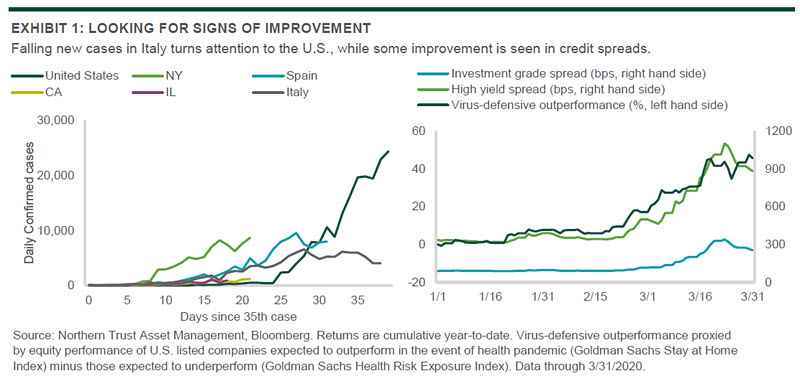
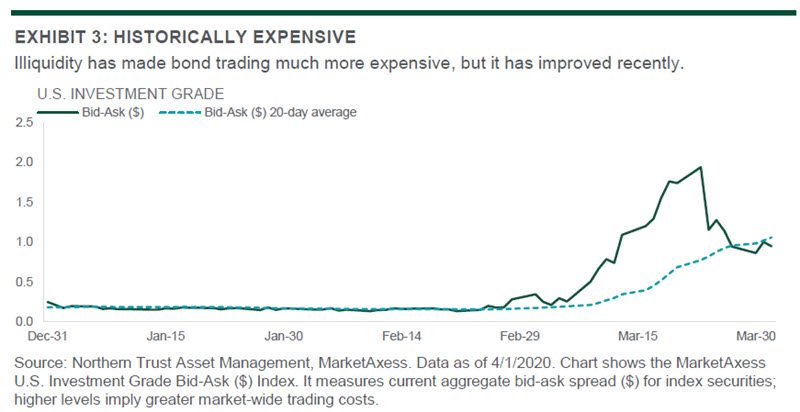
During times of stress, market liquidity is always a source of concern for investors — and this time is no different. Bid-ask spreads (found in Exhibit 3) give a direct observation on market illiquidity. As seen in Exhibit 3, the bid-ask spread on investment grade bonds has historically been $0.20. During the recent financial turmoil, that spread ballooned to as great as $1.94. Thanks to a new round of quantitative easing and Fed liquidity programs — some reinstated from the financial crisis and some entirely new, such as the ability to buy investment grade corporate bonds both on the primary and secondary market — that spread has declined to $0.96. This is still far wide of “normal” times but it is encouraging that the Fed initiatives are beginning to have an effect. In response, investment grade and high yield credit spreads (seen back in Exhibit 1) have started to retreat from recent highs. We estimate that around 70% of the spike in spreads is due to illiquidity factors with the other 30% being deteriorating fundamentals — so, as liquidity continues to improve, we would expect spreads to maintain approximately 30% of the recent spike. However, getting back to these levels will likely take some time as Fed programs gain acceptance and traders navigate through work-from-home complications.
HOW ABOUT THE PROSPECTS FOR HIGH YIELD?
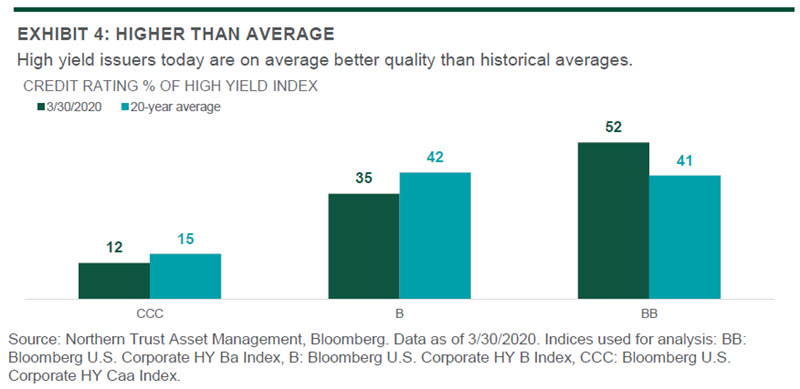
We believe high yield as an asset class looks particularly attractive in the current environment. From a historical perspective, using the global financial crisis (post-Lehman bankruptcy) as our benchmark, we saw high yield suffer 52% of the U.S. equity market drawdown (-23.2% vs. -44.8%) and gain 90% of the following 12-month upswing (63.5% vs. 70.3%). The overall result — combining the drawdown and next-12-month period data displayed above — was a 27.0% return for high yield versus a -2.2% return for U.S. equities. Today, we believe high yield is relatively well-positioned to weather an economic recession. First, from a credit rating perspective, high yield is of above-average quality. As seen in Exhibit 4 on the following page, BB-rated securities (the highest quality high yield credit rating) represent 52% of the index versus a 20-year average of 41%. Second, those companies within high yield have done an excellent job in balance sheet management, including pushing out maturities of debt owed and maintaining strong liquidity. There will, of course, be an increase in defaults as a result of the likely upcoming recession — from 4.5% to an expected 9% — but there will be some concentration in the energy sector and we believe current spreads are more than accounting for this default uptick.
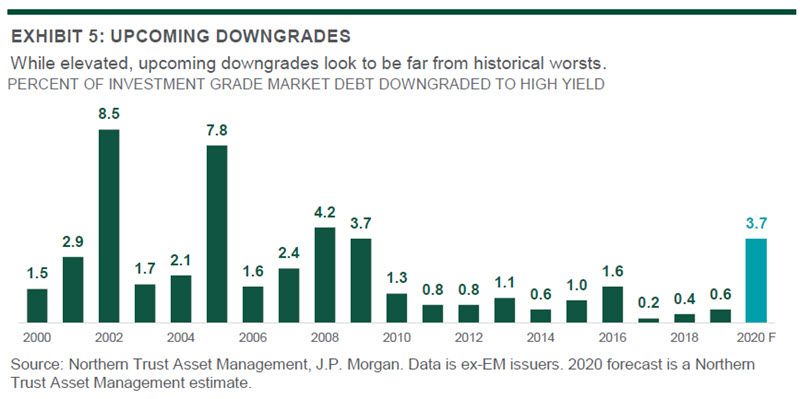
Many investors are concerned about the risk of “fallen angels” — those securities that fall in credit rating from BBB (investment grade) to BB or lower (high yield) — and whether the high yield market can absorb them. We anticipate that approximately 3.7% of the investment grade universe will be downgraded to high yield this year (see Exhibit 5). While this is elevated as compared with the prior 10 years, it is similar to what was experienced in 2008-2009 and far below what was experienced during the height of the dotcom bust from 2000 to 2002. We believe the high yield market will be able to absorb this new supply. And, in fact, the last instance of elevated fallen angel activity (1.6% during the 2016 energy crisis) led to notable outperformance of the fallen angel index versus the broader high yield market (8.5%). Prior occasions of increased fallen angel activity have also led to fallen angel index outperformance.
QUANTITATIVE FACTORS IN TIMES OF VOLATILITY
What signals can we glean from the equity markets about the state of policy and its expected impact on the economic and financial market outlook? One measure is the performance of those stocks viewed as virus-defensive names versus those most exposed to the negative impact of the virus. As shown in Exhibit 1, the virus-defensive names outperformed from mid-January until mid-March, and have roughly treaded water since. So this remains one signal about how investors view the outlook for risk taking.
Another set of measures we are watching are the quantitative factors such as size, value, momentum, low volatility, yield and quality. Since the market peak on February 19, the quality and low volatility factors have been clear stand-outs as investors rushed for defensive positioning. Portfolios tilted toward these factors have outperformed their benchmarks by hundreds of basis points in some cases. Momentum was also strong across all major markets but size, value and dividend yield have lagged. This pattern of returns is typical of a market shock and is the mirror image of what we saw in the last major drawdown of December 2018.
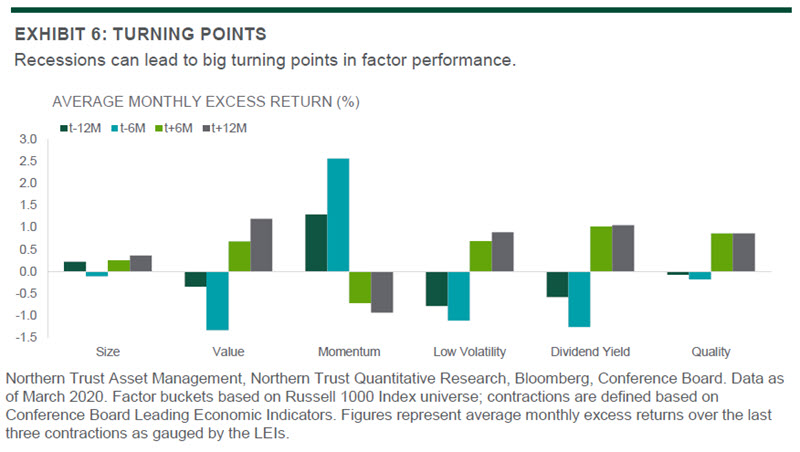
However, as markets settle and the macroeconomic implications of the coronavirus set in, rising recession probabilities may alter this pattern. Exhibit 6 analyzes the average performance of factors before and after the last three U.S. recessions. Six months into a contraction most factors are going strong with defensives like quality, yield and low volatility being favored. However, a year into the contraction value takes the lead and has, at least historically, proven to be the dominant factor. Given valuation spreads are near all-time highs, we feel the combined macro and valuation story paint a bright picture for the value factor.
COVID-19 UPDATE: OUTLOOK FOR THERAPEUTICS
We are monitoring three categories of potential therapeutic and preventative products in development for COVID-19: small molecules, antibodies and vaccines. A summary of potential solutions is provided in Exhibit 7 below, with further discussion in the paragraphs below that. Overall, we believe there is over-optimism about the possibility of a treatment or vaccine becoming available over the next 12 to 18 months. Instead, we believe that over the next 12 to 18 months, public health measures are more likely to curtail the breakout than a drug or vaccine.
We believe Gilead’s Remdesivir has one of the highest probabilities of success among the drugs we are monitoring, based on early and limited information. However, we would only assign a 30% chance the drug demonstrates a statistically significant efficacy benefit compared to a placebo in a well-designed trial, sufficient for U.S. Food and Drug Administration (FDA) approval. Qualitatively, we would equate this to a “reasonable” chance of success. Remdesivir was originally developed for Ebola, but was abandoned, which highlights the difficulty in assigning probabilities even when there is a rational intent. Importantly, Remdesivir is not an oral pill, but would be delivered intravenously, so it would only be an option for hospitalized patients, not as a widely used preventative. Early clinical data could be available as soon as April.

Generic hydroxychloroquine is an oral drug that has been built up as a possible COVID-19 treatment. The optimism is based on small clinical studies, but those trials were small and not well-controlled. We would place a lower (10-30%) probability of success on this approach. Furthermore, there are potential toxicities associated with the drug that could limit its use. The FDA has granted emergency authorization to use the drug for COVID-19 patients because it is a life-threatening infection. It is possible that ongoing small trials show hints of efficacy, which could lead to widespread usage in the absence of a full approval process.
Biopharma companies including Roche, Alexion and Regeneron are investigating antibodies for COVID-19, of which there are two types. The first would be used to reduce the inflammation caused by the disease, which could help to stabilize severe patients, but would unlikely be curative. The other type can be collected from humans who have already been infected and who have developed antibodies against the virus, or it can be made in genetically engineered mice. We believe there is a reasonable chance for an antibody therapy to demonstrate some benefit, (~30%), but is unlikely to be a cure.
Many companies are developing vaccines including Johnson & Johnson, Sanofi, GlaxoSmithKline, Moderna and others. We believe these companies have a reasonable chance at eventually developing an efficacious vaccine. However, we believe it could take longer than 12 to 18 months for regulatory licensure. As a preventative treatment, there is a higher bar for safety, and long duration studies are normally required. There are also significant challenges in demonstrating efficacy and in manufacturing. As an example, Merck launched its vaccine for Ebola in 2019, which was five years after the disease breakout in 2014.
A final point is that we do not see any of these products as financial blockbusters, and we would not chase any of these stocks based on a potential treatment or vaccine for COVID-19. Many of these stocks have already outperformed based on a potential COVID-19 product and much optimism is already baked in. We believe most if not all of these companies are unlikely to attempt to earn a high margin on a COVID-19 product, given the humanitarian nature of the goal and the political blowback they would receive. We are positive on several of these companies mentioned above, but we would not own them based on COVID-19 alone.
CONCLUSION: PATIENTLY WAITING FOR THE RECOVERY
The decline in risk asset values this year has been extraordinarily rapid, but the eventual rebound will likely be slower paced. The average bear market has taken twice as long as the downturn to regain its losses, but these averages disguise quite a bit of variation. We are only starting to see the impact of social distancing come through the U.S. labor markets (with just two weeks of surging unemployment claims), so we should be prepared for months of dour economic reports. While a breakthrough development on diagnostics or treatment could accelerate the rebound, the more likely scenario will entail continued public health efforts like social distancing to manage the risk.
The markets will be forward looking during the coming months of poor economic data, hence our focus on market signals on the pace of repair. Fixed income liquidity is slowly improving, but is far from back to normal. Equity market liquidity, while less discussed, has certainly contributed to the historic levels of volatility we have been experiencing. Volatility should moderate somewhat from here, as significant portfolio repositioning has likely taken place within systematic investors such as risk parity and low volatility strategies, and commodity trading advisors (CTAs). The investment strategy team has been meeting regularly during these volatile times, and our Investment Policy Committee meets next week. With major equity indexes down 25% year to date, and credit spreads elevated beyond what we believe fundamentals justify, we have remained moderately overweight risk in our global policy model. What the markets may need most at this point is time — time for any remaining portfolio repositioning to take place, and time for fiscal and health policies to have their impact on the real economy and financial markets.
Special thanks to Tom O’Shea and Colin Cheesman, Investment Analysts, for data research.
© 2020 Northern Trust Corporation. Head Office: 50 South La Salle Street, Chicago, Illinois 60603 U.S.A.
IMPORTANT INFORMATION. For Asia-Pacific markets, this information is directed to institutional, professional and wholesale clients or investors only and should not be relied upon by retail clients or investors. The information is not intended for distribution or use by any person in any jurisdiction where such distribution would be contrary to local law or regulation. Northern Trust and its affiliates may have positions in and may effect transactions in the markets, contracts and related investments different than described in this information. This information is obtained from sources believed to be reliable, and its accuracy and completeness are not guaranteed. Information does not constitute a recommendation of any investment strategy, is not intended as investment advice and does not take into account all the circumstances of each investor. Opinions and forecasts discussed are those of the author, do not necessarily reflect the views of Northern Trust and are subject to change without notice.
This report is provided for informational purposes only and is not intended to be, and should not be construed as, an offer, solicitation or recommendation with respect to any transaction and should not be treated as legal advice, investment advice or tax advice. Recipients should not rely upon this information as a substitute for obtaining specific legal or tax advice from their own professional legal or tax advisors. Information is subject to change based on market or other conditions.
Past performance is no guarantee of future results. Performance returns and the principal value of an investment will fluctuate. Performance returns contained herein are subject to revision by Northern Trust. Comparative indices shown are provided as an indication of the performance of a particular segment of the capital markets and/or alternative strategies in general. Index performance returns do not reflect any management fees, transaction costs or expenses. It is not possible to invest directly in any index. Gross performance returns contained herein include reinvestment of dividends and other earnings, transaction costs, and all fees and expenses other than investment management fees, unless indicated otherwise.
Northern Trust Asset Management is composed of Northern Trust Investments, Inc. Northern Trust Global Investments Limited, Northern Trust Fund Managers (Ireland) Limited, Northern Trust Global Investments Japan, K.K, NT Global Advisors Inc., 50 South Capital Advisors, LLC and investment personnel of The Northern Trust Company of Hong Kong Limited, and The Northern Trust Company.
Copyright © Northern Trust


