by Jason Ayres, Option Matters
Canadian investors continue to watch both domestic and global economic data closely as fears of a recession loom.
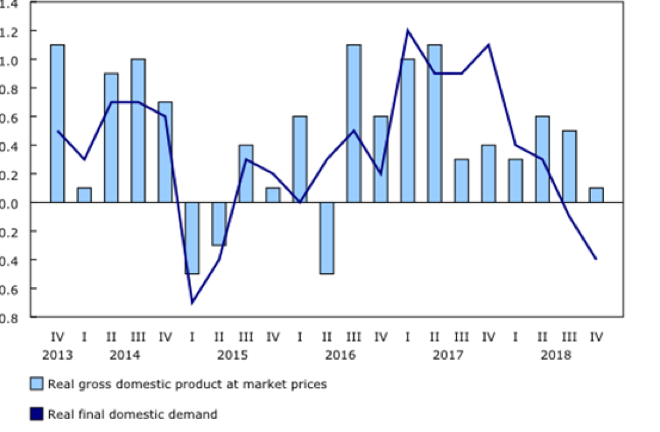
According to Statistics Canada in their March 1st , 2019 release “Growth in real gross domestic product (GDP) slowed to 0.1% in the fourth quarter, the slowest pace since the second quarter of 2016” See Chart 1: Gross domestic product and final domestic demand.
Chart 1: Gross domestic product and final domestic demand

Source: Statistics Canada
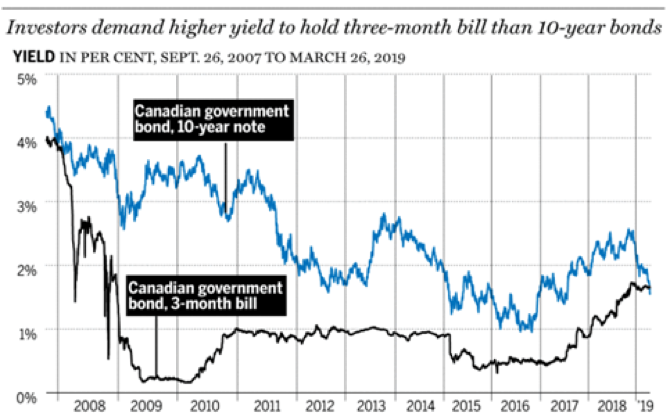
In addition to news on a slowing economy, a “yield curve inversion” in both Canadian and U.S. bond markets at the end of March 2019 added to the concern. See Chart 2: Yield Curve Inversion.
Chart 2: Yield Curve Inversion

Source: Financial Post/Bloomberg
Why does an inverted yield curve matter?
When investors see less opportunity in the stock market for the foreseeable future, they will move into longer-term bonds and are willing to accept a lower yield for a safer investment. As more investors buy longer-term bonds, the bond price rises and the yield shrinks. When a long-term bond pays (yields) less than a short-term bond, the yield curve has ‘inverted’. This inversion is seen to reflect investors’ lack of confidence in the economy and, historically, has preceded a recession. Since this hasn’t happened since 2007, one can understand the concern.
Is all as bad as it seems?
Many of our top bankers are suggesting that while a slowdown is likely, there are signs of strength, as quoted in the Financial Post referencing National Banks CEO Louis Vachon, as well as in the Toronto Star referencing Bank of Montreal head Darryl White.
In addition, one cannot underestimate the power of the Central Bankers (Bank of Canada & U.S. Federal Reserve) and their ability to influence the direction of the economy through their accommodative interest rate policies.
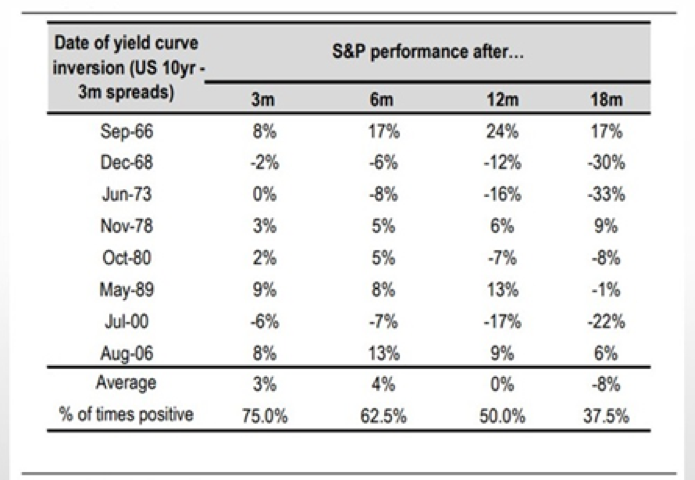
Further to that, statistically, stock markets have delivered gains post “yield curve inversion” as far out as 12-18 months. As referenced in Chart 3: S&P 500 Performance Post Yield Curve Inversion.
Chart 3: S&P 500 Performance Post Yield Curve Inversion

Source: Credit Suisse Global Equity Strategy
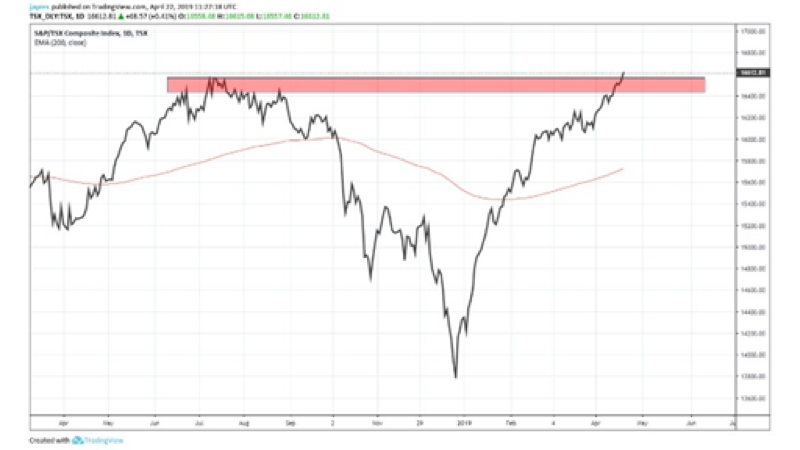
And with the S&P/TSX composite now testing and exceeding historical highs, having completely reclaimed the losses of Q4 2018 many investors have been lulled into a sense of complacency. See chart 4: S&P/TSX Composite
Chart 4: S&P/TSX Composite April 22, 2019

Source: www.tradingview.com
Trying to make sense of the reams of economic data can be a challenge for professional money managers so it’s no surprise that self-directed investors find navigating these markets daunting.
There’s an old saying that the stock market climbs a wall of worry, and it’s important for investors to avoid the complacency which often goes hand in hand with an up-trend in stock prices.
Here’s what we know:
- Economic data suggests a slowdown in the economy
- A yield curve inversion has been a good predictor of recessions historically
- Statistics show moderate growth up to 18 months after the inversion
- Central Banks can change market dynamics with interest rate policy
- There may be an underlying event/indicator yet to surface…surprise!
All of this suggests uncertainty. While the trend is our friend, we can’t lose sight that this can change very quickly as demonstrated in the 4th quarter of 2018.
Hope for the best, but prepare for the worst?
With the markets still trending higher, now is the time to prepare for the possibility of a more challenging market environment in which volatile price swings and prolonged sideways to down trending stock prices may be the norm.
Since no-one can predict when a market may change direction, there are several option strategies that can help protect and preserve capital as well as profit in such uncertainty.
- Hedging strategies such as the Protective put or Collar are ideal for locking in profits and entering into new positions with a limited risk exposure.
- A Long Call as a bullish stock replacement strategy allows for participation in the upside with a limited amount of capital and identifiable risk.
- For sideways markets, Credit Spreads such as the Bear Call Credit Spread and Bull Put Credit Spread can generate cash flow with a limited risk.
- For a down-trending markets, a Long Put as a short stock replacement strategy offers the bearish investor a strategy for profiting in a sell-off with a limited amount of capital and identifiable risk exposure.
While there are many more options strategies to consider, understanding how and when to apply the ones mentioned above can help an investor manage through and even profit leading into and during a recession.
Disclaimer:
The strategies presented in this blog are for information and training purposes only and should not be interpreted as recommendations to buy or sell any security. As always, you should ensure that you are comfortable with the proposed scenarios and ready to assume all the risks before implementing an option strategy.
This post was originally published at the Option Matters blog.


