Playing Smart Defense
By Alfred Lee, CFA, CMT, DMS, BMO Global Asset Management
In this report, we highlight our strategic and tactical portfolio positioning strategies for the first quarter using various BMO Exchange Traded Funds (BMO ETFs). Our key strategy changes are outlined throughout the report and in our quarterly outlook on page six.
• Volatility returned with significance in the fourth quarter of 2018, despite U.S. economic data remaining relatively strong. Although the U.S. economy continues to be robust, adding an impressive 312,000 jobs in December, markets were more concerned by recent downward revisions in global growth projections and an increasing spotlight on headline risk, which was a major detractor of asset prices.
• The primary focus continues to be the potential impact of a U.S.-China trade war and ongoing “Brexit” related anxieties. In our view, there is heightened sensitivity to these ongoing issues and their impact on the markets, given we are a decade removed from the Great Recession. Some investors will likely use the rally to reduce their exposure to higher beta themes under the belief we are already late in the economic cycle, instead of waiting for a resolution to macro-economic uncertainties.
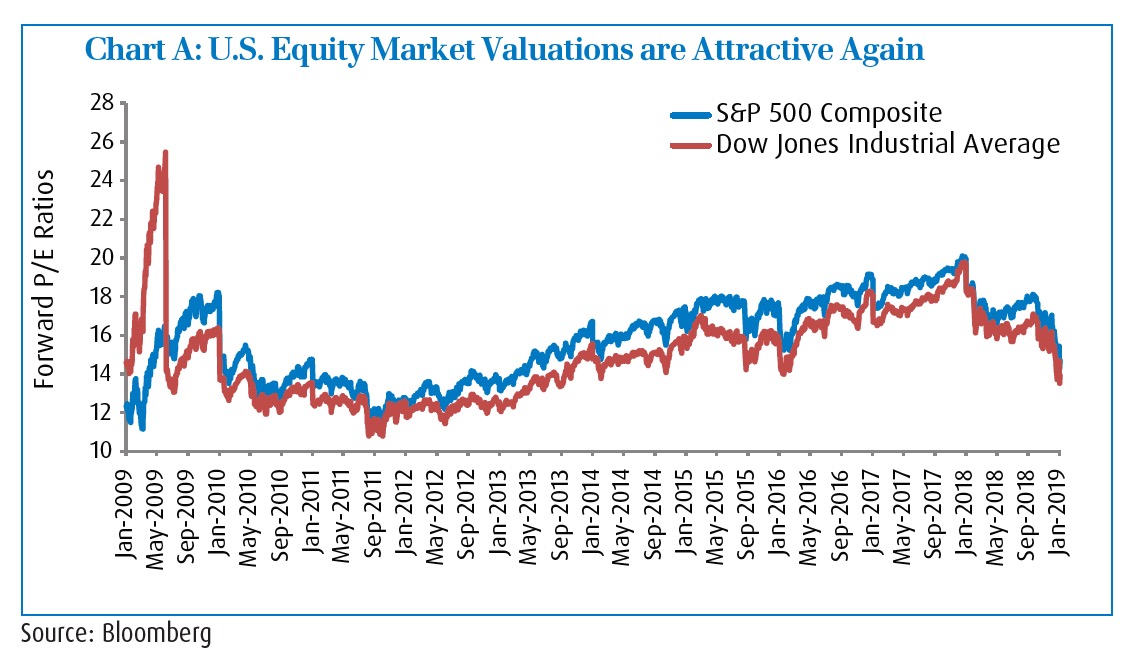
• Stock market valuations, particularly in the U.S., are starting to look attractive given the fourth-quarter sell-off in risk assets. Between October and December, the S&P 500 Composite (“SPX”) and the Dow Jones Industrial Average (“DJIA”) were down -13.5% and -11.3%, in local terms, leading to forward price-to-earnings (P/E) ratios of 14.7x and 13.9x, respectively. This trend back towards more favourable P/E levels allows for potential price multiple expansion in the future, even if we experience earnings fatigue, as many investors are anticipating.
• In light of higher volatility, we are concerned investors will be apprehensive about risk-taking going forward. While less turbulence and a renewed emphasis on strong fundamentals are likely by the end of the first quarter, caution is necessary when markets become nervous about the durability of a prolonged bull market. Consequently, we favour defensive growth areas in a portfolio.
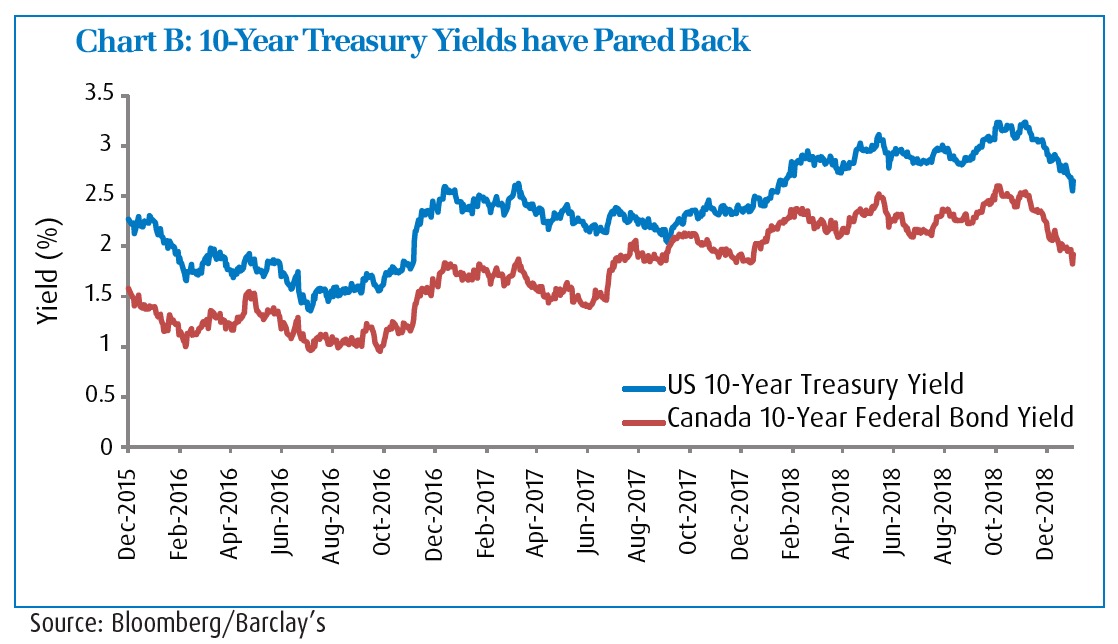
• The recent repricing in U.S. Treasury yields may represent an overly dovish outlook on interest rates (Chart B). Consensus expectations on monetary policy – far too hawkish at the end of last summer – have now swung in the opposite direction. Interest rate futures indicate a mere 17.8% probability of a rate hike by the U.S. Federal Reserve (“Fed”) this year, marking a slower-than-anticipated pace towards higher rates, which is constructive for risk assets in the near-term.
• U.S. high-yield credit spreads have widened to 440bps above U.S. treasuries. Historically, this spread gets as tight as 290 basis points (bps), which is where it was approximately a year ago. The outsize gap indicates spread compression opportunities over the near-term, as market volatility dissipates and credit spreads revert to the mean. Over the longer-term, however, we prefer higher-quality fixed income (and fixed income like securities) over the more speculative nature of non-investment grade bonds.
Things to Keep an Eye on...
In the fourth quarter, we saw a notable uptick in equity market volatility. Surprisingly, implied volatility increased most sharply for U.S. stocks1, despite the U.S. having the most-sound economic backdrop of its peer group. Meanwhile, emerging market (EM) equities, which has historically been the most unstable asset class during times of distress, experienced the smallest change in price fluctuations. However, we don’t anticipate this relationship will last, as EM assets were essentially priced to perfection leading up to the final quarter of 2018.
Recommendation: The recent rise of volatility in the U.S. equity market now offers enticing opportunities for investors seeking to harness uncertainty in this environment. As we believe the underlying macro- economic factors south of the border remain robust, Covered Call ETFs may be an alternative way for investors to access equities with additional yield.
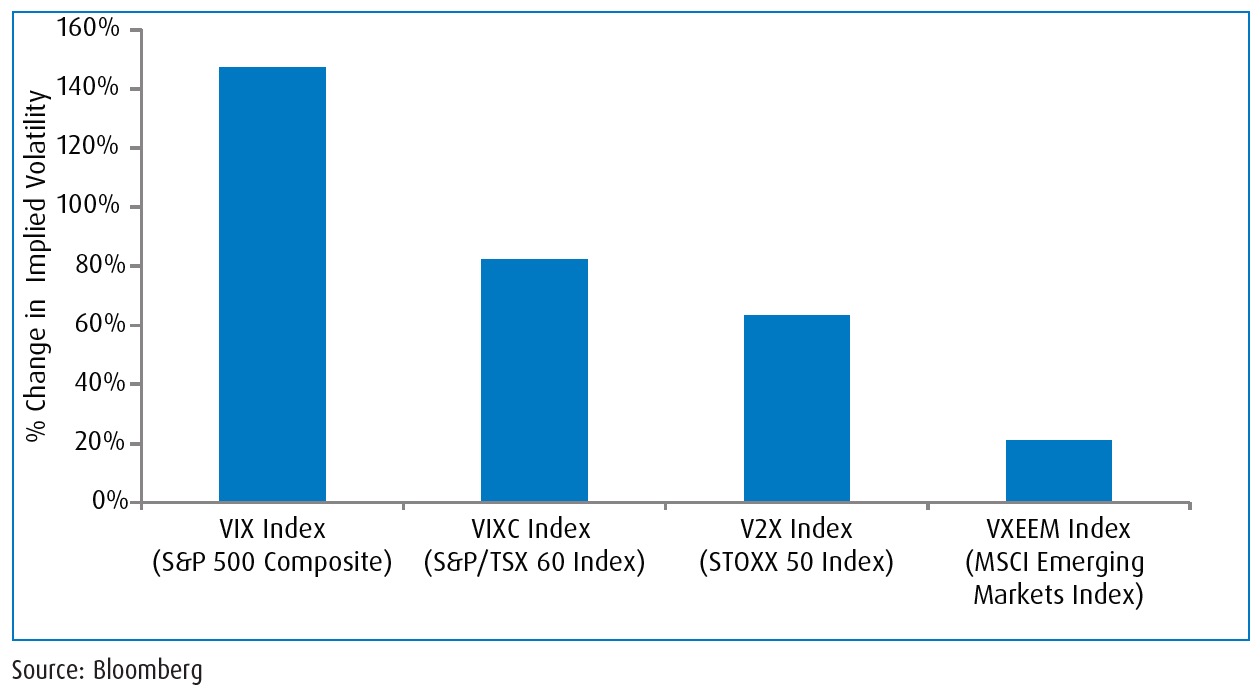 1 As indicated by the CBOE S&P 500 Volatility Index – “VIX”.
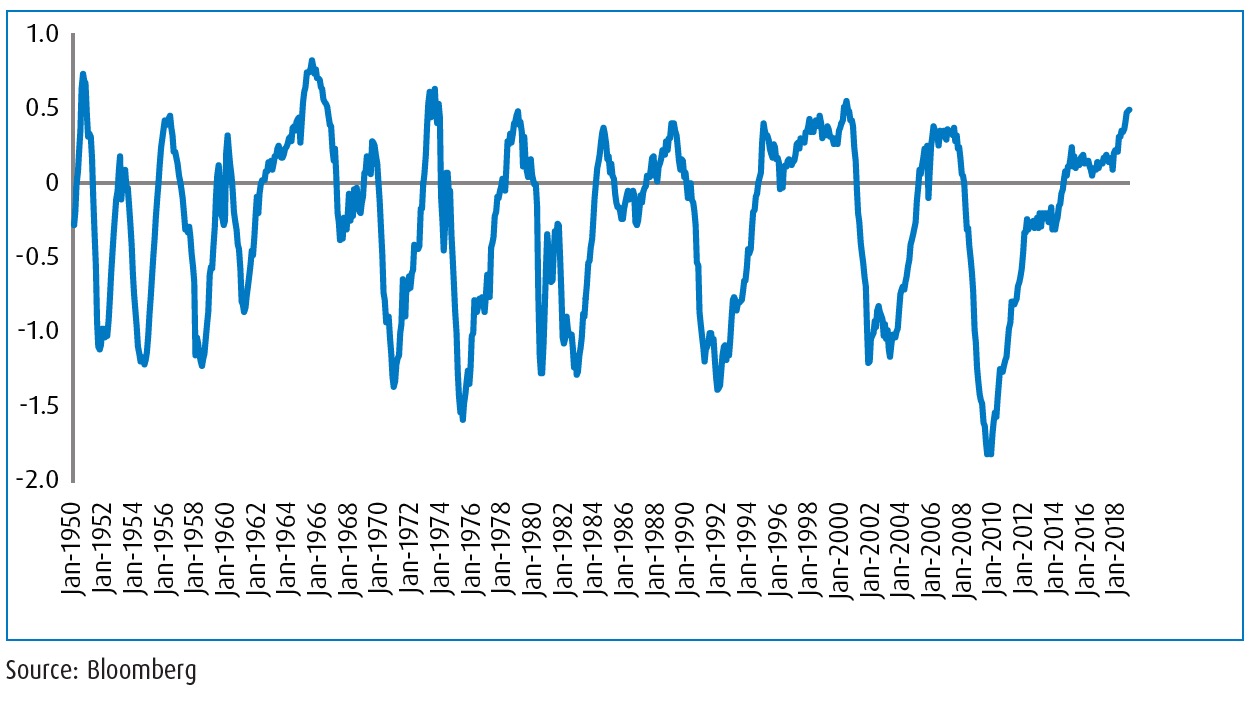
Assessing where we are in the business cycle is always much easier to do in hindsight. However, indicators such as the Morgan Stanley U.S. Cycle Index help us determine which of the four phases we are in currently: expansion, peak, contraction or trough. The latest reading of 0.49 for this index has never been significantly eclipsed, suggesting we are at, or very near, the peak. The greater question is how long we can sustain such elevated levels before experiencing a contraction.
Recommendation: Even under our belief that we are in a late equity cycle, the recent sharp price corrections are inconsistent with the broader collection of encouraging economic data. In fact, the market’s sudden aversion to risk assets seems more closely related to headlines than fundamentals. As these issues resolve, we believe exposure to low- volatility strategies, such as the BMO Low Volatility Canadian Equity ETF (ZLB) and the BMO Low Volatility U.S. Equity ETF (ZLU), is a prudent way for investors to obtain defensive growth characteristics in a portfolio.
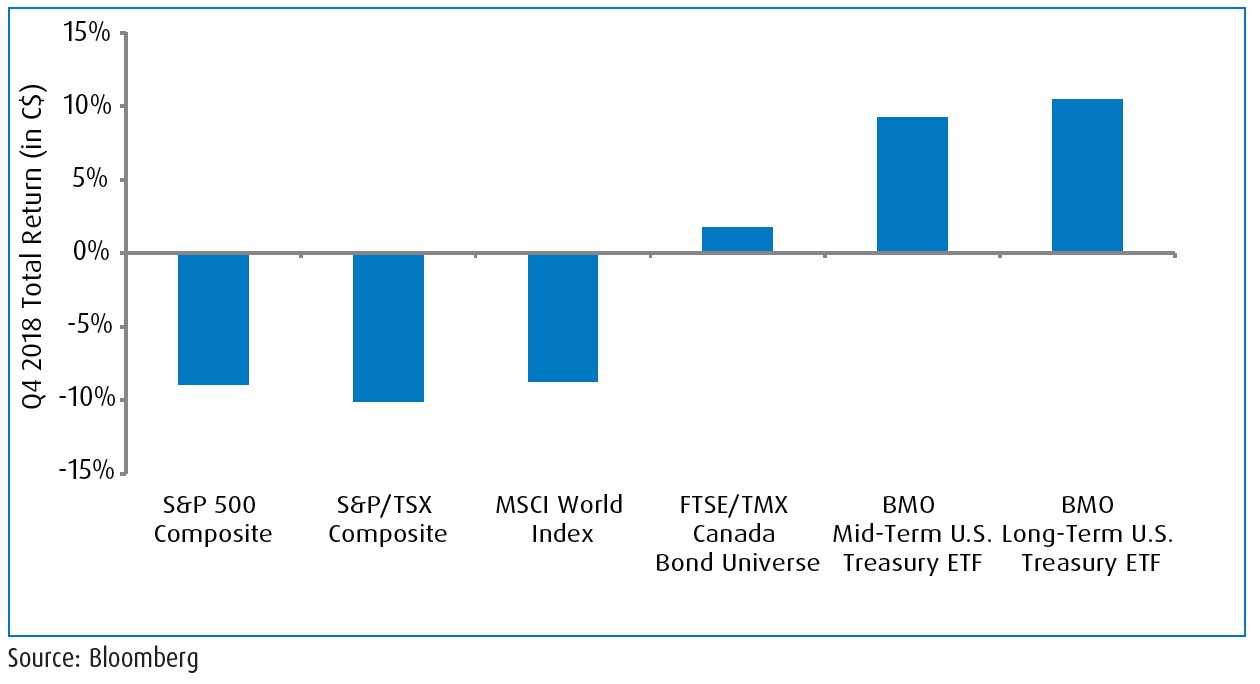
As an asset class, U.S. Treasuries tend to be underutilized by Canadian investors. Owing to their status as a safe haven, they have historically performed well in drawdowns. As an added benefit, they also provide exposure to the US dollar, which often retains value better than its Canadian counterpart during times of distress.
Recommendation: By decomposing U.S. treasuries by term, investors can better implement the degree of protection they need in a portfolio. The longer the term, the greater the negative correlation to equity risk. We currently prefer the mid-portion of the yield curve, as represented by the BMO Mid-Term U.S. Treasury Index ETF (ZTM), over the BMO Long Term U.S. Treasury Index ETF (ZTL), despite the latter’s ability to better stabilize a diversified portfolio. As interest rate expectations have moderated, we have already seen a fair degree of repricing with longer-term yields. As a result, ZTM continues to be our recommendation for portfolio protection.
Changes to Portfolio Strategy
Asset Allocation:
• Since the inception of this report in late June of 2012, our strategy has always favoured equities. However, the composition of our equity exposure has always favoured more defensive areas. This approach has served us well over the long term. In keeping with our preference for defense, we are now slightly increasing our weight to fixed income, a de-risking manoeuver we acknowledge is relatively early, given our expectation for asset prices to rebound in the first quarter of this year. However, our intent is to be more cautious in order to protect the strong performance or our strategy since inception. Additionally, our shift from equities to fixed income is only to the tune of 3.0% of the overall strategy.
Fixed Income:
• To partially offset equity market risk in our portfolio, we are adding a modest 3.0% position in the BMO Mid-Term U.S. Treasury Index ETF (ZTM). Although our strategy is already significantly less volatile than our benchmark, this adjustment should help provide further stability to our overall stance. As U.S. Treasuries and the U.S. dollar have traditionally provided strong negative correlation to risk assets in times of distress, these characteristics should make riding out any further price swings more bearable.
Equities:
• Several quarters ago, when valuations of the broader S&P 500 Composite had become stretched, we initiated a position towards the BMO MSCI USA Value Index ETF (ZVU) in our strategy. With the recent sell off, prices have become more attractive – we view this as a means of picking up blue chip companies “on the cheap.” To fund a shift to high-quality stocks, which are characterized as companies having high return-on-equity (ROE), stable earnings growth and low financial leverage, we are eliminating our 6.0% allocation in ZVU and replacing it with the BMO MSCI USA High Quality Index ETF (ZUQ). ZUQ, provides investors with an efficient way for investors to obtain access to high quality, blue chip U.S. stocks. Consumer demand for discretionary items may still be on the rise; however, we believe the world economy, particularly the U.S., has reached a peak state. To account for reduced global growth expectations, we are eliminating our 3.0% position in the BMO Global Consumer Discretionary Hedge to CAD Index ETF (DISC).
Alternatives/Hybrids:
• The Canadian preferred share market was one the most unfortunate recipients during the fourth quarter sell-off in risk assets. While credit spreads are wider and rate expectations have become less hawkish, the drawdown in Canadian preferred shares was also largely driven by market structure issues, in our view. Too many mandates in the industry experienced outflows simultaneously, creating undue pressure that was further exacerbated by retail investors taking advantage of year-end tax-loss harvesting. From a valuation standpoint, we are in agreement with many investors that this asset class is looking attractive. Consequently, we are choosing to maintain our position in the BMO Laddered Preferred Share Index ETF (ZPR).
The Good, the Bad, and the Ugly
Conclusion: Despite, a downward revision in global economic growth expectations, we believe the sell-off in risk-assets experienced in the fourth quarter is not reflective of the underlying economic fundamentals. As such, we expect a rebound in equities and credit over the first quarter of the new year, as the markets begin to recognize that the valuations are far too attractive, despite ongoing headline risks. Despite the recent sell-off, we don’t believe the current bull market has come to an end. We do, however, believe we are late into the cycle, so as such will use market rallies to move out of higher beta areas and into more stable areas of those respective asset classes. Rather than chasing returns in a late cycle rally, we will use this opportunity to move into defensive growth areas to protect the outperformance we have had in our strategy since inception.
Copyright © BMO Global Asset Management


