TECK RES CL B SV (TECK.B.TO) TSX - Jul 04, 2018

TECK RES CL B SV (TECK.B.TO) TSX - Jul 04, 2018

SIA Charts Daily Stock Report (siacharts.com)

The SIA Daily Stock Report utilizes a proven strategy of uncovering outperforming and underperforming stocks from our marquee equity reports; the S&P/TSX 60, S&P/TSX Completion and S&P/TSX Small cap. We overlay these powerful reports with our extensive knowledge of point and figure and candlestick chart signals, along with other western-style technical indicators to identity stocks as they breakout or breakdown. We provide SIA Subscribers with truly independent coverage of the Canadian stock market with specific buy and sell trigger points.

Note: Subscribers can screen all Canadian and U.S. stocks and mutual funds, or as components of equally weighted mutual fund sectors indices, and fund groups by issuer, all Canadian Exchange Traded Funds, by issuer (iShares, Horizons, BMO), or as components of Equally Weighted Fund Sector Indices (e.g. 2020+ Target date, Cdn Equity Lg Cap), and create and monitor their own, or SIA's existing model portfolios.

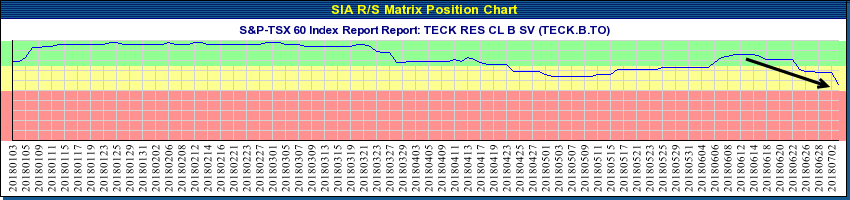
Subscribers may generate BUY-WATCH-SELL Signals on demand with SIA Charts' proprietary Favoured/Neutral/Unfavoured, SMAX scoring algorithm (see green-yellow-red graph 1 below).

GREEN - Favoured / Buy Zone
YELLOW - Neutral / Hold Zone
RED - Unfavoured / Sell / Avoid Zone

TECK RES CL B SV (TECK.B.TO) TSX - Jul 04, 2018


Important Disclaimer

SIACharts.com specifically represents that it does not give investment advice or advocate the purchase or sale of any security or investment. None of the information contained in this website or document constitutes an offer to sell or the solicitation of an offer to buy any security or other investment or an offer to provide investment services of any kind. Neither SIACharts.com (FundCharts Inc.) nor its third party content providers shall be liable for any errors, inaccuracies or delays in content, or for any actions taken in reliance thereon.

Copyright © siacharts.com

Total
0
Shares
Previous Article

The Electrifying Outlook for Metals Demand

Next Article

Top 10 Countries with Largest Gold Reserves

Related Posts
Read More

Falling short: Why are long-dated bonds struggling in 2025?

Rate cuts in the developed world kicked off meaningfully in June 2024 with the Bank of Canada, then the European Central Bank (ECB). The Bank of England followed in August 2024 and the US Federal Reserve played catch up in September 2024 with a 50 basis points (bp) first cut. There have been cumulative ‘soft-landing’ rate cuts of between 100bp and 225bp across the developed world, yet over this same time period we have witnessed a sustained rise in long-dated bond yields.1 This has culminated in current post-Covid yield highs for 30-year bonds in a number of countries, with some markets such as the UK trading at levels not seen for over 25 years. Recall that bond prices fall when yields rise and vice versa, so recent movements in longer-dated bond yields have led to underperformance (and in most cases negative returns) from this area of the bond market. Movements have varied across bond maturities and countries, so careful selection has been crucial. Country and curve positioning matters Yield change (year to date) for government bonds of different maturities A column chart showing the year to date change in yield for 2 year, 5 year, 10 year and 30 year government bonds. The vertical axis shows the change in yield ranging from -0.75% to +0.75%. The horizontal axis has different countries, US, UK, Germany, Australia and Japan. For every country the 30 year bond yield has risen, with Germany and Japan the most extreme at more than 0.7%. In contrast , 2 year bonds have seen a fall in yields except Japan. Source: Bloomberg, 2-year, 5-year, 10-year and 30-year government bonds for selected countries, change in yield (percentage point change year to date), 31 December 2024 to 15 August 2025. Y = year. Past performance does not predict future returns. At times in 2025 we have witnessed bouts of rising yields which have felt crisis-like: the UK in early January 2025, and Japan’s long end in May 2025. However, for the most part, the rise in long-end bond yields has been persistent but less headline-grabbing. In August, we have seen new highs for this cycle in 30-year Gilts and 30-year European bonds. The US bond market has outperformed on rising expectations of rate cuts and 30-year yields still hover just 20bp below the highs from October 2023.2 There remain medium term concerns about inflation and fiscal deficits that continue to bubble up in different countries at different times: for example, in August 2024 it was the persistence of UK inflation, in March 2025 German fiscal expansion. Importantly however, there does appear to be what might be described as a “market structure” issue: a structural slowdown in duration demand (i.e. demand for longer-dated bonds) which is causing sustained and continued pressure on long-dated bond yields in a number of geographies. There remains a sobering fragility to this part of global bond markets which is noteworthy. So what is going on? As central banks cut interest rates in an easing cycle, some steepening of the yield curve is to be expected. However, beyond this cyclical driver, there are three factors that appear to account for the rise in long-end yields: Buyers strike: The traditional buyers of 30 year plus bonds come from the institutional investment community. In different countries there has been reduced demand from these investors for their own particular domestic reasons: in the UK the collapse of duration demand from the defined benefit pension funds post 2022; in Europe it is pension fund reform in the Netherlands which has been a focal point; and in Japan a structural reduction in demand from the life insurance sector (reduced inflows to life insurers versus banks and life insurance sales shifting away from super-long liability products). Quantitative Tightening: At the same time as cutting rates, central banks have continued to shrink their holdings of government bonds. Except for the UK, where active selling of bonds has been part of the policy mix since November 2022 and has included selling longer dated bonds back to the market, quantitative tightening has been in ‘passive’ form i.e. letting existing holdings mature and not be reinvested. The Bank of England are widely expected to announce a reduction in the pace of the active selling in September 2025: the debate is by how much. Fiscal deficit concerns: There is no end in sight to the growth of deficits. The German election in February saw a dramatic increase in debt-fuelled infrastructure and military spending announced, whilst Japan and Canada await post-election fiscal plans which are likely to see increased spending. The UK and France continue to struggle to exhibit credible fiscal discipline whilst the recent US “One Big Beautiful Bill Act” was somewhat fiscally expansionary (albeit less so after the effects of tariff income). We are now in an environment across the developed world of non-synchronised interest rate cycles, which is being reflected in the increasingly divergent performance of bond markets across different countries in the developed world. Selecting the right geography to have duration and the right part of the yield curve is of paramount importance. 1Source: LSEG Datastream, reference is to cumulative rate cuts among US Federal Reserve, European Central Bank, Bank of Canada and Bank of England, 31 May 2024 to 31 July 2025. 2Source: Bloomberg, US 30-year government bond yield,19 October 2023 to 19 August 2025. Yields may vary over time and are not guaranteed. Fixed income securities are subject to interest rate, inflation, credit and default risk. The bond market is volatile. As interest rates rise, bond prices usually fall, and vice versa. The return of principal is not guaranteed, and prices may decline if an issuer fails to make timely payments or its credit strength weakens.Jenna Barnard, Head of Global Bonds, explores why longer-dated government bonds have struggled during 2025 despite central bank rate cuts.
Subscribe to AdvisorAnalyst.com notifications
Watch. Listen. Read. Raise your average.