by Jeffrey Saut, Chief Investment Strategist, Raymond James
“. . . A man has rigged up a turkey trap with a trail of corn leading into a big box with a hinged door. The man holds a long piece of twine connected to the door that he can use to pull the door shut once enough turkeys have wandered into the box. However, once he shuts the door, he can’t open it again without going back into the box, which would scare away any turkeys lurking on the outside. One day he had a dozen turkeys in his box. Then one walked out, leaving eleven. ‘I should have pulled the string when there were twelve inside,’ he thought, ‘but maybe if I wait, he will walk back in.’ While he was waiting for his twelfth turkey to return, two more turkeys walked out. ‘I should have been satisfied with the eleven,’ he thought. ‘If just one of them walks back, I will pull the string.’ While he was waiting, three more turkeys walked out. Eventually, he was left empty-handed. His problem was that he couldn’t give up the idea that some of the original turkeys would return . . .”
. . . Why You Win or Lose: The Psychology of Speculation, by Fred C. Kelly
We have used this quip from the book Why You Win or Lose: The Psychology of Speculation by Fred C. Kelly many times in our missives over the past nearly five decades because the wisdom of its message is timeless. We recalled it last week in many of our meetings in New York City when we heard certain individual investors, as well as portfolio managers (PMs), say “I should have!” Some of the quotes included: “I should have raised some cash in January;” “I should have bought the undercut low on February 9;” “I should have bought Facebook when the Cambridge Analytical scandal took the shares down to $150;” and the list goes on. The “I should have market” goes all the way back to when the bottoming process began on October 10, 2008, when 92.6% of all stocks traded had made new annual lows. As often stated, “That is a seven or eight standard deviation event, which means it is unlikely to happen in your lifetime.” In October 2008 is when the majority of stocks bottomed. However, the indices went lower into the March 2009 bottom because the financial sector was so heavily weighted in the S&P 500, and the financials kept going lower.
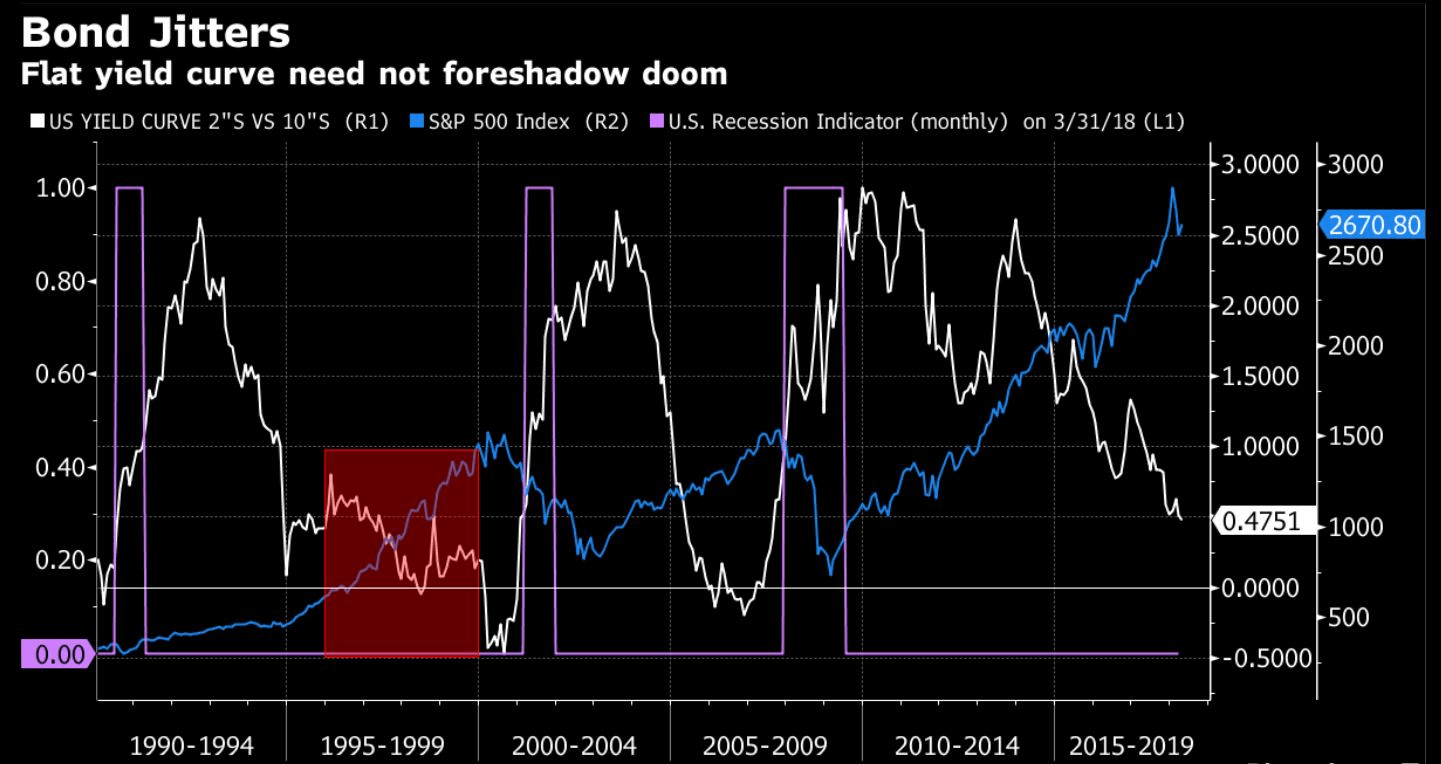
Speaking to the financial sector, we fielded many questions about the financials last week because the group is down some 12% from its January high. Meanwhile the S&P 500 (SPX/2779.66) is down a mere 3.4% from its January high. So why the disparity? It likely has to do with the “yield curve” and worries the yield curve will invert (short-term yields above long-term yields), which has tended to be a precursor to a recession. As Investopedia writes:
“The flat yield curve is a yield curve in which there is little difference between short-term and long-term rates for bonds of the same credit quality. This type of yield curve is often seen during transitions between normal and inverted curves. The difference between a flat yield curve and a normal yield curve is a normal yield curve slopes upward.”
Yet an inverted yield curve does not always imply there will be a recession (chart 1 on page 3), but we digress. We continue to like the banks, believing they are cheap relative to the overall equity markets and as my father used to say, “Good things tend to happen to cheap stocks!” My two favorite portfolio managers playing to the financial stocks are David Ellison, portfolio manager for the Hennessy Large Cap Fund and the Hennessy Small Cap Fund; and Anton Shultz, portfolio manager of the RMB Mendon Financial Services Fund.
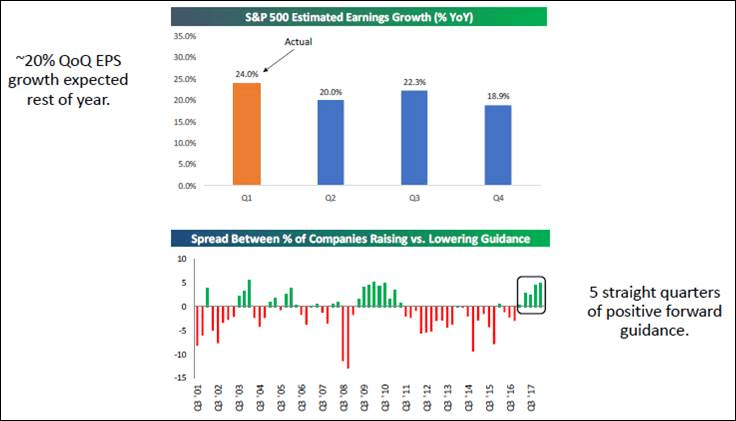
Another “I should have” moment was, “I should have known we were not at peak earnings in 1Q18.” Indeed, that was the cry heard from many pundits at the end of the 1Q18 earnings season. Andrew Adams and I, however, have been adamant that is not the case. Recall that 1Q18 earnings for the S&P 500 came in at +24% in a blowout quarter. The sectors driving the earnings boom were: Energy, Financials, Materials, and Technology, or nearly all of the sectors we have recommended overweighting, save Consumer Discretionary. Of interest is that 2Q18 earnings are estimated to grow by 20% followed by 3Q18 estimated growth of +22.3% and +18.9% in quarter four (chart 2). Currently S&P bottom up earnings estimates for 2018 are at $157.32 and 2019’s are $174.59. If those estimates are anywhere near the mark, it means the SPX is trading at 17.7x this year’s estimate and 15.9x next year’s estimate. So much for the “peak earnings” crowd.
Of course there was the ubiquitous question about the possibility of a trade war. Those concerns heightened on Friday with the 25% tariffs President Trump imposed on $50 billion worth of Chinese goods that affects some 800 products. China responded by announcing it will impose an additional 25% tariff on 659 U.S. goods worth $50 billion, surfacing worries of another 1930 Smoot-Hawley crisis when the U.S. imposed tariffs on more than 20,000 goods. While this certainly sounds like an escalation, we tend to agree with our pal Brian Wesbury (First Trust) who writes:
While some are worried about protectionism from Washington, we continue to believe this is a negotiating tactic, and the chances of an all-out trade war are slim. Most likely, what will ultimately come from all the chaos will be better trade agreements for the United States. According to the World Trade Organization, average tariffs in the US are 3.5% compared to 5.2% in the EU, 9.9% in China, 4.1% in Canada and 7.0% in Mexico. It's time for tariffs to be lowered around the world, and the US holds a lot of power.
Evidently the stock market seems to agree with Brian because the D-J Industrials rallied some 200 points following the tariff announcements last Friday, yet still closed down some 85 points. Our hunch is that comeback was because it sees this tariff tiff coming to an end.
Yet another “I should have moment” came from a number of individual investors that wished they had purchased Amy Zhang’s Alger Small Cap Focus Fund earlier this year. Amy is the PM for said fund and she looks to investing in small caps relative to their revenue streams. If you want to be impressed, check out her performance. We mention Alger Capital this morning because we spent time last week with CEO/CIO Dan Chung and head of distribution Jim Tambone to better understand the Alger story. Another fund we discussed at the meeting was the Alger SMid Cap Focus Fund managed by Boston-based Matthew Weatherbie. By our pencil his investment model is unique and while we have not met him yet, we look forward to seeing him on our next visit to Boston.
Moving on to the stock market, last Friday’s tariff-induced “S&P Swoon” was arrested in the often mentioned 2770 – 2785 support zone. This was consistent with the stock market’s “internal energy” mix. Meanwhile, buying power continues to expand and selling pressure is in contraction mode. As the must have Lowry’s Organization writes:
In summary, given all the chatter about tariffs, trade wars, rising interest rates, etc., it’s possible to characterize this market as ‘climbing a wall of worry,’ an ascent generally regarded as typifying a healthy bull market. And, this climb is supported by broad-based rising Demand combined with falling Supply, suggesting a bull market showing increasing rather than diminishing strength.
The call for this week: As the astute Bespoke organization notes:
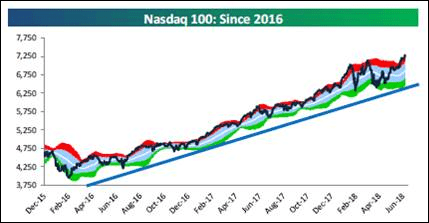
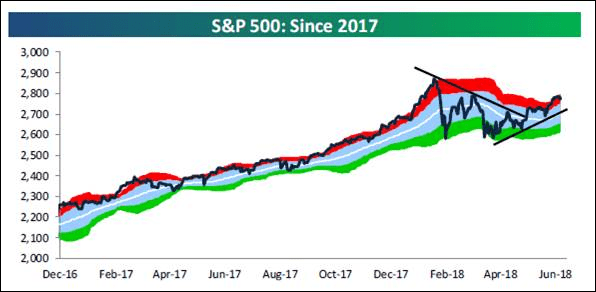
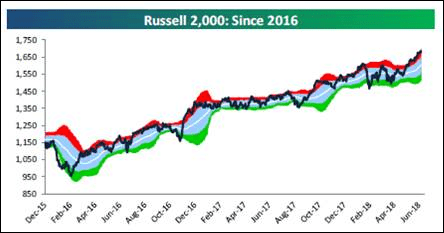
Long-term uptrend channels are still in place (chart 3 on page 4). Nasdaq just breaking out to new all-time highs (chart 4). While the S&P is still in “correction” mode, until it takes out its January highs, a short-term uptrend has emerged off of the April lows (chart 5 on page 5). Small-caps – thought of as a “leading indicator” for the broad market – continue to make new high after new high in 2018 (chart 6). Underlying breadth points to an eventual new high in price for the S&P 500 (chart 7 on page 6).
In our appearance from CNBC’s NASDAQ-based studio last Thursday morning, we were asked about, “Will the Fed’s interest rate increases kill the secular bull market?” Our response was, “The spread between the return on capital, and the cost of capital, is so wide the Fed has plenty of room to raise rates before it impacts the equity markets.” This morning, however, stocks are weak with the S&P 500 futures off some 12 points. Usually the opening on expiration is strong due to investors buying stocks to replace expiring contracts. Thursday’s apathetic action and weak close suggests that today’s NYSE could be soft. Thursday was an Inside Day, which has been occurring at an unusually high rate this year. Traders will be sensitive to Thursday’s high (2789.06) and low (2776.52).
Chart 1
Source: Thomson Reuters
Chart 2
Source: Bespoke Investment Group
Chart 3
Source: Bespoke Investment Group
Chart 4
Source: Bespoke Investment Group
Chart 5
Source: Bespoke Investment Group
Chart 6
Source: Bespoke Investment Group
Chart 7
Source: Bespoke Investment Group
Additional information is available on request. This document may not be reprinted without permission.
Raymond James & Associates may make a market in stocks mentioned in this report and may have managed/co-managed a public/follow-on offering of these shares or otherwise provided investment banking services to companies mentioned in this report in the past three years.
RJ&A or its officers, employees, or affiliates may 1) currently own shares, options, rights or warrants and/or 2) execute transactions in the securities mentioned in this report that may or may not be consistent with this report’s conclusions.
The opinions offered by Mr. Saut should be considered a part of your overall decision-making process. For more information about this report – to discuss how this outlook may affect your personal situation and/or to learn how this insight may be incorporated into your investment strategy – please contact your Raymond James Financial Advisor.
All expressions of opinion reflect the judgment of the Equity Research Department of Raymond James & Associates at this time and are subject to change. Information has been obtained from sources considered reliable, but we do not guarantee that the material presented is accurate or that it provides a complete description of the securities, markets or developments mentioned. Other Raymond James departments may have information that is not available to the Equity Research Department about companies mentioned. We may, from time to time, have a position in the securities mentioned and may execute transactions that may not be consistent with this presentation’s conclusions. We may perform investment banking or other services for, or solicit investment banking business from, any company mentioned. Investments mentioned are subject to availability and market conditions. All yields represent past performance and may not be indicative of future results. Raymond James & Associates, Raymond James Financial Services and Raymond James Ltd. are wholly-owned subsidiaries of Raymond James Financial.
International securities involve additional risks such as currency fluctuations, differing financial accounting standards, and possible political and economic instability. These risks are greater in emerging markets.
Investors should consider the investment objectives, risks, and charges and expenses of mutual funds carefully before investing. The prospectus contains this and other information about mutual funds. The prospectus is available from your financial advisor and should be read carefully before investing.
Copyright © Raymond James


