by John Mauldin, Mauldin Economics
Euphoria Everywhere
Square & Tower
Cracks Forming
Rifle Shots
Charlotte, Fort Lauderdale, Chicago, and Raleigh
Valuing a stock isn’t hard. Each share is worth exactly as much as a buyer offers you when you try to sell. Quite simple. But of course, there’s more to it.
We heard a lot about valuations at my Strategic Investment Conference, and particularly about the “FAANG” stocks that drove much of the recent bull run. Now, only two weeks later, the “F” in that acronym (Facebook) is tumbling, with the others maybe not far behind. That’s a problem for every stock investor, FAANG or otherwise. So today we’ll look at valuations more broadly and then zero in on the social networking issues that are turning more problematic.
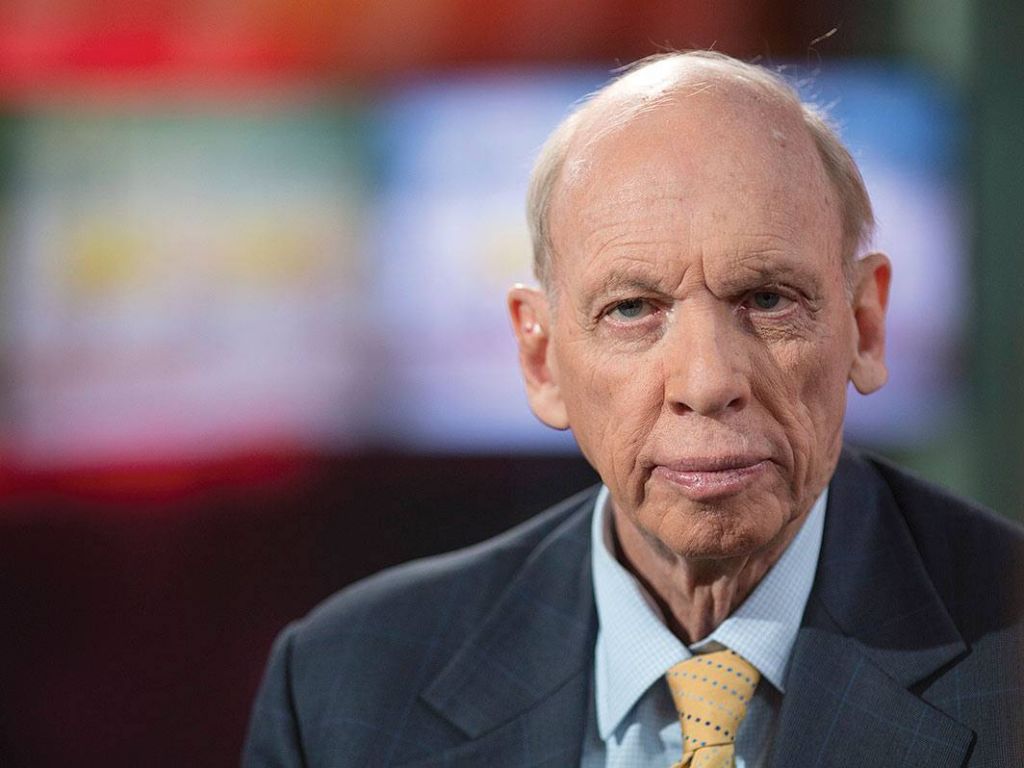
Photo: Getty Images
Several SIC speakers addressed these topics. I’ll review some today, but for the full story you really need to get our SIC Virtual Pass. I promise to stop hawking it after this week, but I want to give you one last chance. I’ve convinced my partners to extend the special $395 price until midnight this Monday. Click here to get it while you can.
The FAANG stocks, if you aren’t hip to the lingo, consist of Facebook (FB), Apple (AAPL), Amazon (AMZN), Netflix (NFLX), and Google (GOOGL). Google’s official name is “Alphabet” now, but it takes a G to make the acronym work.
Whatever you call them, those five companies have ruled the technology sector the last few years and have wielded a heavy influence on the entire stock market. Apple is the world’s most valuable company by market capitalization, with Amazon and Google not far behind. So anyone indexing US large-cap equities – which means almost anyone with investment capital – simply must own them.
Owning the FAANGS was a big help in 2017. Here’s a chart my good friend Dave Rosenberg of Gluskin Sheff shared in his SIC presentation. It shows 2017 price returns for some selected asset classes. Last year pretty much everything went up, but not equally.
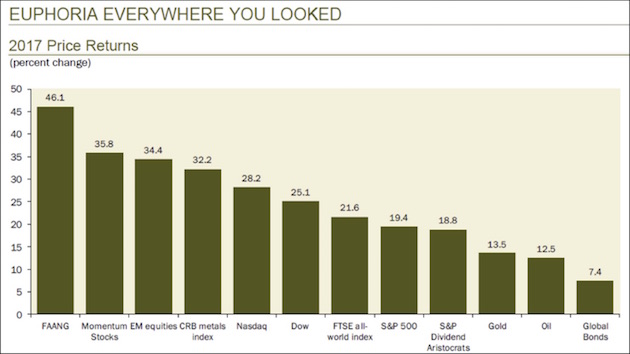
As you can see, the FAANG stocks outperformed other stock benchmarks as well as gold, oil, and bonds. And not just by a little. If you are an equity portfolio manager who didn’t own the FAANGs last year, you probably had some explaining to do. But Dave went on to demonstrate why 2018 or 2019 could be quite different, using four different S&P 500 valuation metrics:
• Forward Price to Earnings Ratio
• Price to Sales Ratio
• Price to Book Value Ratio
• Enterprise Value to EBITDA Ratio
Dave then calculated the percentage of time that each of these had been at its present level or below. Here’s the result for P/E ratio.
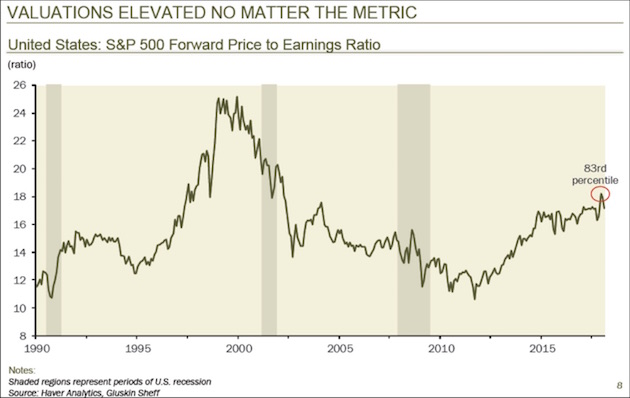
The S&P 500 forward P/E ratio has been below its present level 83% of the time since 1990. Repeating that exercise for the other three metrics and then averaging them, Dave found the index is presently at a 92nd percentile valuation event. Here’s Dave, from the transcript, with my bold added:
In other words, only 8% of the time in the past has the stock market in the United States been as richly priced as it is today. And if you want to come up with reasons why that’s the case, that’s fine. But just understand that we are extremely pricey. We’re more than just a one standard deviation event versus the historical average.
Dave then showed this surprising table, comparing historic bull markets with GDP change during the same period.
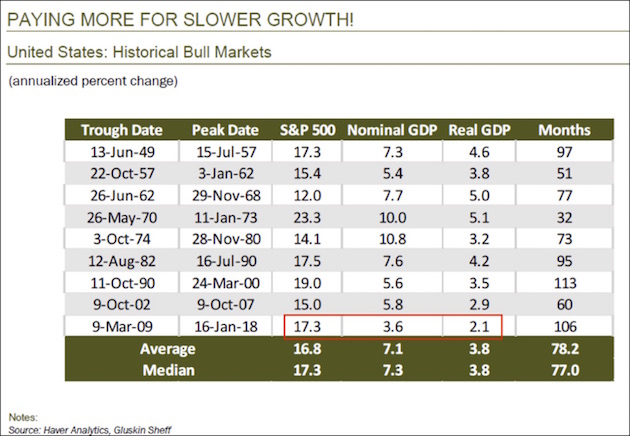
The 2009–2018 bull market from trough to peak averaged 17.3% annually. Nominal GDP rose 3.6% annually during that time, and real GDP rose 2.1%. Go up the table to the 1982–1990 bull run. It reached a similar magnitude at 17.5%, but nominal GDP rose 7.6% and real GDP 4.2%.
Yes, GDP has its flaws. Today’s economy isn’t like the 1980s. Nonetheless, how is it that stocks rose the same amount on half as much economic growth? Dave said that if the stock-GDP ratio today had remained what it was back then, the S&P 500 would be around 1,550 today. That’s how excessive valuations are now. The S&P slid again this week, as you probably noticed.
Here’s another way Dave looked at it: household net worth as a percentage of disposable income. The higher that ratio, the more wealthy and confident you probably feel if you are anywhere near average (and many aren’t, of course).
In 1999–2000 and again in 2006–2007, the ratio was near a peak, and people felt good. The good feelings didn’t last. Both times the ratio corrected back below its long-term average.
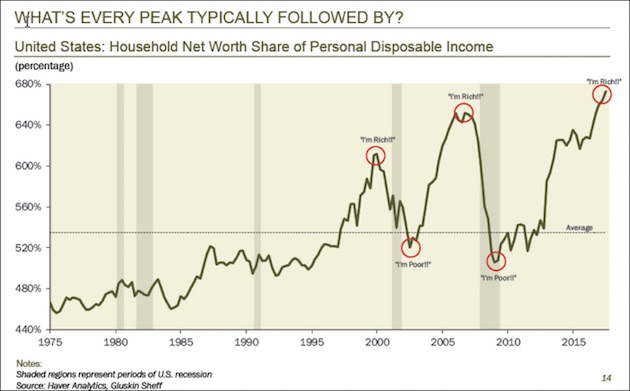
And now? The net worth/income ratio is above where it was at those last two cyclical peaks. It could go even higher, too – but not by much, I suspect – and the move down probably won’t be fun.
Whenever it happens, the next downturn will be something new: the first socially networked recession and bear market. It’s hard to believe now, but Facebook and Twitter were both just infants in 2007. Smartphones were still a high-end luxury item, too. We are now tied together in ways we were not back then. Those connections will make the experience quite different, so it’s worth talking about networks.
In organizing the SIC agenda each year, I try hard to blend experts in other fields with economists and portfolio managers. I want attendees to leave with a richer, more nuanced, multidisciplinary view. That’s one reason Niall Ferguson is a perennial favorite. He looks at the economy with historical perspective and delivers insight we would otherwise miss.
This year Niall gave us some inside thoughts from his latest book, The Square and the Tower. I’m halfway through reading and highly recommend it. As all writers know, some of the best material doesn’t get into the final product, so Niall’s SIC presentation greatly enhanced the experience.
Niall’s book is about hierarchy and networks. Squares are where people meet and mingle. They are the source of creativity, invention, innovation. Towers, on the other hand, are where power resides – “hierarchical structured power,” as Niall calls it. The great tension in human history is between those two, the squares and the towers – and technology has increased that tension.
Rising tensions have all kinds of implications, but the most obvious was the 2016 political changes: populist uprisings in many countries, Brexit in the UK, and Trump’s election in the US. Would those have happened without the new networks Facebook and Twitter? Probably, but not as quickly. The process is continuing, too.
Niall pointed out something critical about networks: They are profoundly unequal. Networks may connect us all, but not in the same ways. Here’s Niall from the SIC transcript:
Networks are inegalitarian in two ways. The structure of the network is inegalitarian because of preferential attachment. When new people join a network, they want to be connected to the most connected nodes. Secondly, once networks become economic propositions run for profit, it’s winner takes all. And that is why five of the eight richest men in the world today are rich because of network economics.
He then showed a slide of those five men: Bill Gates, Jeff Bezos, Mark Zuckerberg, Larry Ellison, and Michael Bloomberg. In different ways, they all saw and exploited the value of connecting people via technology.
This network revolution had a dark side though, and we saw that dark side manifest in 2008. Here’s Niall again.
The financial crisis, I think, needs to be understood as a colossal network outage. Very few central bankers understood the extent to which the international financial system had become a giant network. I think regulators and legislators underestimated the fragility of the system in 2008. They failed to see that a single node, a single investment bank that nobody regarded as pivotal to the system was in fact very important. And when Lehman failed, the system, the entire global credit system... you remember? I remember... threatened to collapse completely. Andrew Haldane, chief economist at the Bank of England now, is one of the few central bankers who think about this, and indeed this slide was taken from a deck that he did in 2011.
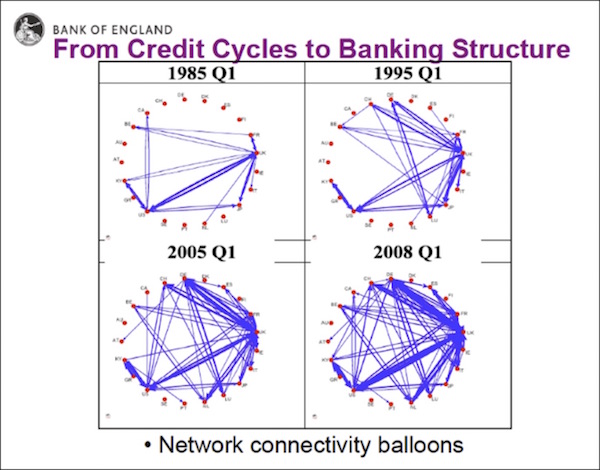
The way I see it is that since 2008 the rest of us have basically caught on with where the financial world was 10 years ago. Initially it was only the financial world that was networked to the max because it was still quite expensive to be networked 10 years ago. But with the advance of giant platforms like Facebook offering zero-cost networking, all of us are now as connected as only investment bankers were a decade ago.
Really pay attention to that chart. This is happening in literally hundreds of industries.
These ubiquitous connections were supposed to empower everyone. Instead, they empowered those who owned and controlled the networks. A handful of “platform” companies essentially gained the ability to micromanage the village square, defining what information each person could see and hear.
In fairly short order, the FAANG companies leveraged that ability to dominate the global economy. Amazon is in a sense eating retail sales by making price discovery much easier. You can compare prices simply by running your phone over a barcode while you shop in a store.
Similarly, Google and Facebook are eating advertising. Apple, Netflix, and their kin are eating leisure time. Our already weak form of capitalism has turned as monopolistic as it was in the Gilded Age more than a century ago. It wasn’t supposed to happen that way, but it did.
So now those companies face a worsening backlash. Evidence increasingly suggests that Facebook’s data trove affected election results more than previously understood. Whether that was spontaneous or planned isn’t yet clear. But many Facebook users and, more importantly, advertisers aren’t happy about it.
(To be clear, I am not talking about Russian use of Facebook or Twitter. Whatever they spent pales in comparison with what the candidates themselves spent, plus their surrogates and other groups.)
This discussion brings us back now to market valuation. As we saw above, the stock market is overvalued by many different measures. I shared Dave Rosenberg’s thoughts, but at SIC we heard a lot more from Steve Blumenthal, Mark Yusko, and several others. The evidence is adding up – and it’s not bullish, to say the least.
What drove valuations higher? Many reasons, but the FAANG companies are primary. Here’s another chart Niall Ferguson shared:
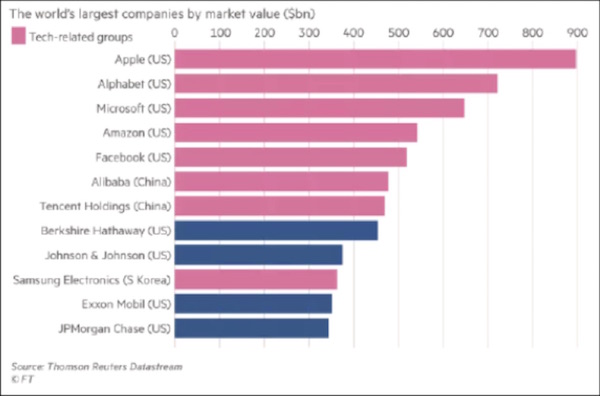
Tech stocks – including all the FAANG names except Netflix – were 8 of the world’s 12 most valuable companies when FT made this chart last year.
If several of these stocks start rolling over, the global bull market will be hard to sustain – and it’s already under assault for entirely different reasons, like rising interest rates, a potential trade war, and the overdue US recession.
It’s startling how fast the picture has changed. As of December, many bulls thought tax cuts would spark enough activity to keep the economy growing into 2019 and beyond. That opinion is considerably less common today, including at the Federal Reserve. Here’s the FOMC’s latest GDP projection, released just this week.
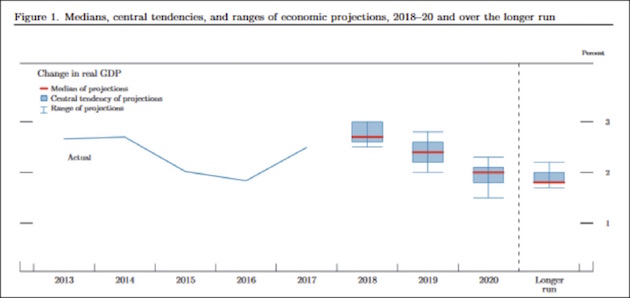
I include this chart not because the FOMC members are great forecasters; they are clearly not. But this is what they think, and their thinking guides their rate decisions, which do have consequences. They see real GDP growth rising to the 3% area this year before drifting back down to around 2% in the long run. And believing that, they still turned slightly more hawkish.
The Atlanta Fed’s GDPNow forecast is even more telling:
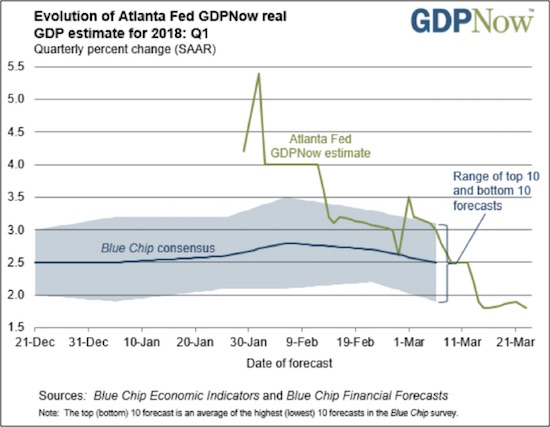
Less than two months ago, GDPNow was predicting almost 5.5% real GDP growth this quarter. From there, GDP growth has collapsed all the way to 1.8% as of March 23.
If the economy and markets are a mirror, we’re starting to see a bunch of cracks. The Bitcoin breakdown looks ominous in hindsight as possibly the first domino. Then we had the February VIX-driven correction, followed by trade worries and now FAANG fears.
My good friend Steve Blumenthal used this chart from Ned Davis Research. Essentially, NDR looks at 10 recession indicators, each of which have varying levels of reliability; but by combining them in one overall index, you get a much better picture. As of now, it says recession danger is relatively low for the next nine months.
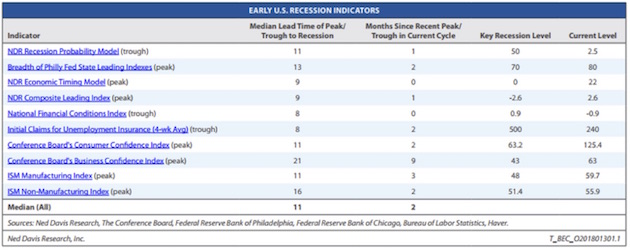
That said, the clear consensus from SIC was that the economy is likely to slow down, and the potential for a recession by mid-2019 is very real. A looming slowdown will hit corporate earnings and eventually stock prices. Judging from February and then this week, we may already be entering that stage.
Of course, the conference wasn’t all bad news. We heard about major progress on the antiaging front. Speakers presented numerous investing ideas, and attendees exchanged more with each other. But I didn’t hear anyone suggest buying indexes and then going away. This is a time for well-aimed rifle shots.
All in all, it was the best Strategic Investment Conference of the last 15 years. If you are in the industry or are interested in investing and economics, you really should take the time to work through the transcripts and slide presentations of this conference. As I promised, this letter will be my last “pitch” for the Virtual Pass. I am so enthusiastic about this conference that I just wish everybody could experience it. Buy now, because the price goes up after this weekend.
And if you couldn’t make it to San Diego this year, then mark your calendar to join me in Dallas for the 16th annual Strategic Investment Conference. The dates are May 13–16, 2019. Start planning your schedules now.
Charlotte, Fort Lauderdale, Chicago, and Raleigh
I am home next week, but in April and May I travel to Charlotte, Fort Lauderdale, Chicago, and Raleigh for speaking engagements. I’ll share information on these as they draw closer.
One last SIC thought. I think my favorite session of the conference, if the most troubling, was the panel with Democratic pollster Pat Caddell, Heritage Foundation economist Steve Moore, and demographics expert Neil Howe. This week I had long telephone conversations with both Pat and Neil, trying to get a handle on the future of US and global politics.
That issue is becoming a significant portion of the book I’m working on. I think understanding the fragmentation of societies worldwide is as important as grasping the import of technological changes is. Throw in the increasingly worrisome macroeconomic developments and rising global debt, and a “Perfect Storm” may be brewing.
These periods of great societal regime change are rare. Of course, one such period saw the founding of this country; then came1824, 1860, and 1932. Now it feels as if another turning point is at hand. It is almost as if we are searching all over again for the definition of “American,” or “French,” “Italian,” “Brit,” or “German.”
Two weeks ago in “The Great Jobs Collision” I talked about the massive number of jobs that could disappear in the US over the next 12 years. This transition will mean even more angst. Yes, new jobs will be created, but they won’t be where the old jobs were lost, or require the same skills, or deliver the same pay.
Twenty years ago, the number of people who believed in universal basic income in the United States was relatively small. Today it is almost 50% and rising. Pat Caddell sent me an 80-slide deck of his latest polling results, which depict the country more divided than ever. Neil Howe’s data shows the same generational conflicts as well, just playing out on a different level.
We had some out-of-town guests last night, all from the financial industry, and the after-dinner conversation just kept reminding me that we must be willing to think the unthinkable. That is true both with regard to the incredibly fast-paced technological changes that are coming and with regard to the societal tremors and upheavals that lie ahead.
I believe this last conference and the follow-up conversations have had more impact on my thinking than any previous conference has. I am glad to be home next week because I really need more time to think. In the meantime, you have a great week.
Your still somewhat overwhelmed analyst,
John Mauldin

