
Although stock markets had become extremely overbought and overdue for a correction, the kindling that finally sparked last month’s big market selloff and the reshuffling of leadership since was uncertainty over where incoming Fed Chair Powell was going to take US Monetary Policy. This week’s Fed decision, statement and member projections has cleared the air about the Fed’s future direction under new Chair Powell.
Simply put, the Fed intends to stay the course with 3-4 rate hikes forecast for this year and next including the 0.25% increase just announced. The chart of FOMC member interest rate forecasts, aka the infamous Dot Plot, suggests that the majority of members expect a Fed Funds rate of 2.00%-2.50% at the end of 2018 and 2.75%-3.50% by the end of 2019. Meanwhile, Fed members expressed optimism about the US economy raising their 2018 GDP growth forecast to 2.7% from 2.5% while maintaining their core PCE inflation forecast at 1.9%, indicating a positive environment for business and corporate earnings.
In this week’s Equity Leaders Weekly we look at the impact of the FOMC decision and outlook on the relationship between stocks and bonds. We also revisit the oil price in the wake of surprise drawdowns in US oil inventories this week.
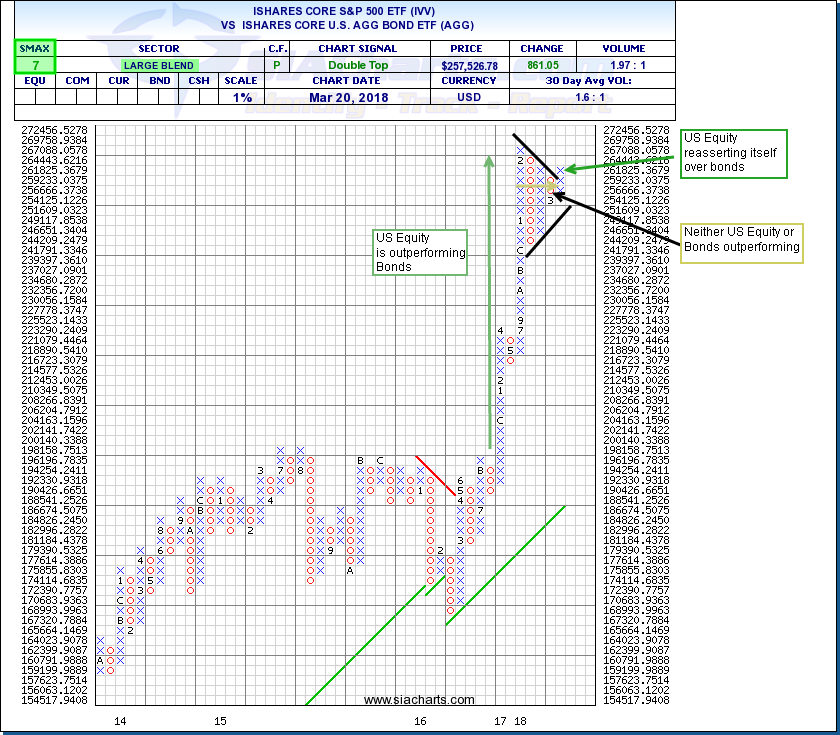
iShares Core S&P 500 ETF (IVV) versus iShares Core US Aggregate Bond ETF (AGG)
The relative performance of Stocks and Bonds is one of the most popular and crucial indicators of money flows between asset classes. It is the first relationship listed in the Comparison Charts section on the SIA Charts home page.
In recent issues of the Equity Leaders Weekly, we have been discussing what a strong economy and rising interest rate environment has meant for the relative performance between equity market sectors. Specifically, economy sensitive sectors like Industrials, Consumer Discretionary, and Technology have been among the top performers while interest rate sensitive sectors like Real Estate, Telecom and Utilities are among the weakest relative performers.
This chart shows that in 2017, equities outperformed bonds on the back of a rising stock market but more recently their relationship had stabilized. The breakout from a Bullish Triangle indicates that Equities are starting to outperform Bonds again. The difference this time around is that it may be driven more by a falling Bond market as investors adjust their portfolios for what looks like a steadily rising interest rate environment for the next year or two. With a Vs. SMAX score of 7 out of 10, this indicates potential further strength in US Equity over Bonds.
Crude Oil Continuous Contract (CL.F)
Crude oil started off the year in strong fashion with a big advance, but in recent weeks oil had stalled with a big battle between bulls and bears sparking moves in both directions. Generally higher oil prices into the $60s has reignited US exploration and production growth leaving investors wondering when OPEC and Russia would respond to losing market share and limiting the price upside. On the other hand, a strong US economy and positive demand outlook has been shoring up support and limiting the downside.
This battle appears to have been resolved in favour of the bulls for now. This week’s API and DOE US oil inventory reports featured significant surprise drawdowns indicating that strong demand has been soaking up the increased supply and then some. WTI crude has regained the $65.00 level, completing a Bullish Triangle. Next potential resistance appears near $67.10 then the $70.00 level, with support in place near $60.00 then $58.41. With an SMAX score of 8 out of 10, CL.F is showing near-term strength against most asset classes.
Rising energy prices have had a positive impact on oil sensitive currencies like the Canadian Dollar and Mexican Peso. Should crude continue to establish $60.00 as a new higher floor, energy stocks, which have been underperforming the market lately, may start to attract renewed interest as well.

SIACharts.com specifically represents that it does not give investment advice or advocate the purchase or sale of any security or investment. None of the information contained in this website or document constitutes an offer to sell or the solicitation of an offer to buy any security or other investment or an offer to provide investment services of any kind. Neither SIACharts.com (FundCharts Inc.) nor its third party content providers shall be liable for any errors, inaccuracies or delays in content, or for any actions taken in reliance thereon.
For a more in-depth analysis on the relative strength of the equity markets, bonds, commodities, currencies, etc. or for more information on SIACharts.com, you can contact our sales and customer support at 1-877-668-1332 or at siateam@siacharts.com.