Stocks Enter Correction Territory, But Should Investors Worry?

by LPL Research

After a turbulent week, the Dow Jones Industrial Average and S&P 500 Index officially slipped into correction territory at yesterday’s close—marking the fastest move from record levels to correction in history. For reference, a correction is defined as a decline of -10.0% from the most recent high, which in this case occurred just nine days ago on January 26.

The Dow has experienced two 1,000-point declines this week, which are larger numbers than investors are used to seeing on a single day; however, it is also important to note that the Dow (which closed at 23,860.46 yesterday) is much higher now than it was the last time we experienced a significant pullback. The last time the Dow saw a larger percentage pullback in a single day was on August 8, 2011, when it fell 634.76 points to close at 10,809.85—a -5.5% move for the index. To put things in perspective, neither that move, nor the latest two drops (-4.6% and -4.1% on February 2 and February 8, respectively) managed to crack the top 100 declines in history.

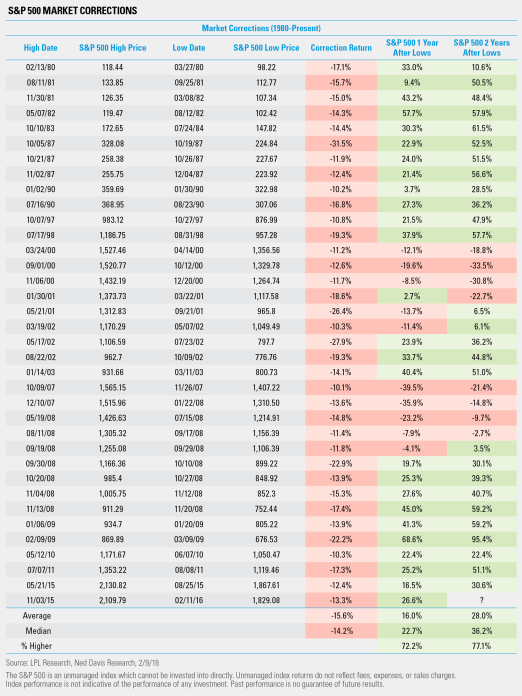
Corrections are never fun, but they also aren’t new territory for investors. Prior to the most recent example, we have experienced 36 corrections since 1980, and the S&P 500 fell by an average of 15.6% from peak to trough during these periods. Twelve months later, the index made up some ground, rising an average of 16.0% from the low, and after 24 months, the S&P 500 had climbed by an average of 28.0%, reinforcing the need for long-term investors to maintain their diversified strategies.


John Lynch, Chief Investment Strategist stated, “Considering positive economic data and rising corporate profits, we remain favorable on the longer-term investing environment despite the near-term volatility as leveraged trades continue to unwind in a messy and choppy fashion.” We maintain our projections for gross domestic product growth of up to 3.0% in 2018, along with a trading range of 2.75% to 3.25% for the 10-year Treasury, and a fair value estimate of 2,850–2,900 for the S&P 500. Additionally, we continue to favor areas of the market which may benefit from the return of the business cycle (see our Outlook 2018 for more information), including moves toward value, small cap stocks, financials, industrials, and technology.

LPL Research projects real gross domestic product (GDP) growth of around 3.0% in 2018. This is in line with historical mid-cycle growth of the last 50 years. Economic growth is affected by changes to inputs such as business and consumer spending, housing, net exports, capital investments, and government spending.

LPL Research also expects the 10-year Treasury yield to end 2018 in the 2.75–3.25% range, based on its expectations for a modest pickup in growth and inflation.


IMPORTANT DISCLOSURES

The economic forecasts set forth in the presentation may not develop as predicted.

All performance referenced is historical and is no guarantee of future results.

The opinions voiced in this material are for general information only and are not intended to provide or be construed as providing specific investment advice or recommendations for any individual security.

Economic forecasts set forth may not develop as predicted and there can be no guarantee that strategies promoted will be successful.

Investing in stock includes numerous specific risks including: the fluctuation of dividend, loss of principal and potential illiquidity of the investment in a falling market.

Dow Jones Industrial Average (DIJA) is the most widely used indicator of the overall condition of the stock market, a price-weighted average of 30 actively traded blue-chip stocks, primarily industrials. The 30 stocks are chosen by the editors of the Wall Street Journal. The Dow is computed using a price-weighted indexing system, rather than the more common market cap-weighted indexing system.

The Standard & Poor’s 500 Index is a capitalization-weighted index of 500 stocks designed to measure performance of the broad domestic economy through changes in the aggregate market value of 500 stocks representing all major industries.

Gross domestic product (GDP) is the monetary value of all the finished goods and services produced within a country’s borders in a specific time period, though GDP is usually calculated on an annual basis. It includes all of private and public consumption, government outlays, investments, and exports less imports that occur within a defined territory.

All indexes are unmanaged and cannot be invested into directly. Unmanaged index returns do not reflect fees, expenses or sales charges. Index performance is not indicative of the performance of any investment.

This research material has been prepared by LPL Financial LLC.

To the extent you are receiving investment advice from a separately registered independent investment advisor, please note that LPL Financial LLC is not an affiliate of and makes no representation with respect to such entity.

Not FDIC/NCUA Insured | Not Bank/Credit Union Guaranteed | May Lose Value | Not Guaranteed by any Government Agency | Not a Bank/Credit Union Deposit

Securities and Advisory services offered through LPL Financial LLC, a Registered Investment Advisor

Member FINRA/SIPC

For Client Use — Tracking #1-698341 (Exp. 02/19)

Total
0
Shares
Previous Article

Millennials Making Financial Progress, but Efforts Thwarted by Influence of Social Media

Next Article

Som Seif: Have Risk Appetites Become Outsized?

Related Posts
Subscribe to AdvisorAnalyst.com notifications
Watch. Listen. Read. Raise your average.