by John Lynch, Chief Investment Strategist, LPL Research
Melt-up or Melt-Down?
KEY TAKEAWAYS
- Friday’s sharp stock market decline might have led us to forget that just a few days ago many claimed the stock market was melting up.
- Now concerns have turned to whether last week’s sell-off is the start of something much bigger.
- We discuss whether stocks have melted up or if they are about to melt-down, and share some thoughts on the sharp move higher in interest rates.
Did stocks just melt-up, setting up a possible melt-down? Friday’s sharp decline, the biggest since the Brexit vote in June 2016, might have led us to forget that just a few days ago many claimed the stock market was melting up. The strong finish to 2017 followed by big gains in January certainly made this a reasonable characterization. (Though we continue to believe stock valuations are well supported by fundamentals here.)
Concerns have now turned to whether last week’s sell-off is the start of something much bigger, or dare we say a meltdown. This week we discuss whether stocks have melted up or if they are about to melt-down.
DID STOCKS JUST MELT-UP?
There is no standard definition of a melt-up, a phrase used to describe a sharp and swift move higher in the stock market (think late 1990s). The logical implication of a melt-up is that stocks are stretched and poised to fall. Our friends at Strategas Research Partners have defined a melt-up as a top five percentile rally in the S&P 500 Index within six months when the index is at new highs. Based on data back to 1985, the top five percentile of 6-month performance for the S&P 500 is 21%. The recent peak in 6-month rolling S&P 500 performance, on January 26, 2018, was 16%, well short of that breakpoint.
Even if we assume stocks just melted up, it does not preclude further gains. Using the melt-up definition above, the S&P 500 experienced 13 of them since the mid-1980s. If you bought the S&P 500 on all of those melt-up dates, you generally ended up doing well. The S&P 500 was up an average of 4% six months after those melt-up dates (median +6%) with gains 75% of the time. And over the next year, the S&P 500 was up an average of 6% (median also 6%) with gains two-thirds of the time. The exceptions were in 1987 and 2007, environments that bear little resemblance to today in our opinion.
ARE STOCKS MELTING DOWN?
Just one week after a possible melt-up peak, Friday’s 2.1% loss for the S&P 500 (and ominous 666-point Dow drop) has sparked fears of a melt-down. After a record run, more volatility is to be expected. The S&P 500 just set the all-time record for trading days without a 5% correction, breaking the 1990s record. (The count is now over 400 and the current pullback is at 3.9% through Friday’s close.) The S&P 500 generated a positive return every month last year for the first time ever. Although the S&P 500 endured two 1% or more drops last week, the 113-day streak without one through January 29, 2018, was the longest since the mid-1980s. Finally, January was one of the best starts to a year ever.
Despite all of that record breaking, we do not see the makings of a significant market top or a possible melt-down:
- Breadth is healthy. The percentage of stocks at new highs recently reached a five-year high while a healthy percentage of stocks are in uptrends — about 80% of stocks in the S&P 500 have 50-day moving averages above their 200-day averages even after last week’s decline.
- Credit spreads are tight. Despite the rise in yields, credit spreads remain well behaved. We do not expect spreads to widen meaningfully this year because of improving economic growth and strong expected gains in corporate profits.
- Deal activity is muted. At a bull market top, one would expect heightened levels of merger and acquisition (M&A) and initial public offering (IPO) activity. M&A and IPO activity are historically low and below the pace of two years ago.
- Earnings revisions are very strong. Earnings estimates are experiencing very strong positive revisions. S&P 500 earnings estimates have increased by more than 5% year to date, bolstered by the new tax law, accelerating global growth, and a weaker U.S. dollar.
- Speculation does not appear excessive. Investor surveys such as that from the American Association of Individual Investors (AAII) are optimistic but not off the charts. Equity inflows have been subdued overall.
We do not see the makings of a significant stock market top or major downturn and continue to believe stocks are well supported by fundamentals.
Factoring all of this in, we do not see the makings of a significant stock market top or major downturn and continue to believe stocks are well supported by fundamentals. We expect global growth to accelerate this year, led by a pickup in U.S. growth. Corporate America is in excellent shape, with profits poised for a potential mid-teens increase in 2018, supported by the new tax law. Stock valuations remain well supported by low interest rates despite the latest jump in Treasury yields, and inflation remains well contained.
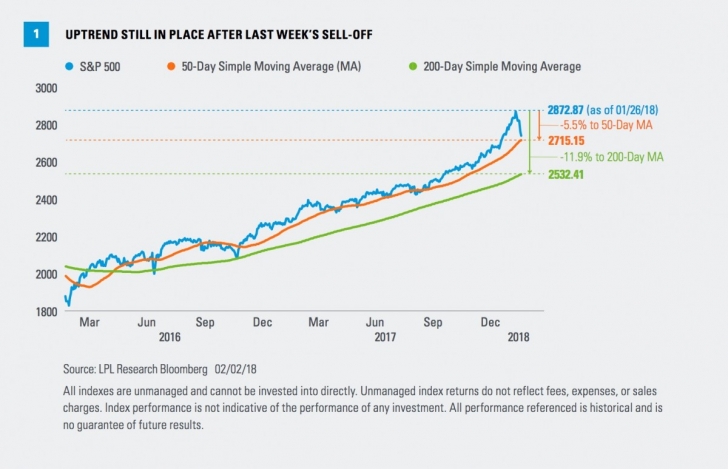
Bottom line, we believe the latest downdraft in equities appears to be an emerging buy-the-dip opportunity rather than the start of a significant sell-off. Keep in mind, a 5% drop in the S&P 500 still puts the index slightly above its 50-day moving average, while even a 10% correction could leave the index above its 200-day moving average [Figure 1].
QUICK THOUGHTS ON THE JUMP IN YIELDS
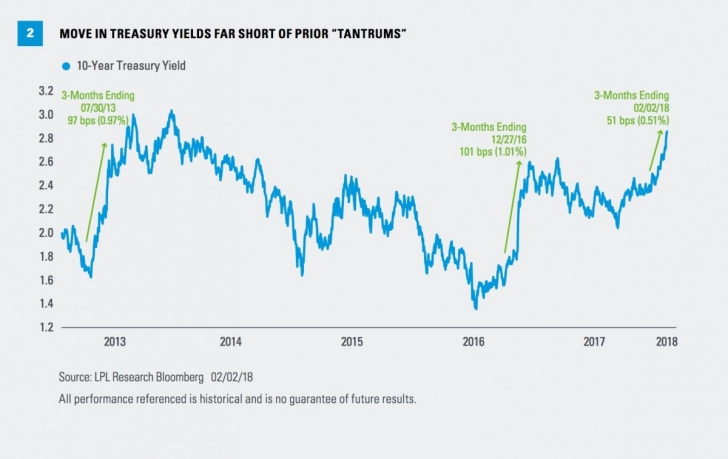
Regarding the latest bond market sell-off, we would point out that the 10-year yield, at 2.85%, remains well within our 2.75–3.25% forecast for year-end. As shown in Figure 2, the roughly 50 basis point (0.50%) jump in rates over the past three months is still well short of the swift 1% moves over 90 days in 2013 (the “taper tantrum”) and 2016 (presidential election). By historical standards, rates around 3% are still low and should not noticeably impair economic activity.
The wage increase (2.9%) in Friday’s jobs report spooked some market participants and some volatility is to be expected as markets price in more Federal Reserve (Fed) rate hikes and digest higher interest rates. But typically wage gains need to be 4% or higher before inflation and the Fed become a real challenge for stocks. Also encouraging, the yield curve steepened last week despite the volatility in markets, a positive economic growth signal going forward.
Finally, stocks have proven historically that they can rise along with bond yields at these — or even higher levels.
CONCLUSION
Whether stocks have experienced a melt-up or not is open to debate. But there is no doubt stocks have experienced record-breaking gains and tranquility over the past 12 months, and a pullback was overdue. While we do not know how much longer this sell-off will last, we believe stocks are well supported here by economic and earnings fundamentals. Despite the latest rise, interest rates remain historically low and within the range of our expectations. Wage pressures are not sufficient in our view to significantly change the Fed’s plans this year. We see the potential for further gains for stocks over the remainder of 2018 and maintain our fair value S&P 500 range of 2850–2900.
LPL Research also expects the 10-year Treasury yield to end 2018 in the 2.75–3.25% range, based on its expectations for a modest pickup in growth and inflation. Please see the Outlook 2018: Return of the Business Cycle publication for additional descriptions and disclosures.
*****
IMPORTANT DISCLOSURES
The opinions voiced in this material are for general information only and are not intended to provide specific advice or recommendations for any individual. To determine which investment(s) may be appropriate for you, consult your financial advisor prior to investing. All performance referenced is historical and is no guarantee of future results.
The economic forecasts set forth in the presentation may not develop as predicted and there can be no guarantee that strategies promoted will be successful.
Investing in stock includes numerous specific risks including: the fluctuation of dividend, loss of principal, and potential liquidity of the investment in a falling market.
Government bonds and Treasury bills are guaranteed by the U.S. government as to the timely payment of principal and interest and, if held to maturity, offer a fixed rate of return and fixedprincipal value.
Because of its narrow focus, sector investing will be subject to greater volatility than investing more broadly across many sectors and companies.
Bonds are subject to market and interest rate risk if sold prior to maturity. Bond values and yields will decline as interest rates rise, and bonds are subject to availability and change in price.
All investing involves risk including loss of principal.
DEFINITIONS
The 200-day moving average (MA) is a popular technical indicator which investors use to analyze price trends. It is the security or index’s average closing price over the last 200 days.
INDEX DESCRIPTIONS
The Standard & Poor’s 500 Index is a capitalization-weighted index of 500 stocks designed to measure performance of the broad domestic economy through changes in the aggregate market value of 500 stocks representing all major industries.
The Dow Jones Industrial Average (DJIA) Index is comprised of U.S.-listed stocks of companies that produce other (nontransportation and nonutility) goods and services. The Dow Jones Industrial Averages are maintained by editors of The Wall Street Journal. While the stock selection process is somewhat subjective, a stock typically is added only if the company has an excellent reputation, demonstrates sustained growth, is of interest to a large number of investors, and accurately represents the market sectors covered by the average. The Dow Jones averages are unique in that they are price weighted; therefore, their component weightings are affected only by changes in the stocks’ prices.
Copyright © LPL Research


