


by Frank Holmes, CIO, CEO, U.S. Global Investors
The price of gold and gold mining stocks were very competitive in 2017. The yellow metal ended the year up a little more than 13 percent—its best year since 2010—while gold stocks, as measured by the NYSE Arca Gold Miners Index, gained more than 11 percent. All of this occurred even as large-cap stocks regularly closed at all-time highs and cryptocurrencies invited massive speculation.
We can thank the Fear Trade for much of gold’s performance last year. The Fear Trade, of course, is driven by low to negative real interest rates—when inflation erodes away at government bond yields—deficit spending, a weaker U.S. dollar and geopolitical uncertainty.
I believe these forces will only intensify in 2018. With inflation finally showing green shoots and President Donald Trump’s $1.5 trillion tax reform law expected to increase deficit spending, this year could provide the right conditions to spur gold prices higher.
The risks inherent in the Federal Reserve’s monetary policy tightening is a good place to start.
Beware the Rate Hike Cycle?
Since the Fed lifted rates last month, gold has behaved just as it did following the last two December rate hikes—that is, it’s begun to appreciate. On the final trading day of 2017, gold broke above $1,300 an ounce, a psychologically important level, and has since climbed an additional 1 percent. This is the first year since 2013, in fact, that gold has started the year above $1,300.
We’ve seen this movie before. In July 2016, the yellow metal peaked close to $1,370 an ounce, a 29 percent surge since the December 2015 rate hike. (If you remember, this represented gold’s best first half of the year since 1974.) And in September 2017, it topped out around $1,360, up close to 18 percent since the December 2016 rate hike.
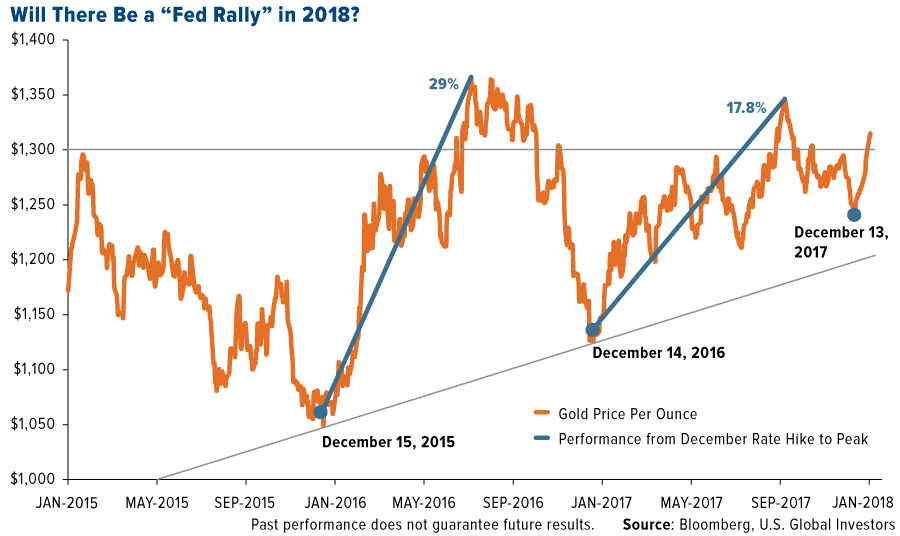
So will we see a “Fed rally” in 2018 as well? Obviously nothing is guaranteed, but let’s say gold were to follow a similar trajectory this year as it did in 2016 and 2017. That would put gold somewhere between $1,460 and $1,600 an ounce by summer. These are prices we haven’t seen in four years.
I think it’s also worth pointing out in the chart above that support looks good for gold. For the past couple of years, it’s steadily posted higher lows.
But wait—shouldn’t rate hikes put a damper on gold prices? Gold, as I’ve discussed many times before, has typically thrived in a low-rate environment since it’s a non-yielding asset. What’s really happening here?
I’ll let Jim Rickards, editor of Strategic Intelligence, field this question. In a recent Daily Reckoning article titled “The Next Great Bull Market in Gold Has Begun,” Jim explains that the market is looking beyond the rate hike and “asking what comes next.”
After all, the December rate hikes in 2015, 2016 and 2017 were all advertised well in advance by the Fed and were fully discounted by the market. This means that the rate hike was a nonevent, because gold was already priced for it.
Yet the rate hike itself and the Fed’s commentary suggest both a headwind for economic growth and possible Fed ease in the form of future inaction and forward guidance relative to expectations.
Gold markets, in other words, could be forecasting slower economic growth as a result of higher borrowing costs. You might not agree with Jim here, and I’m not asking you to. After all, the U.S. economy is humming right now. Consumer spending is up, optimism is high and we have a robust labor market with unemployment at a 17-year low of 4.1 percent. Many people expect the Trump tax cuts to prompt multinational corporations to bring home cash that’s been held overseas, lift wages and boost capex spending.
At the same time, we can’t ignore the historical implications of past rate hike cycles. I shared with you last month that in the past 100 years, only three such cycles out of at least 18 didn’t end in a recession.The current cycle could turn out to be just as benign, but that would make it a huge exception, not the norm.
U.S. Yield Curve Flattens to Level Not Seen Since 2007
Then there’s the flattening yield curve. The yield curve is said to “flatten” when the difference between the two-year Treasury yield and 10-year Treasury yield starts to tighten. As of today, that spread drew up to around 0.496 percentage points, its flattest level since October 2007.
This measure is worth watching because it’s often seen as one of the most reliable “canary in the coal mine” predictors of recession. The past seven U.S. recessions were directly preceded by an inverted yield curve—that is, when short-term yields rose above long-term yields.
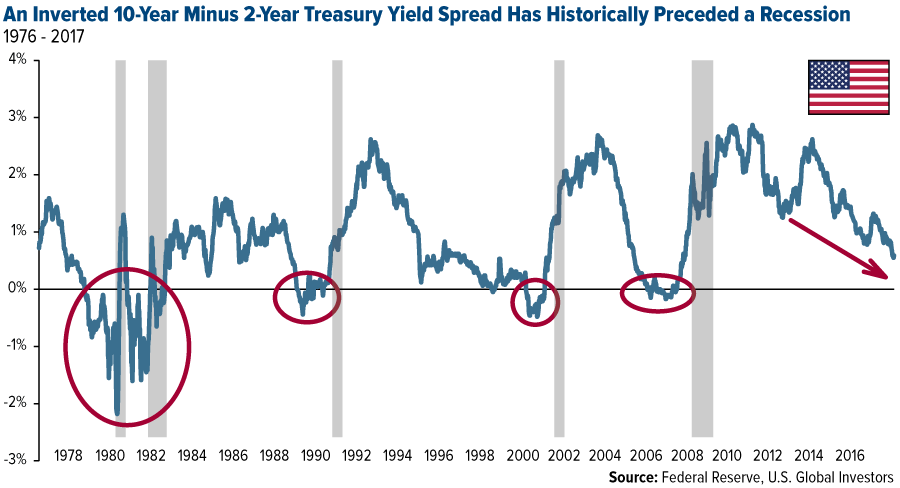
To be clear, we still have a way to go before the yield spread inverts. But if this observation concerns you—if you believe the business cycle is in fact getting a little long in the tooth—it might make sense to ensure you have a 10 percent weighting in gold bullion and high-quality gold mutual funds and ETFs.
Inflation Could Be a Lot Hotter Than We Realize
Another factor that’s driven gold prices in the past is inflation. When the cost of living has eaten away at government bond yields, investors have tended to seek more attractive stores of value, including gold. This is at the heart of gold’s Fear Trade.
The problem is that inflation has been sluggish lately—if we’re using the official consumer price index (CPI). In 2017, the CPI just barely met the Fed’s 2 percent target rate. Many economists had expected prices to start creeping up last year in response to President Trump’s nationalist “America first” agenda, complete with new tariffs, strong crackdown on illegal immigration, cancellation of U.S. participation in the Trans-Pacific Partnership (TPP) and a renegotiation of the North American Free Trade Agreement (NAFTA). So far these policies haven’t had much effect on inflation.
But what’s the “real” inflation? Which gauge should we be looking at? Again, the CPI doesn’t show much movement.
The underlying inflation gauge (UIG), however, tells a different story.
The UIG, introduced only last year by the New York Fed, is a much broader measure of inflation than the CPI. It includes not just consumer prices but also producer prices, commodity prices and financial asset prices.
When we use this dataset, we find that—surprise!—inflation is not as subdued as we initially thought. Whereas the November CPI came in at 2.2 percent, the UIG heated up to 3 percent, its highest reading since August 2006.
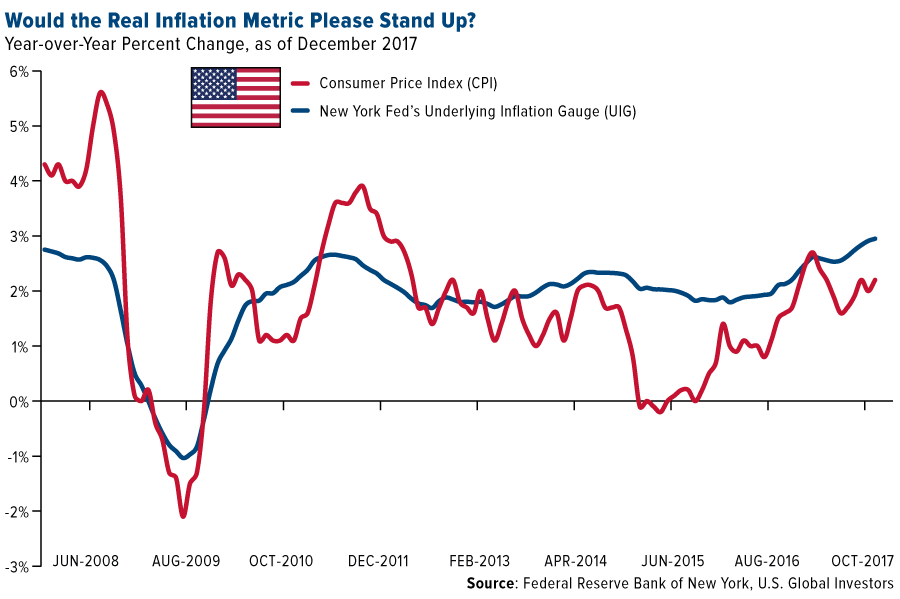
The implications here are huge. Three percent is higher than the five-year Treasury yield, currently around 2.3 percent, and the 10-year yield, about 2.5 percent. It’s even higher than the 30-year Treasury yield at 2.8 percent!
But there are even more ways to measure inflation, and some show it being higher than the UIG. Economist John Williams runs a website called Shadow Government Statistics, where you can find, among other “alternate” datasets, current inflation rates as is they were calculated the way the U.S. government did pre-1980. Note the huge bifurcation between the official CPI and alternate 1980-based CPI. According to the alternate gauge, consumer prices in November rose close to 10 percent year-over-year, or 7.75 percentage points more than the CPI.
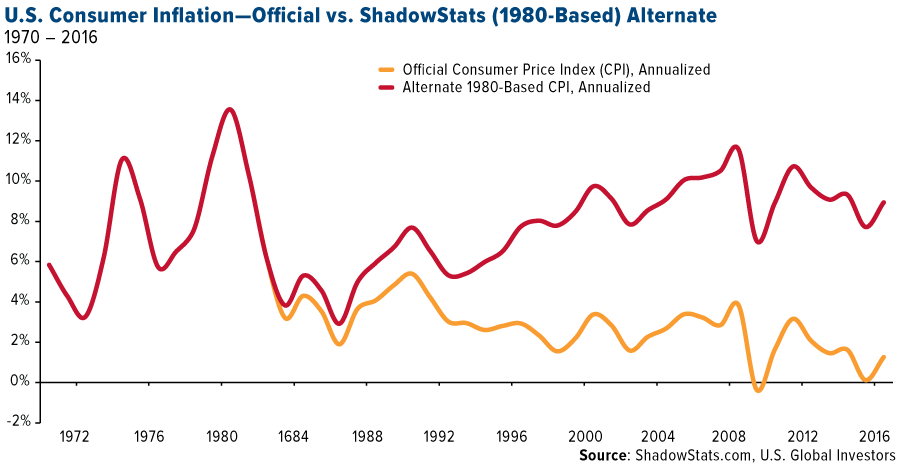
“In general terms,” Williams writes, “methodological shifts in government reporting have depressed reported inflation, moving the concept of the CPI away from being a measure of the cost of living needed to maintain a constant standard of living.”
So which metric do you believe? The official CPI? The 1980-based CPI? The broader UIG? If it’s one of the last two, you have to ask yourself why you would lock your money up for five years, 10 years or even 30 years in a government bond that fails to keep up with real inflation. The investment case for gold suddenly becomes very attractive.
Interested in learning more? Be sure to check out these 10 charts that show why I think gold is undervalued right now!
All opinions expressed and data provided are subject to change without notice. Some of these opinions may not be appropriate to every investor. By clicking the link(s) above, you will be directed to a third-party website(s). U.S. Global Investors does not endorse all information supplied by this/these website(s) and is not responsible for its/their content.
The NYSE Arca Gold Miners Index (GDM) is a modified market capitalization weighted index comprised of publicly traded companies primarily involved in the mining of gold and silver in locations around the world.
The consumer price index (CPI) is a measure of the variation in prices paid by typical consumers for retail goods and other items.
The underlying inflation gauge (UIG) captures sustained movements in inflation from information contained in a broad set of price, real activity, and financial data.
This post was originally published at Frank Talk.
Copyright © U.S. Global Investors