
by Peter Wilke, Senior Vice President – Head of Tactical Asset Allocation, Northern Trust
KEY POINTS
- What it is - We examine gold’s strong 2025 performance and its evolution from a “Golden Constant” store of value into a dynamic portfolio asset.
- Why it matters - Gold may hedge against inflation and geopolitical risk, and surveys indicate that investors are under-allocated.
- Where it's going - In an increasingly fragile world, the gold has taken on a more strategic role.
In a year of strong financial market returns, few assets have stood out more than gold. Across centuries, Gold has transformed from a static store of value — the “Golden Constant” — into a dynamic portfolio asset. Historically, gold underpinned global currencies, with governments pegging fiat to bullion for credibility. This changed in 1971 when former U.S. President Nixon ended the gold standard, liberating the metal. Since then, gold has delivered an impressive annualized return of around 7%, warranting a new moniker: the “Golden Ascent.”
Initially, gold surged as a hedge against stagflation post-Bretton Woods. While developed market central banks spent decades reducing their reserves, new sources of demand emerged, such as gold-backed exchange-traded funds (ETFs) that democratized retail access. A structural break occurred following Russia’s invasion of Ukraine. The subsequent freezing of Russia’s central bank reserves sent a stark message to the world: in a system where Western financial assets can be weaponized, gold remains one of the few sanction-proof markets. With slow mining supply and complex demand dynamics, price movements defy historical models. Non-linear trends and past bubbles suggest another may be forming, though fundamentals can justify current valuations.
Despite its physical scarcity, available gold is valued at roughly one-quarter of global equities, underscoring its unique asset class status. Future potential demand catalysts include gold-backed stablecoins, African gold standards, and regulatory reclassification for banks and insurers. China’s continued diversification and insurance sector adoption further support structural demand.
Gold’s low correlation to stocks and bonds enhances portfolio efficiency. Historical risk-return analysis suggests that an allocation in the range of 8–10% could enhance portfolio efficiency, with higher allocations warranted during periods of elevated volatility or inflation. Current investor surveys reveal widespread under-allocation. Gold’s ultimate utility lies in hedging “fat tail” risks — deep dollar weakness or severe geopolitical shocks, such as U.S.-China conflict. In an increasingly fragile world, the Golden Constant has taken on a more strategic role.
Heading into 2026, our tactical portfolio maintains a risk-on tilt, favoring equities over fixed income. Equity positioning is constructive across major regions, and we also maintain an overweight to global listed infrastructure. We continue to believe that the corporate profit growth story is more compelling than the search for yield.
— Peter Wilke, CFA – Head of Tactical Asset Allocation, Global Asset Allocation
A GOLD RUSH
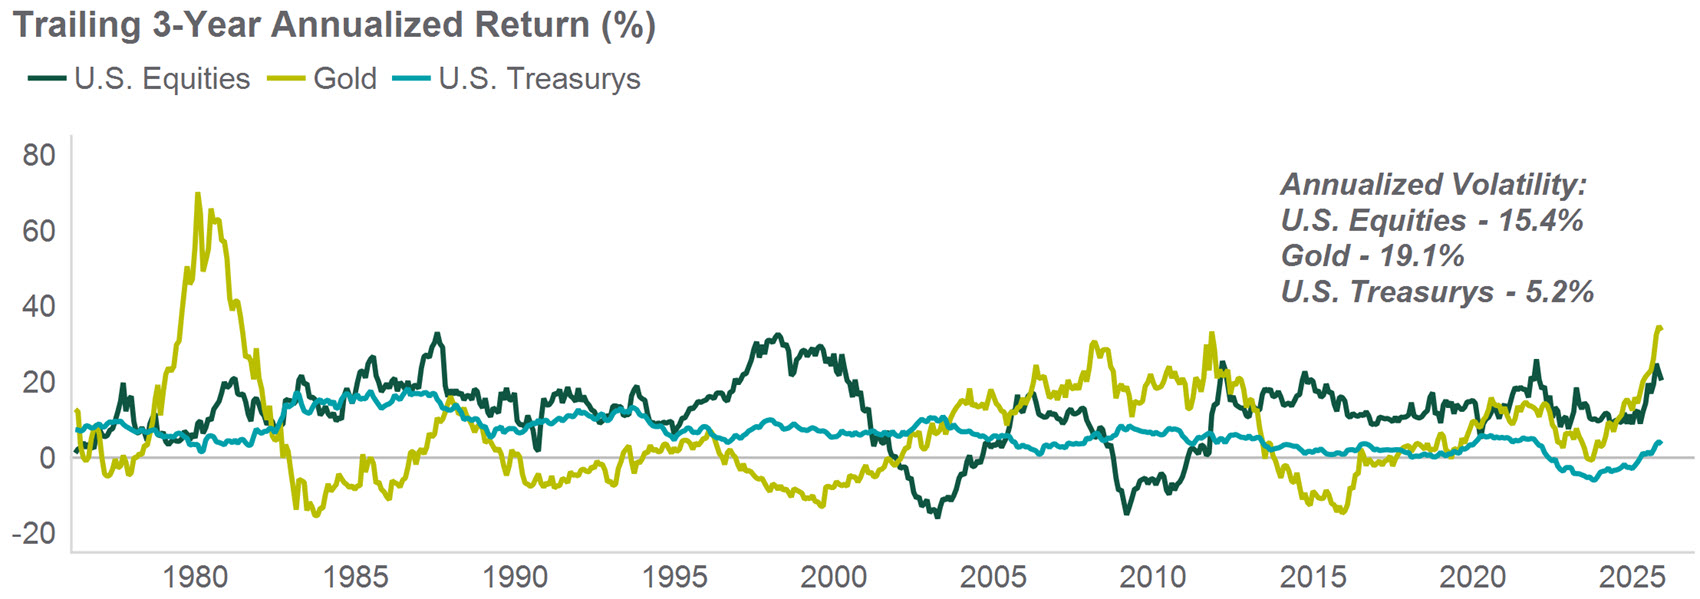
Source: Northern Trust Asset Management, Macrobond, Bloomberg. Monthly data from March 1973 through November 2025. Indexes used: S&P 500 (U.S. Equities), World Gold (Gold) and Bloomberg U.S. Treasurys (U.S. Treasurys). Past performance is not indicative or a guarantee of future results. Index performance returns do not reflect any management fees, transaction costs or expenses. It is not possible to invest directly in any index.
Interest Rates
After announcing the end of quantitative tightening (QT, or balance sheet reduction) at the October meeting, the Fed took subsequent action on monetary policy implementation at the December meeting. Reserve Management Purchases (RMPs) will be used to add reserves into the system via buying $40 billion of T-Bills per month. This is in addition to the $15 billion per month in MBS proceeds also being reinvested in T-Bills. With the aggregate level of reserves already at the tipping point between “abundant” and “ample”, and seasonal demand for reserves expected to increase around year-end and into Tax Day, it was judged as appropriate to mitigate that pressure via RMPs.
While we see no implications for the stance of monetary policy as a result of the decision to implement RMPs, we did see prices for T-Bills increase in response to the announcement of RMPs. In addition to the T-Bill market, we also see downward pressure on other money market rates, like repo, as a result of RMPs. This should alleviate much of the concern around year-end disruptions in the funding markets. While we’ve written extensively on balance sheet policy over the past year, RMPs may usher in a quieter period for balance sheet policy in 2026.
— Dan LaRocco, Head of U.S. Liquidity, Global Fixed Income
RESERVE MANAGEMENT
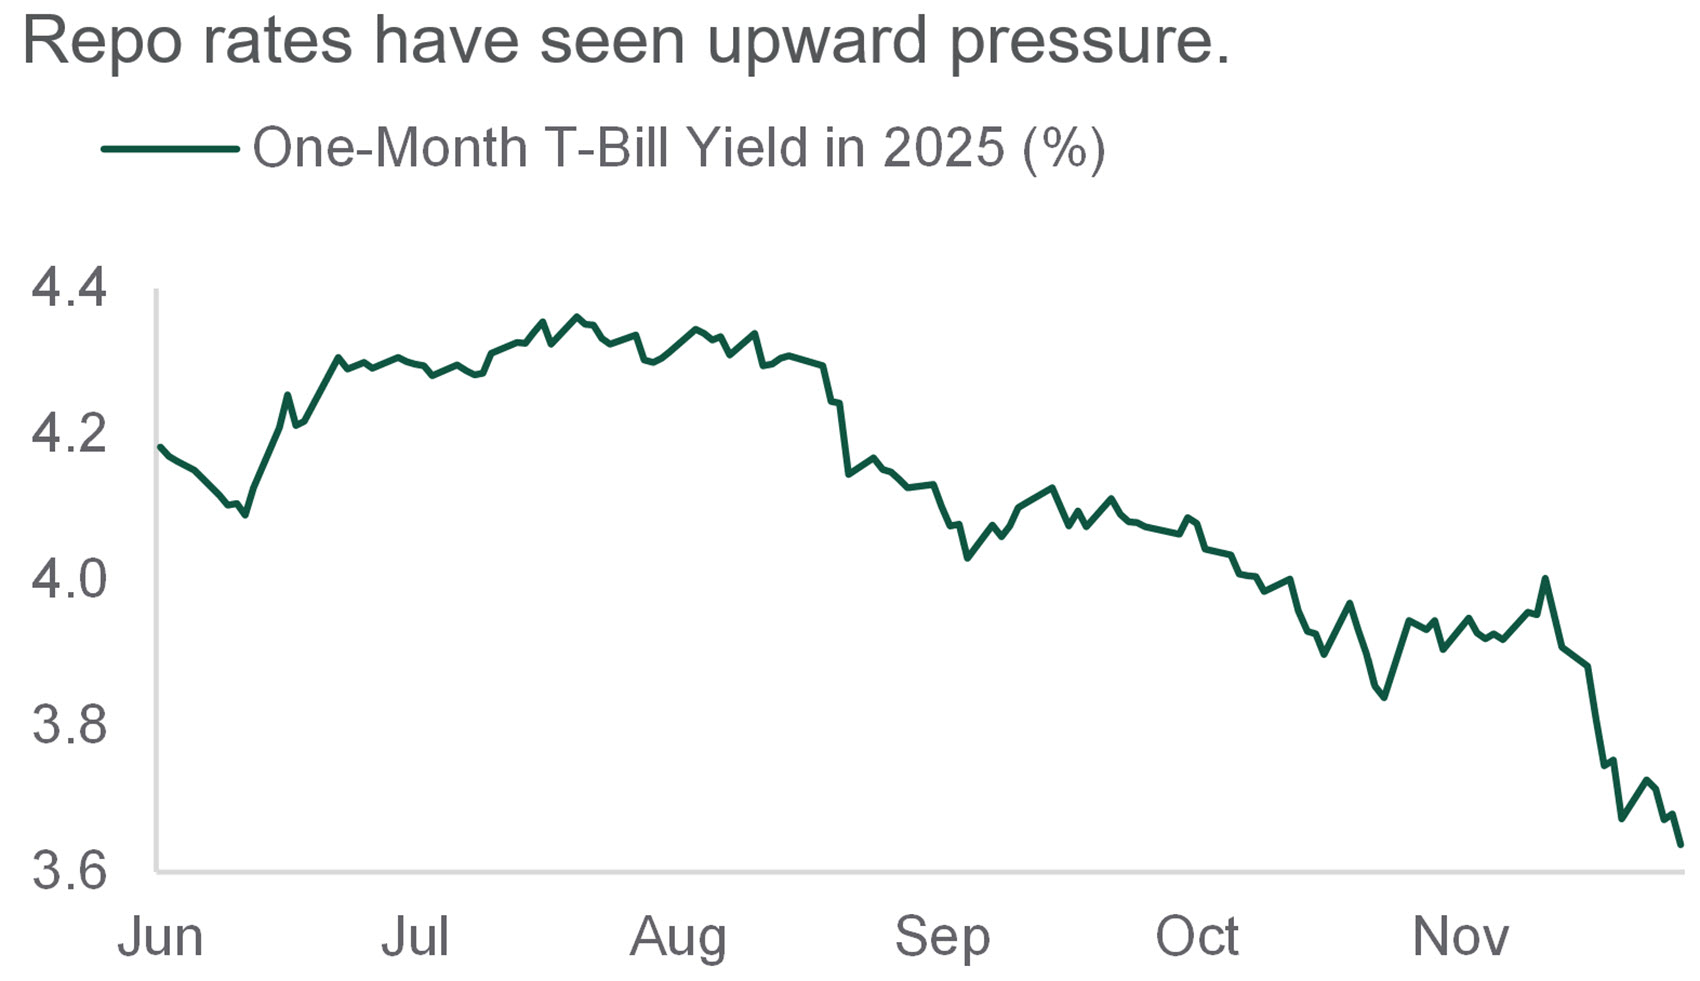
Source: Northern Trust Asset Management, Bloomberg. T-Bill = Treasury Bill. Data from 6/16/2025 through 12/12/2025. Historical trends are not predictive of future results.
- Reserve Management Purchases (RMPs) will be used to mitigate pressure in repo and money markets.
- The Fed will be buying $40 billion of T-Bills per month in addition to the $15 billion per month in MBS proceeds also being reinvested in T-Bills.
- While we don’t see any implications for monetary policy, RMPs will likely bias money market rates lower within the target range.
Credit Markets
After resolution of the longest government shutdown in U.S. history, November’s market narrative was dominated by concerns of an artificial intelligence (AI) “bubble”, driving volatility across risk assets. Against this backdrop, credit markets still generated positive returns. Within high yield bonds, modest spread widening early in the month gave way to a late-month rally, with index spreads declining 12 bps month-over-month.
Despite strong high yield returns year-to-date, there could still be room for seasonal outperformance. January has historically delivered outsized returns: the average high yield bond return over the past 39 years of +1.6% exceeds other months by about 1 percentage point. Since 1987, high yield returns have been positive 85% of the time in January. While January is typically the best month for high yield, the 30-day stretch from mid-December to mid-January averages +1.9%, more than triple a typical 30-day period. Recall, high yield bonds posted a -0.4% loss in December 2024 as the Fed delivered a hawkish cut, followed by a +1.5% gain in January.
— Ben McCubbin and Sau Mui, Co-Heads of High Yield
THE JANUARY EFFECT
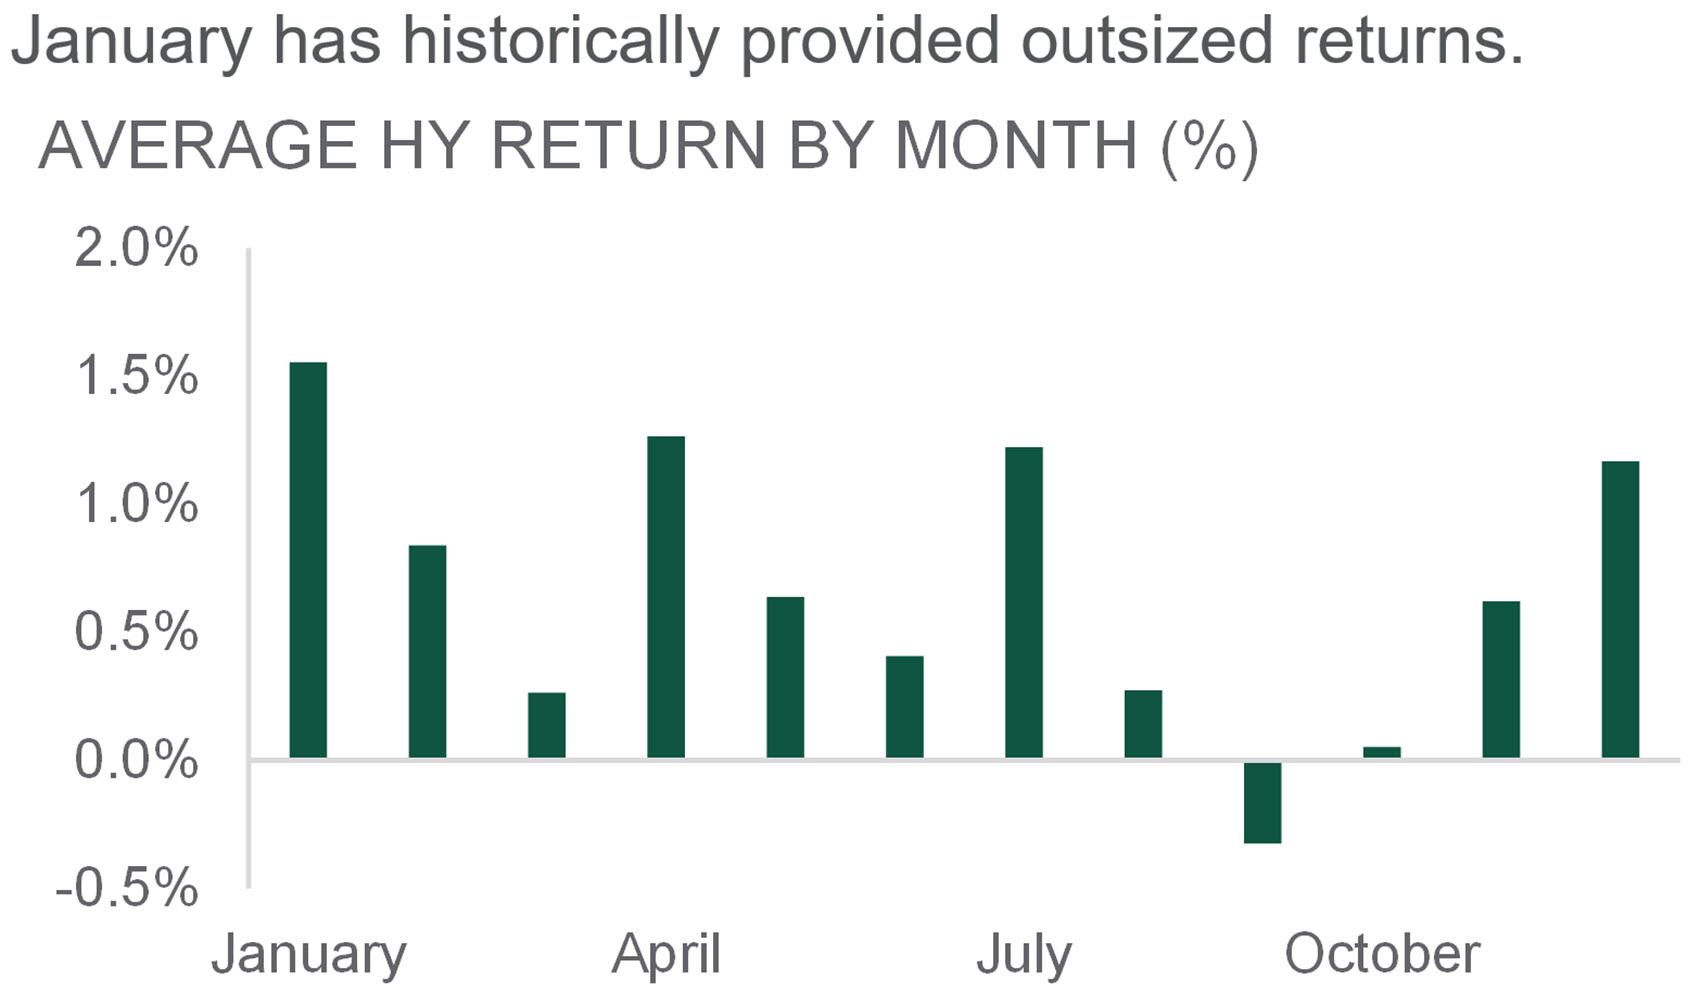
Source: J.P. Morgan. Data from 1987 through 2024. HY = High Yield. Historical trends are not predictive of future results.
- Despite the strong high yield returns year-to-date , there could still be room for outperformance from a seasonal perspective.
- January’s average high yield bond return over the past 39 years of +1.6% exceeds the average for all other months by about 1 percentage point.
- Since 1987, high yield returns have been positive 85% of the time (33 out of 39) in January
Equities
November markets echoed October’s pattern: a sharp mid-month drop followed by recovery. U.S. equities fell 4.5% through November 20 but rebounded to finish flat. Developed ex-U.S. markets gained 1%, while Emerging Markets declined 2.4%, pressured by China’s tech weakness — similar to U.S. trends. Volatility spiked but then eased — a cycle seen throughout 2025. Late November and early December showed broader market participation beyond the Mag. From October-end to December 11, the S&P 500 Equal-Weighted Index rose 3.6%, beating its cap-weighted counterpart by 2.6%. Value stocks led, outperforming Growth by 4.2%. The mid-month sell-off reflected concerns over the AI ecosystem — stretched valuations, circular financing, and rising capex — but rotation toward cyclical equities signaled a better backdrop.
The macro backdrop and fundamentals remain supportive. Valuations are elevated, but earnings expectations have continued to improve across sectors. U.S. equities show 14% forward earnings growth. We favor U.S. equities over bonds as recession risks fade. We also see opportunities in Developed ex-U.S. and Emerging Markets, supported by policy, resilient earnings, and global tech leadership.
— Jordan Dekhayser, Head of Equity Client Portfolio Management
MORE THAN THE MAG 7

Source: Northern Trust Asset Management, MSCI. Data from 12/31/2024 through 12/11/2025. Past performance is not indicative or a guarantee of future results. Index performance returns do not reflect any management fees, transaction costs or expenses. It is not possible to invest directly in any index.
- November saw a sharp mid-month sell-off followed by recovery, with mixed results across regions.
- Leadership broadened beyond mega-cap tech, with value and equal-weighted stocks gaining traction.
- Supportive fundamentals and healthy earnings keep us constructive on global equities.
Real Assets
After decades of moderate (2-3%) earnings per share growth, the utilities sector has entered a new era of expansion, with growth now more than double its historical rate. This acceleration is not a short-term anomaly but the result of powerful structural shifts reshaping global energy demand. The primary drivers of this shift are: 1) the surge in power consumption from tech companies powering cloud computing and AI workloads; 2) the broad-based electrification of transportation and industrial processes; and 3) investment in grid modernization to support increasing electricity loads and resilience.
These transformative trends position utilities at the heart of the energy transition, creating a sustainable growth trajectory. Utilities operate under a regulated framework that enables predictable cash flow growth through rate adjustments. Historically, the sector has delivered lower earnings volatility and superior cash flow visibility compared to the broader equity market. This unique combination of structural growth drivers and defensive characteristics positions utilities as a compelling option for investors seeking capital preservation alongside meaningful upside potential.
— Jim Hardman, Head of Real Assets, Multi-Manager Solutions
SURGE AHEAD
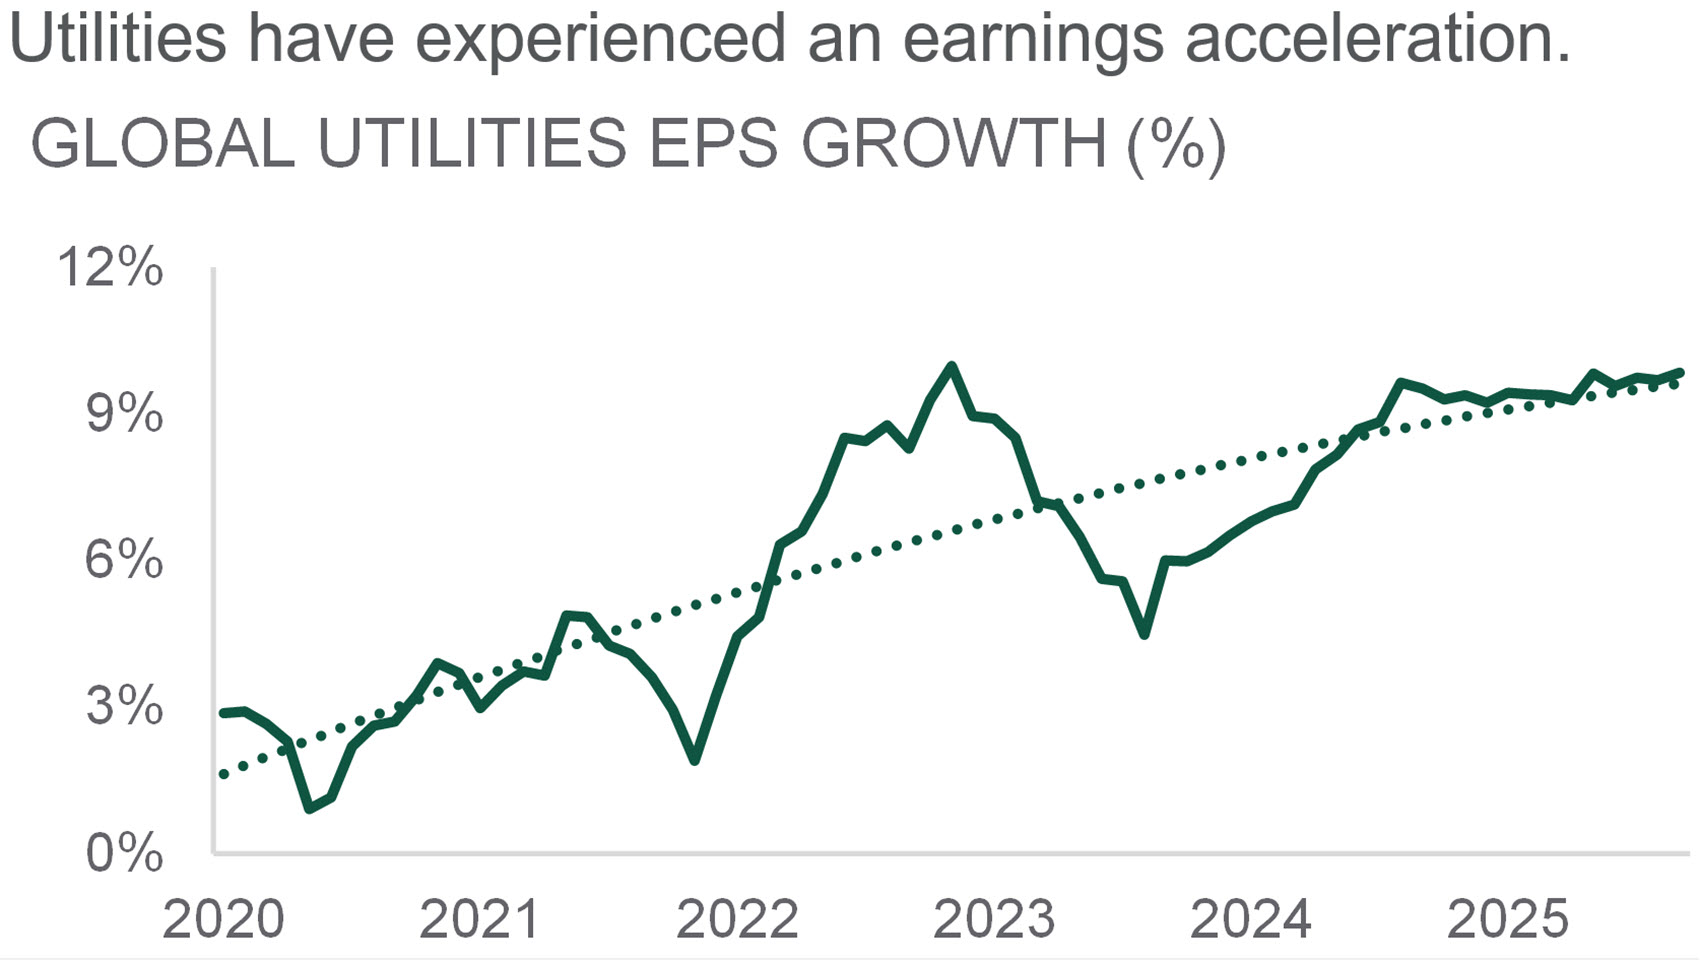
Source: Northern Trust Asset Management, First Sentier Investors. EPS = earnings per share. Data from 3/31/2020 through 11/30/2025. Historical trends are not predictive of future results.
- Global utility earnings growth has doubled over the trailing 5 years due to the growth in global power demand.
- The combination of strong expected earnings and defensive characteristics positions utilities as a compelling option for investors.
- We reaffirmed our tactical overweight to listed infrastructure on compelling fundamentals and strong expected risk-adjusted returns.

Source: Northern Trust Capital Market Assumptions Working Group, Investment Policy Committee. Strategic allocation is based on capital market return, risk and correlation assumptions developed annually; most recent model released 1/15/2025. The model cannot account for the impact that economic, market and other factors may have on the implementation and ongoing management of an actual investment strategy. Asset allocation does not guarantee a profit or protection against a loss in declining markets. GLI = Global Listed Infrastructure, GRE = Global Real Estate, NR = Natural Resources. Unless otherwise noted, the statements expressed herein are solely opinions of Northern Trust. Northern Trust does not make any representation, assurance, or other promise as to the accuracy, impact, or potential occurrence of any events or outcomes expressed in such opinions.
Unless noted otherwise, data is sourced from Bloomberg as of November 2025.