

by BlackRock
Global Investment Outlook
A world transformed by mega forces
The global economy and financial markets are being transformed by mega forces, especially AI. Technology is becoming capital-intensive, and the AI buildout could be unprecedented in both speed and scale. With a few mega forces driving markets, it is hard to avoid making a big call on their direction – and as such, there is no neutral stance, not even exposure to broad indexes.
AI’s buildout is also happening at a potentially unprecedented speed and scale. This shift to capital-intensive growth from capital-light, is profoundly changing the investment environment – and pushing limits on multiple fronts, physical, financial and socio-political.
In recent months, investors have started to fret about equity valuations and whether an AI bubble is forming. Market bubbles have arisen in all major historical transformations – and that could happen again. But those bubbles also grew for some time and only became obvious after they burst. That’s why we seek to reconcile the potential orders of magnitude of investment and returns. That’s our basis for tracking the AI transformation and is what this Outlook aims to do.
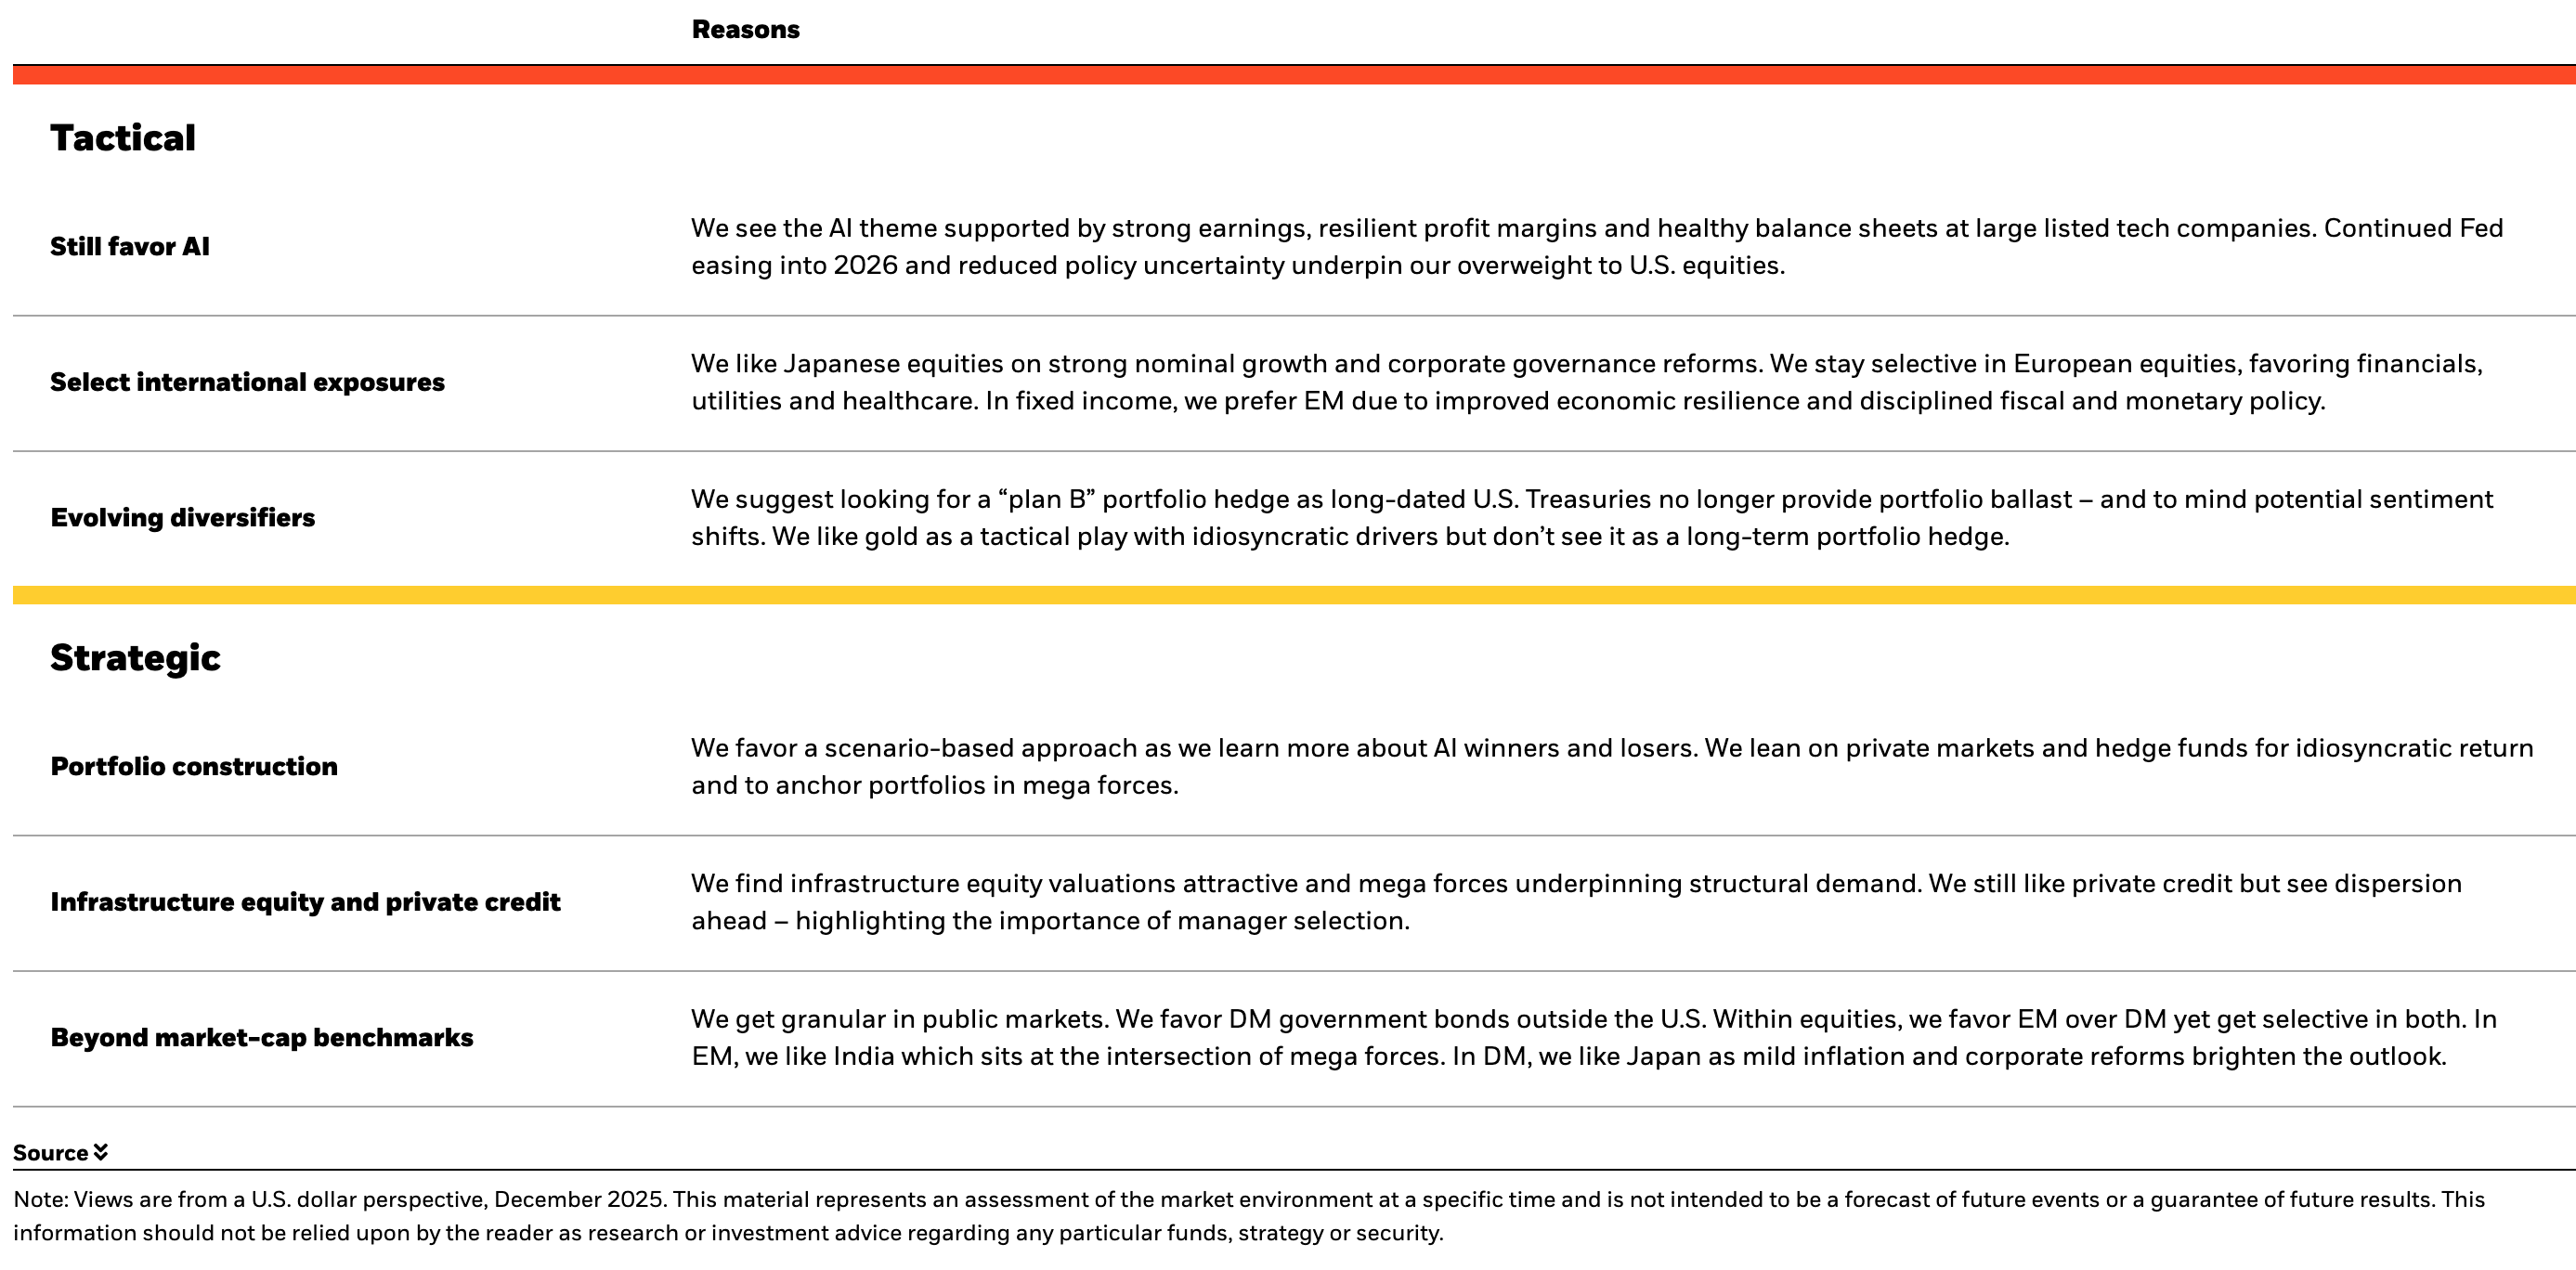
We remain pro-risk and see the AI theme still the main driver of U.S. equities. Yet this environment is ripe for active investing – picking winners and losers from among the builders now and later as AI gains start to spread, in our view.
Clashing orders of magnitude
The challenge for investors is reconciling the huge capital spending plans with their potential AI revenues. Will their orders of magnitude match? This is not a given. The answer depends on whether U.S. growth can break out from its long-term 2% trend. This is a tall order, but AI makes it conceivable for the first time.
The AI buildout requires front-loaded investment for compute, data centers and energy infrastructure. But the eventual revenue from that investment comes later. The gap in time between capex and eventual revenues means AI builders have started using debt to get over a financing “hump.” This frontloading of spending is necessary to realize eventual gains. All this creates a very different investment environment, in our view. Among its core features: higher leverage across the system with a ramp-up in credit issuance across public and private markets.
This investment environment has some core features: higher leverage, a higher cost of capital, concentrated gains for now, more room for alpha and the need for big calls.
A rapid transformation
Length and capital deepening of notable innovations, 1760-2040

Forward-looking estimates may not come to pass. Source: BlackRock Investment Institute with data from Crafts (2021), December 2025. Notes: The chart shows the average annual contribution of capital spending to GDP growth for previous U.S. technologies (except “steam,” for the UK) against the length of time the capital was spent. Estimates for steam, electricity and ICT are taken from Crafts (2021). The spend needed for artificial intelligence (AI) is calculated using realized capital spending between 2022-2024, the upper end of the U.S.$5-8 trillion range of total capital spending intentions spanning the period 2025-2030, and an assumption that capex intensity continues at a similar rate through 2030-2040.
Growth breakout: now conceivable
We see AI capital spending still supporting growth in 2026, with the contribution to U.S. growth from investment totalling three times its historical average this year. This capital-intensive boost is likely to persist into next year, allowing growth to hold up even as the labor market keeps cooling. But will it be enough to break U.S. growth out from its long-term 2% trend? All major innovations of the last 150 years – including steam, electricity and the digital revolution – were not enough for it to break out of this trend.
Yet, it is conceivable for the first time. Why? AI is not only an innovation itself but has the potential to accelerate other innovation. Beyond automating tasks, it would need to learn from itself and improve, in turn, accelerating idea creation and scientific breakthroughs. While conceivable, we don’t know if it will happen. We track evidence that can serve as a leading indicator of faster innovation – for example, a surge in the number of new patents each year – before any benefits start to show up in broader activity data.
Never broken out
U.S. GDP per capita and long-term trend, 1870-2024

Source: BlackRock Investment Institute and Macrohistory Database, December 2025. Note: Historical data compiled by Òscar Jordà, Moritz Schularick, and Alan M. Taylor. 2017. Macrofinancial History and the New Business Cycle Facts. in NBER Macroeconomics Annual 2016, volume 31, edited by Martin Eichenbaum and Jonathan A. Parker. Chicago: University of Chicago Press.
Download the PDF
AI Dominates
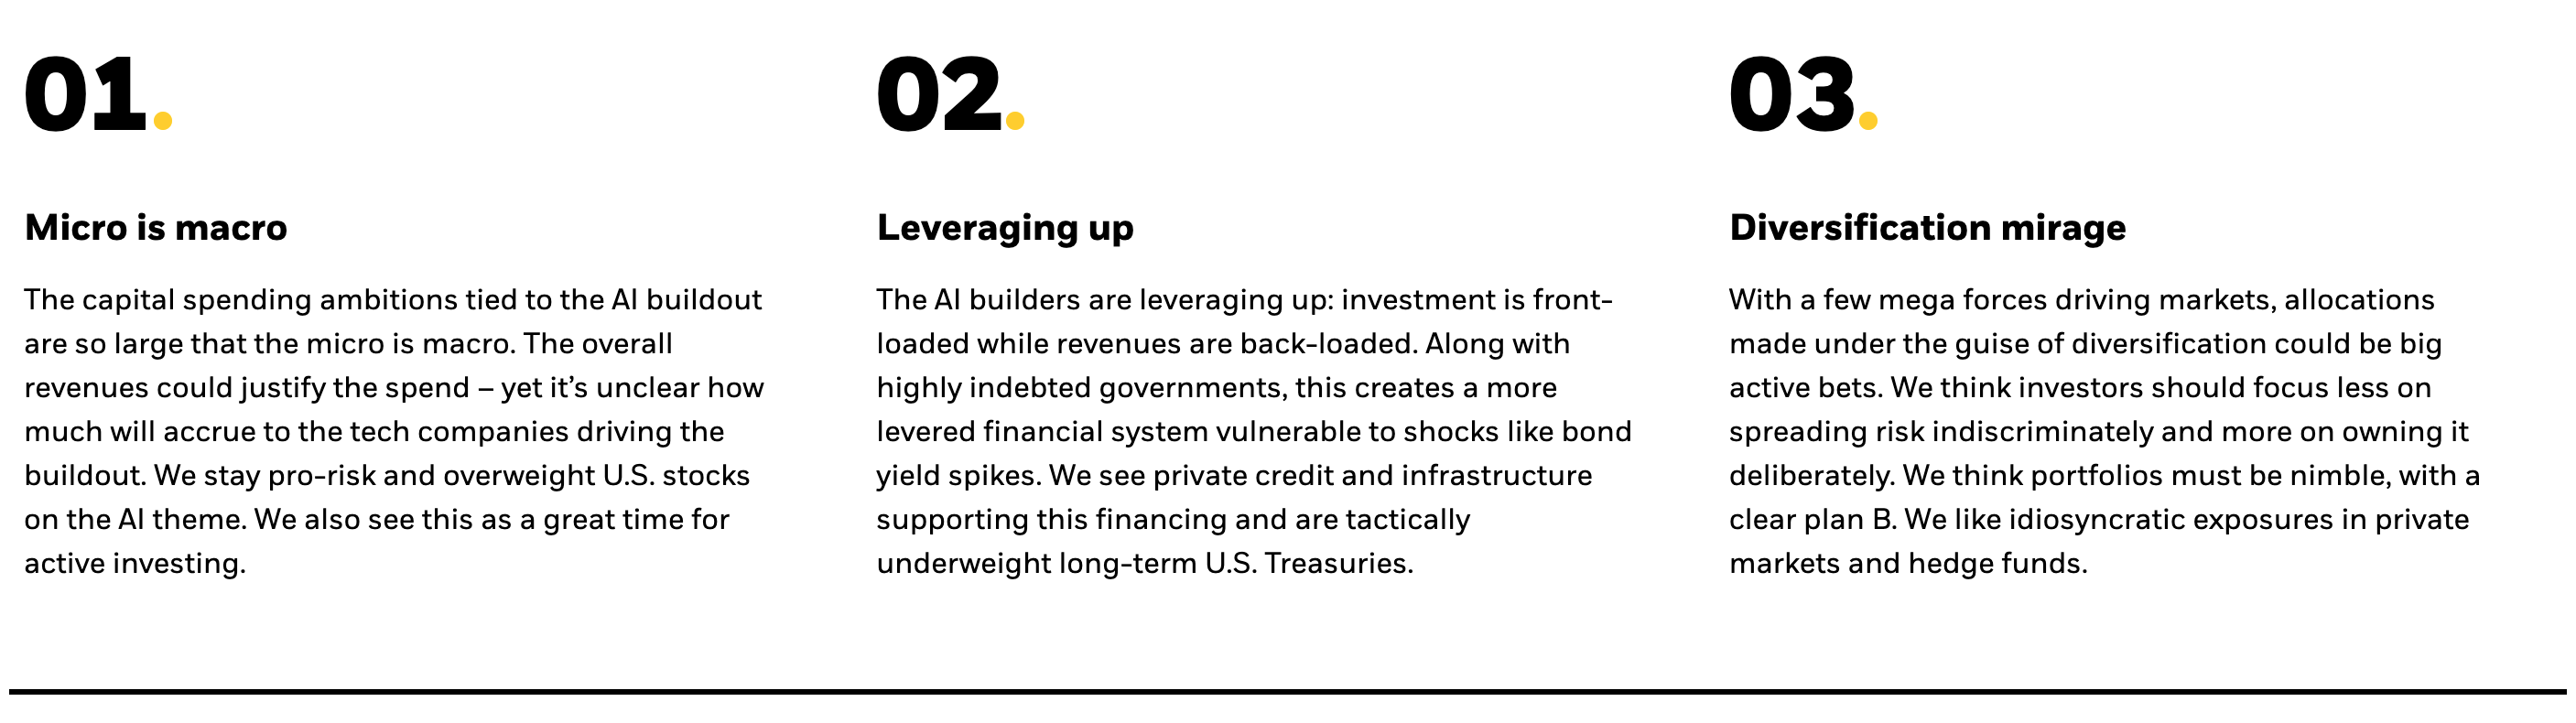
Micro is macro
The AI buildout is dominated by a handful of companies whose spending is so large that it has a macro impact. Taking a view on these companies requires assessing whether the macro math adds up.
As AI becomes embedded in the economy, we expect it to create entirely new pools of revenue in the tech sector and beyond. Where exactly? it’s highly uncertain. But we can still try to gauge the macro size. If AI delivers a 1.5% boost to growth through productivity gains, we estimate that this would expand economy-wide revenues by $1.1 trillion. How this pays off for the tech sector depends on what share of these new revenues they capture. The value chain will cut across sectors and depend on how other sectors monetize their intellectual property with AI. For now, tech companies will grow revenues by taking market share.
We stay risk-on and overweight U.S. stocks on the AI theme but see it becoming an active investment story of identifying new winners as AI revenues spread across the economy.
Doing the math
Estimates of annual U.S. corporate revenue growth through 2030

Forward-looking estimates may not come to pass. Source: BlackRock Investment Institute and Bloomberg, December 2025. Notes: The left bar shows the necessary incremental revenues to be achieved through 2030 (from 2025) to reach a 9-12% lifetime internal rate of return. This is based on data center deployment estimates (GW terms) and capex per GW assumptions reflecting cost inflation, GPU life, phasing and hyperscaler market share. We cross-referenced with other sources including McKinsey, BCG, Berkeley Lab, IEA, U.S. Department of Energy, BloombergNEF, Schneider Electric, EPRI and JLL. These computations include retail revenues growth (Amazon) and other non-data center revenues, which are not driven by BII analysis and are simply the latest Bloomberg consensus estimates. The right bar shows the Bloomberg consensus for the increase in annual revenues over 2025-2030 for U.S. hyperscalers.
Leveraging up
Bridging the AI buildout’s financing hump between front-loaded investment and back-loaded revenues needs long-term financing. That means greater overall leverage in the system is inevitable. This has already started with the AI buildout being increasingly debt funded, as seen from recent bond sales from large tech firms.
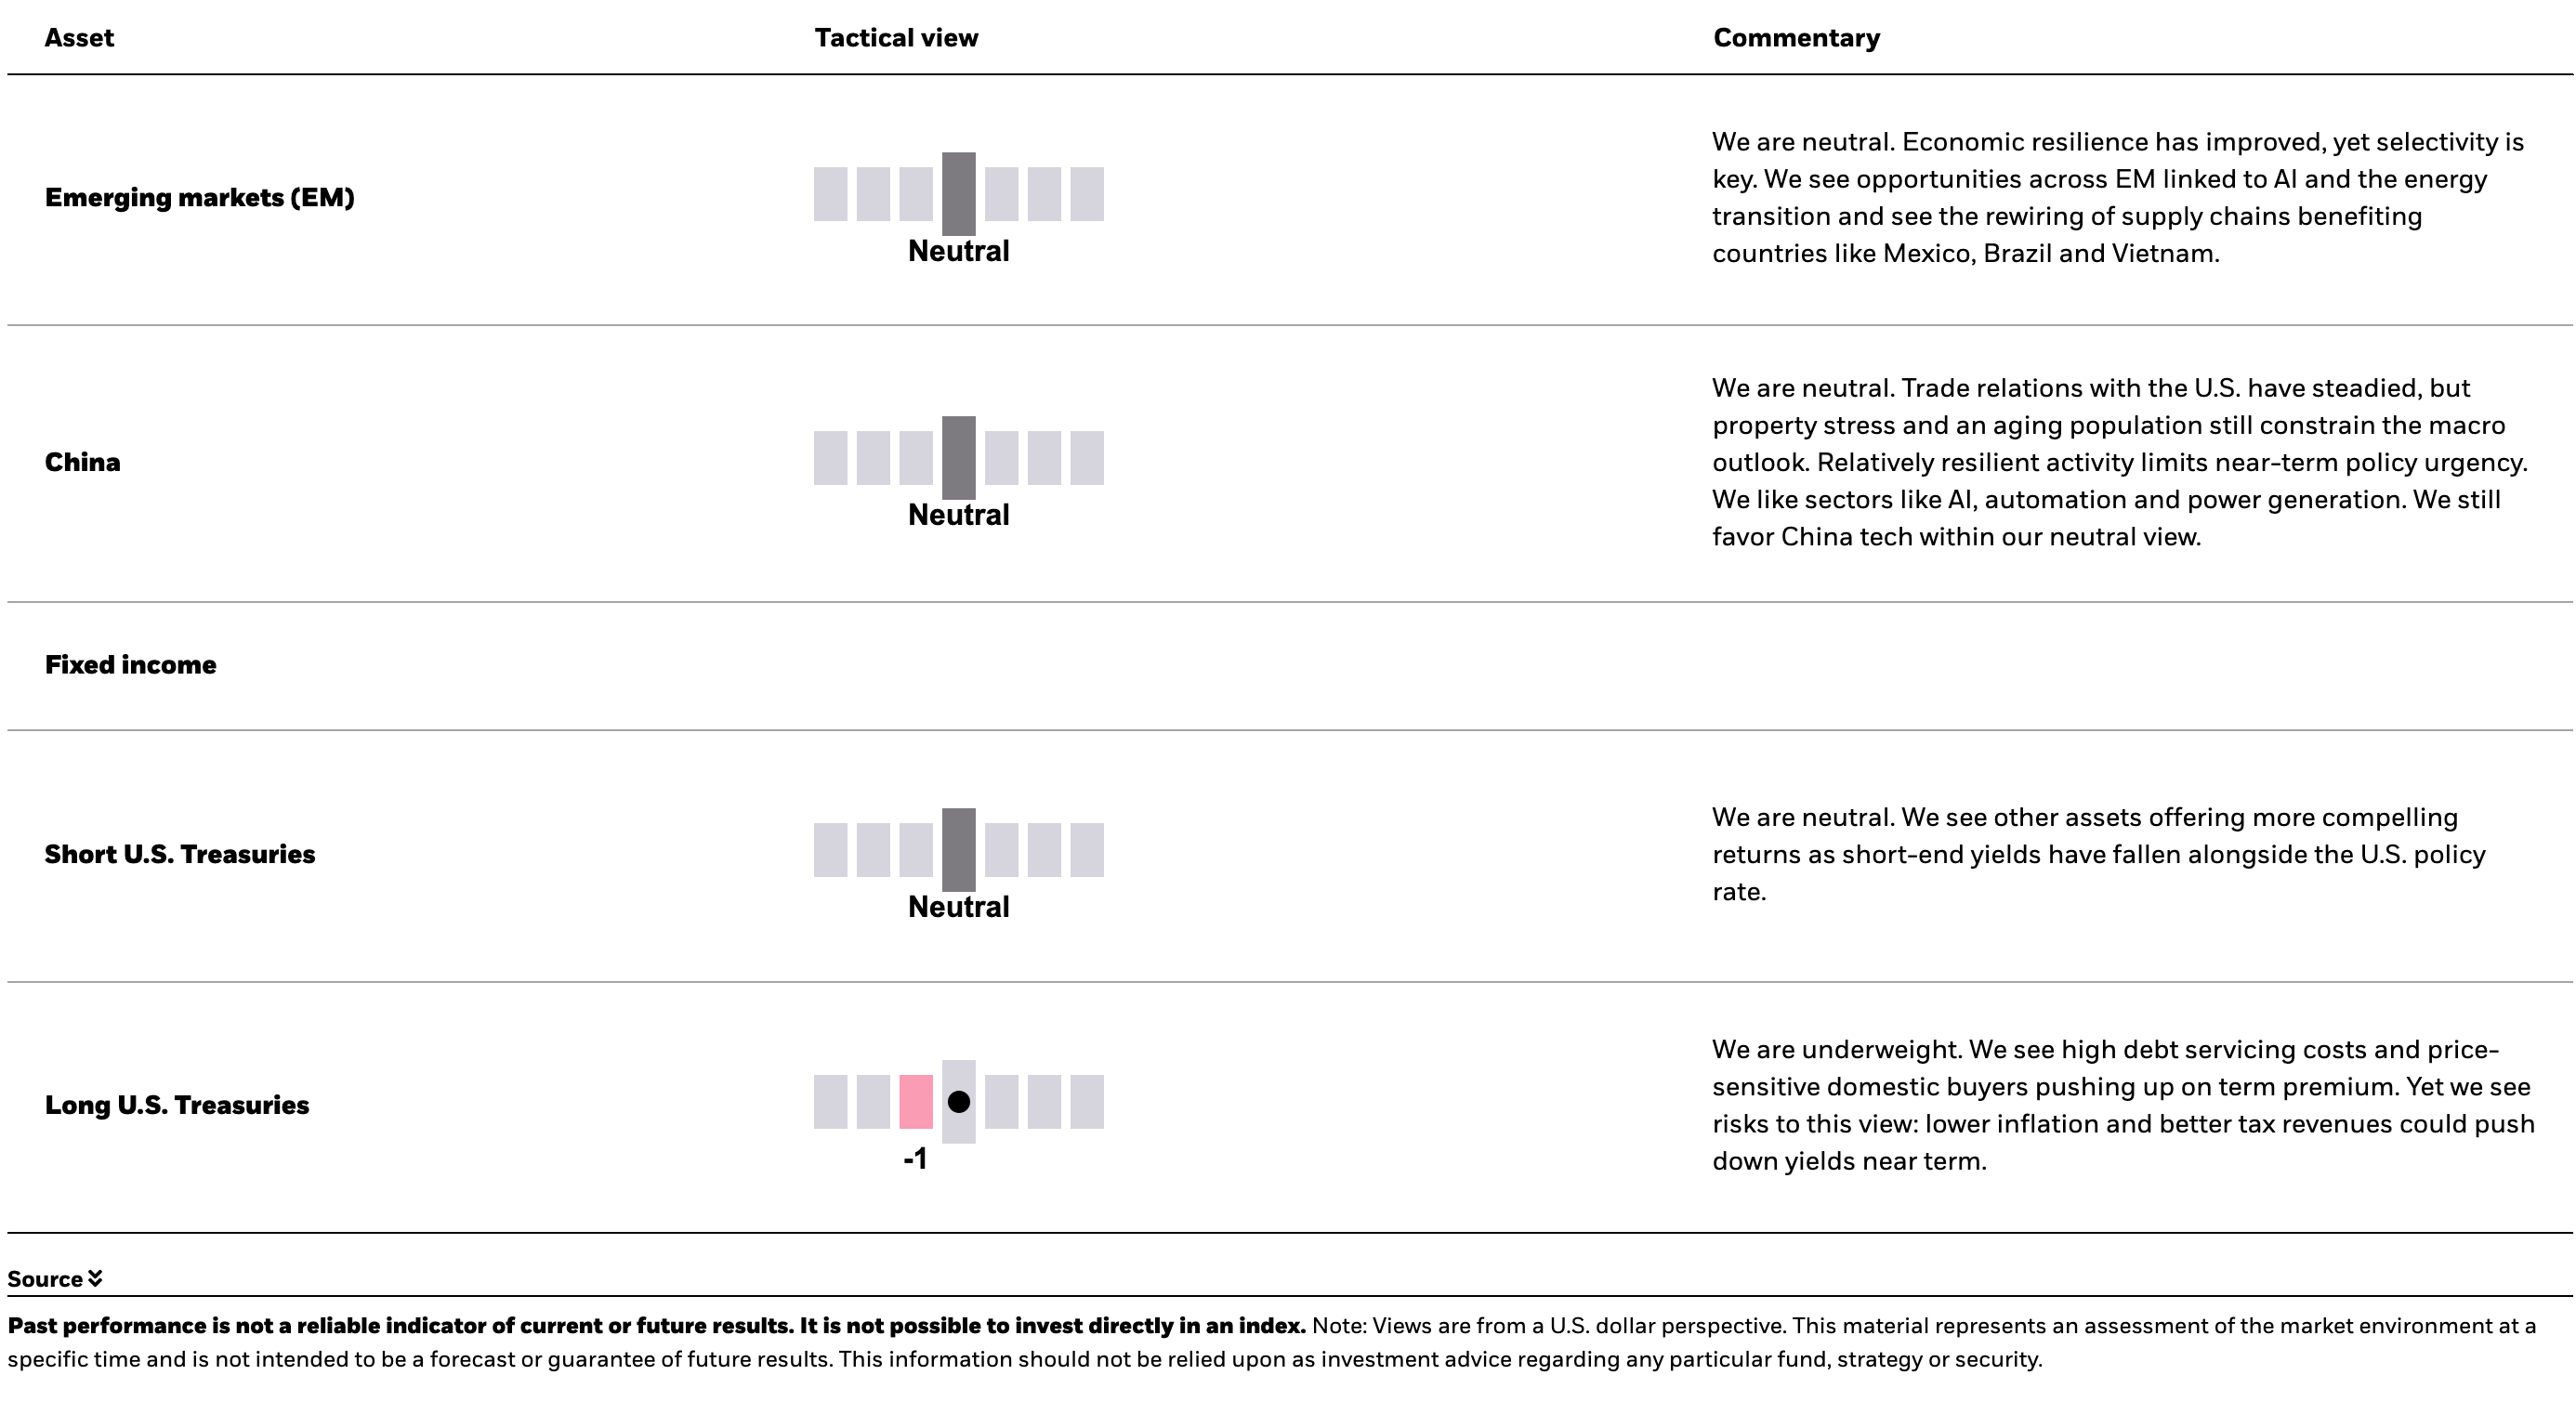
The good news: the starting point for private sector leverage is healthy, particularly listed tech. Yet the financing needs tied to AI capex far exceed what even the largest firms can meet internally. That’s why we expect companies to keep tapping public and private credit markets. But the ramp-up in private sector leverage comes against a backdrop of already highly leveraged public sector balance sheets. One risk: a structurally higher cost of capital raises the cost of AI-related investment with spillovers to the broader economy. A more leveraged system could create vulnerabilities to shocks. Indebted governments will have less capacity to cushion such shocks. This is where AI financing needs and government debt constraints intersect.
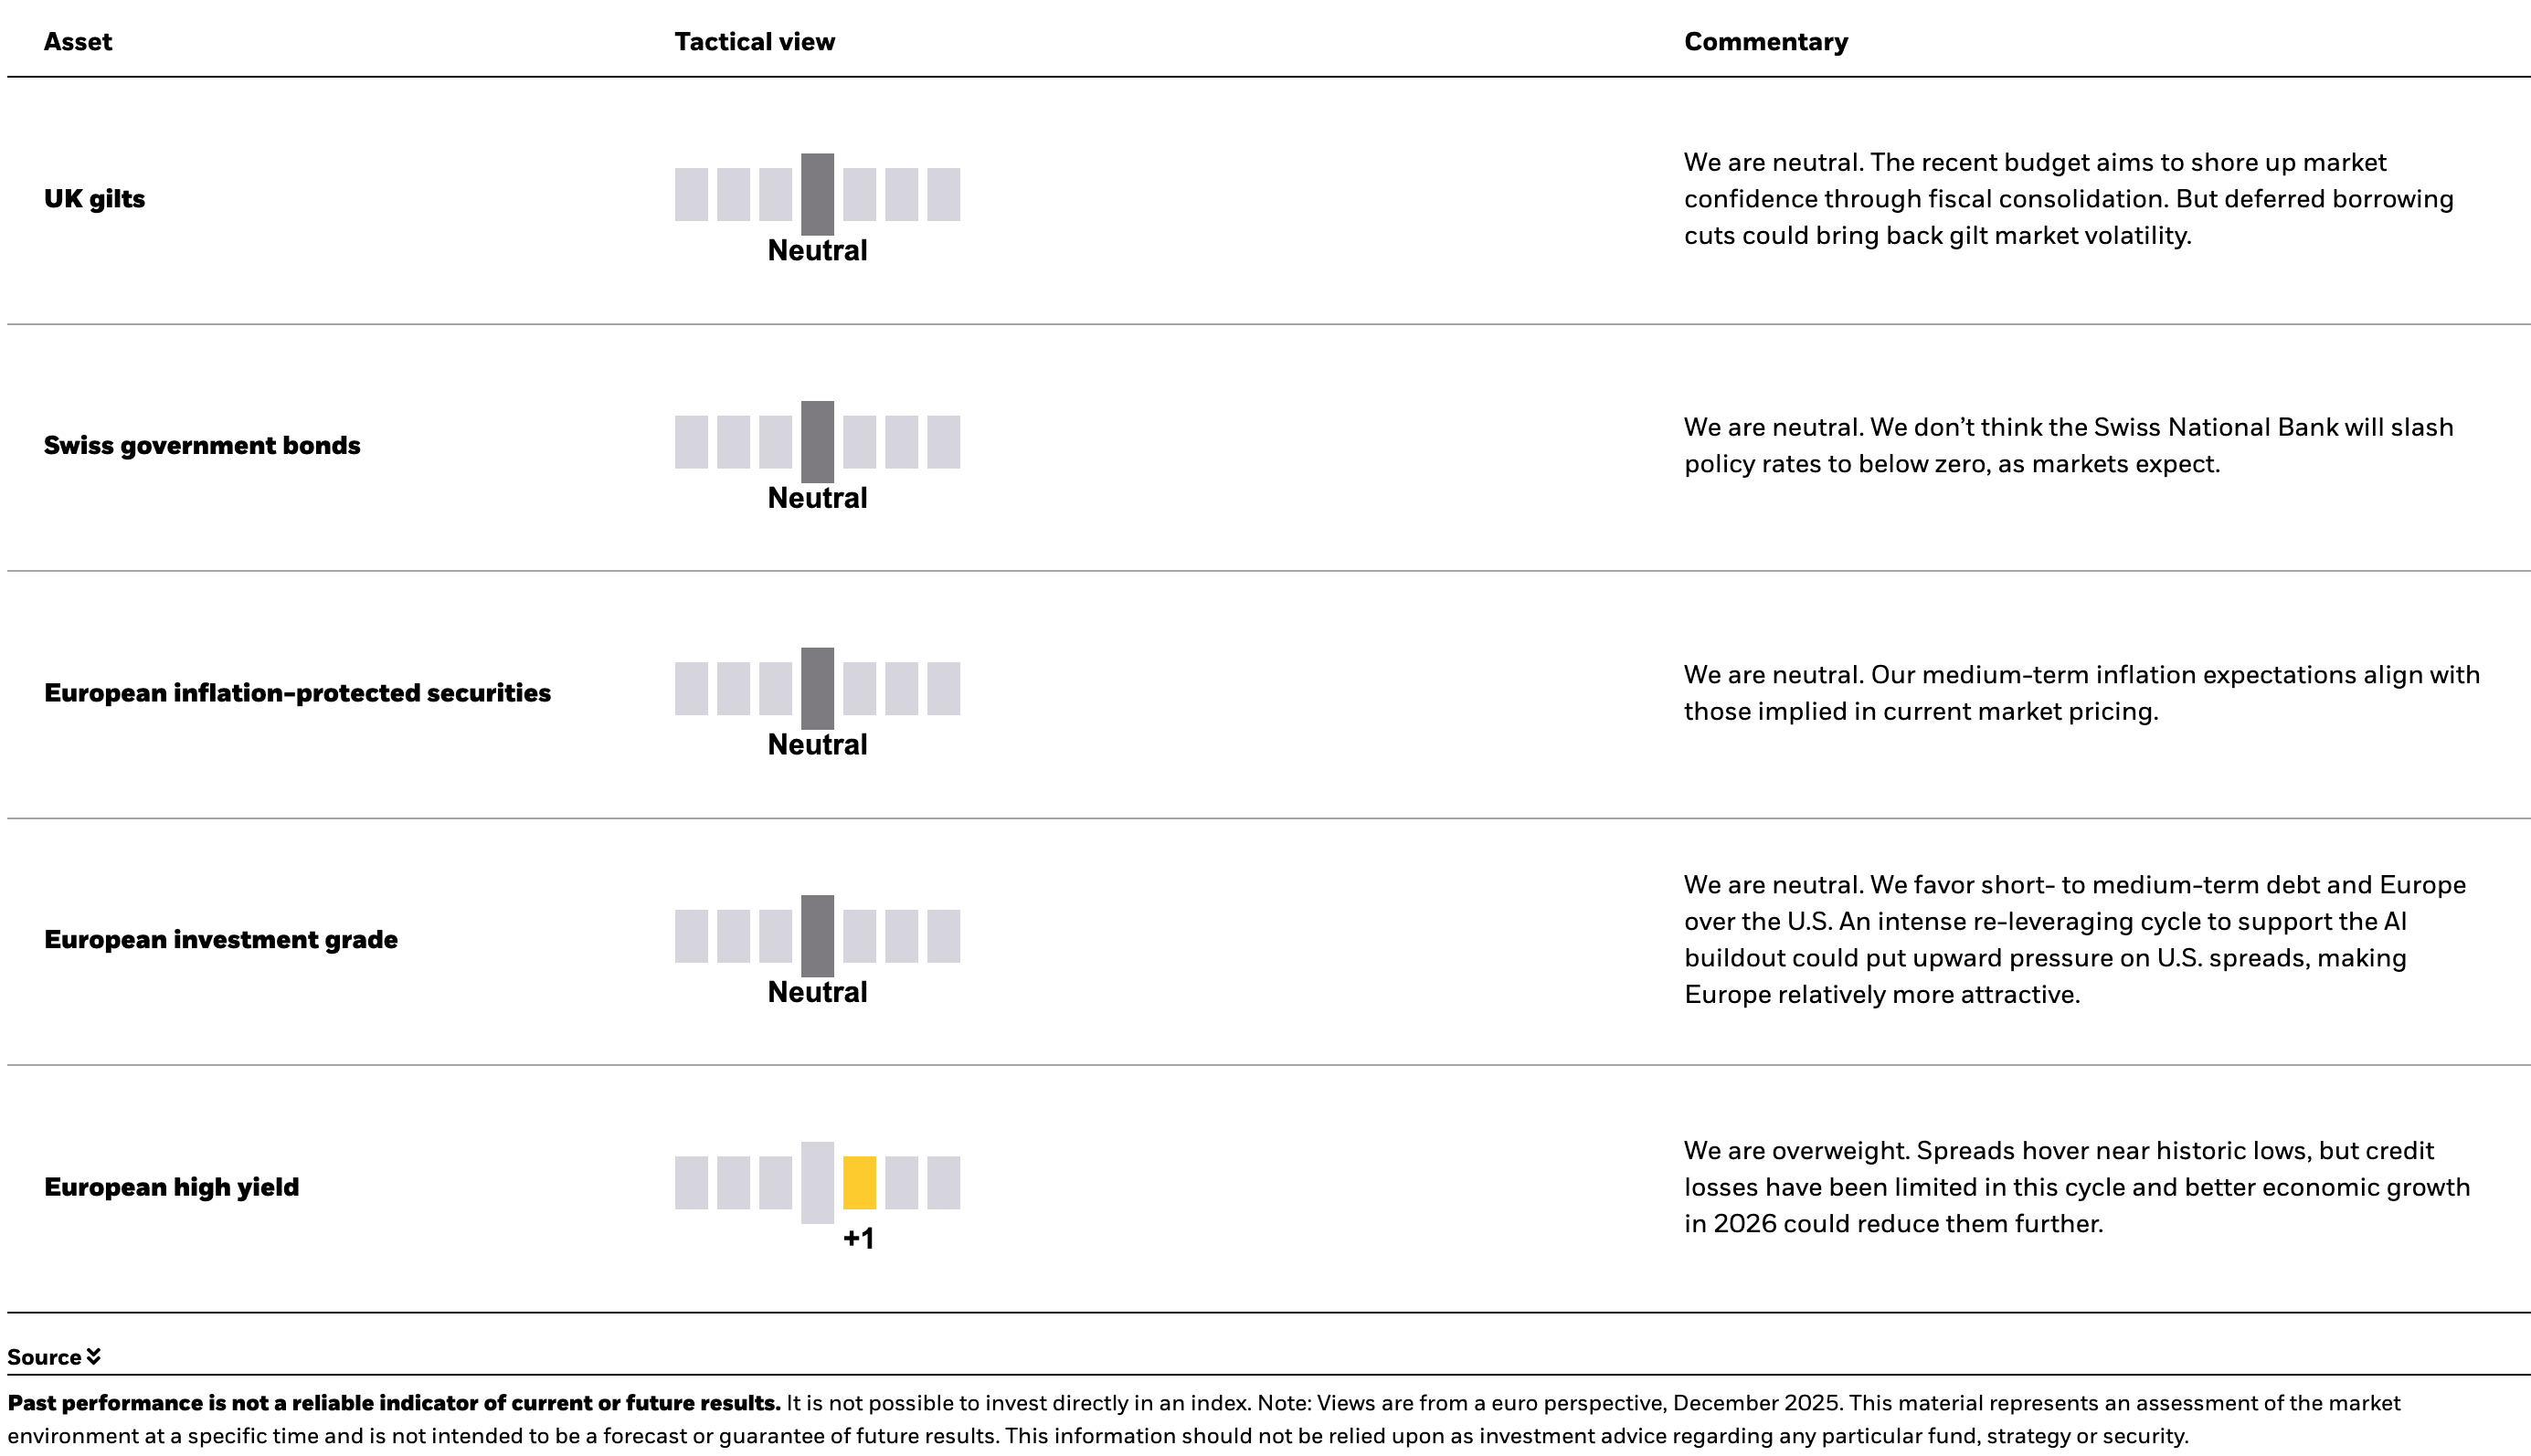
For this reason, we go tactically underweight long-term Treasuries as we see investors demanding more term premium.
Debt divergence
U.S. government and corporate debt, 1950-2025

Source: BlackRock Investment Institute, Congressional Budget Office, Bureau of Economic Analysis, Federal Reserve Board, with data from Haver Analytics and LSEG Datastream, December 2025. Notes: The chart shows U.S. federal debt as a share of nominal GDP, and debt of U.S. nonfinancial corporations as a share of pre-tax profits.
Diversification mirage
Portfolio decisions taken under the guise of “diversifying” away from the handful of forces driving markets is now a bigger active call. Our analysis shows that after accounting for common drivers of equity returns, like value and momentum, an ever larger share of U.S. equity returns reflects a single, common driver. See the chart. Markets are more concentrated, with less breadth.
Attempts to diversify away from the U.S. or AI - toward other regions or equal-weighted indexes, for example – amount to larger active calls than before. They have left portfolios less exposed to this year’s dominant driver of returns – a driver we have conviction in. The equal-weighted S&P 500 is up just 3% this year versus 11% for the market cap-weighted S&P, LSEG data show. We don’t think this can be viewed as indiscriminately spreading out bets for diversification. They should be recognized as big active calls that need to be made with conviction. Moreover, if the AI theme stumbles, the impact will likely dwarf any seeming diversification away from it.
This environment calls for seeking truly idiosyncratic return sources, such as private markets and hedge funds, and staying tactical.
A powerful common driver
Variance in S&P 500 returns explained by a dominant underlying factor

The figure shown relates to past performance. Past performance is not a reliable indicator of current or future results. Index performance returns do not reflect any management fees, transaction costs or expenses. Indices are unmanaged and one cannot invest directly in an index. Source: BlackRock Investment Institute, with data from Bloomberg, December 2025. Note: The line shows the variance of daily S&P 500 stock returns explained by a common driver after accounting for factors like stock value, size and momentum. This was calculated using first principal component (PC1) of a principal component analysis (PCA) over a rolling 252-day window. PC1 attempts to determine the common driver in a set of numbers that change often – like stock returns for example.
Traditional diversifiers are also faltering. Long-term Treasuries no longer offer the portfolio ballast they once did as high debt keeps yields elevated. Diversification now means having conviction in distinct return drivers - whether in hedge funds, private markets or gold - rather than relying on past correlations.
We think investors should focus less on spreading risk indiscriminately and more on owning it more deliberately. We lean into AI beneficiaries – but retain a tactical approach. We monitor signposts for how the AI transformation is unfolding.
Read our 2026 outlook in charts (PDF)
Asset Class Views
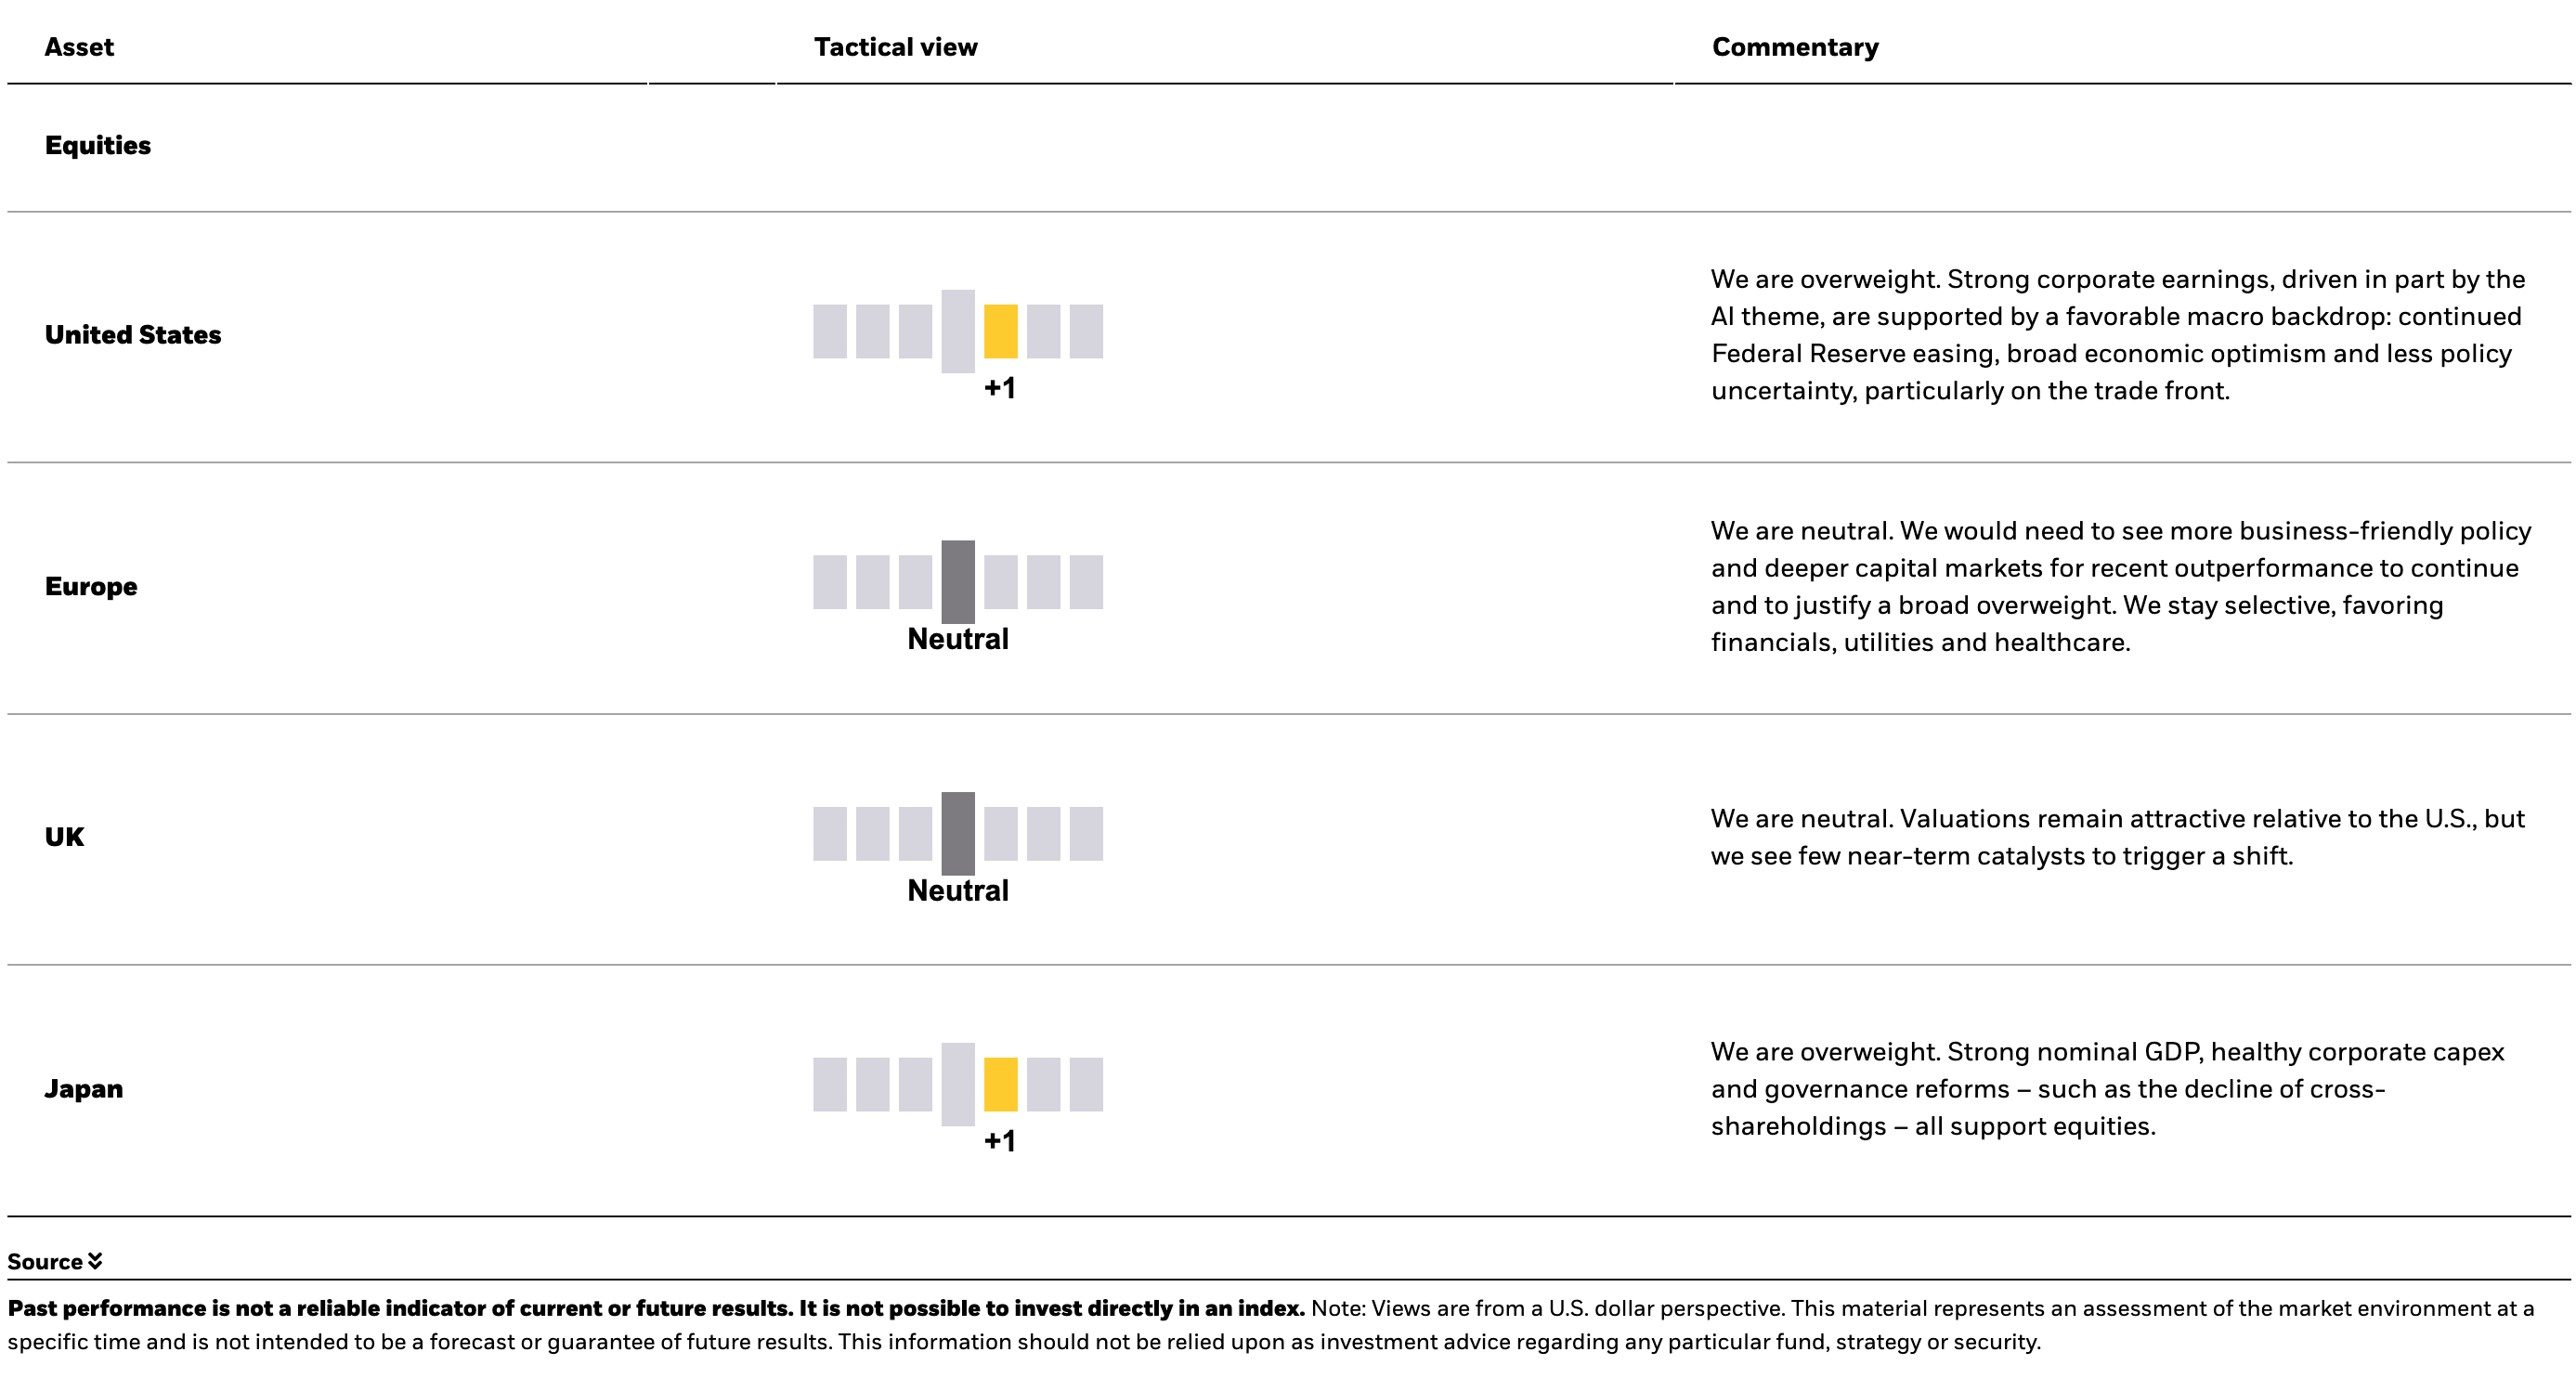
Going global
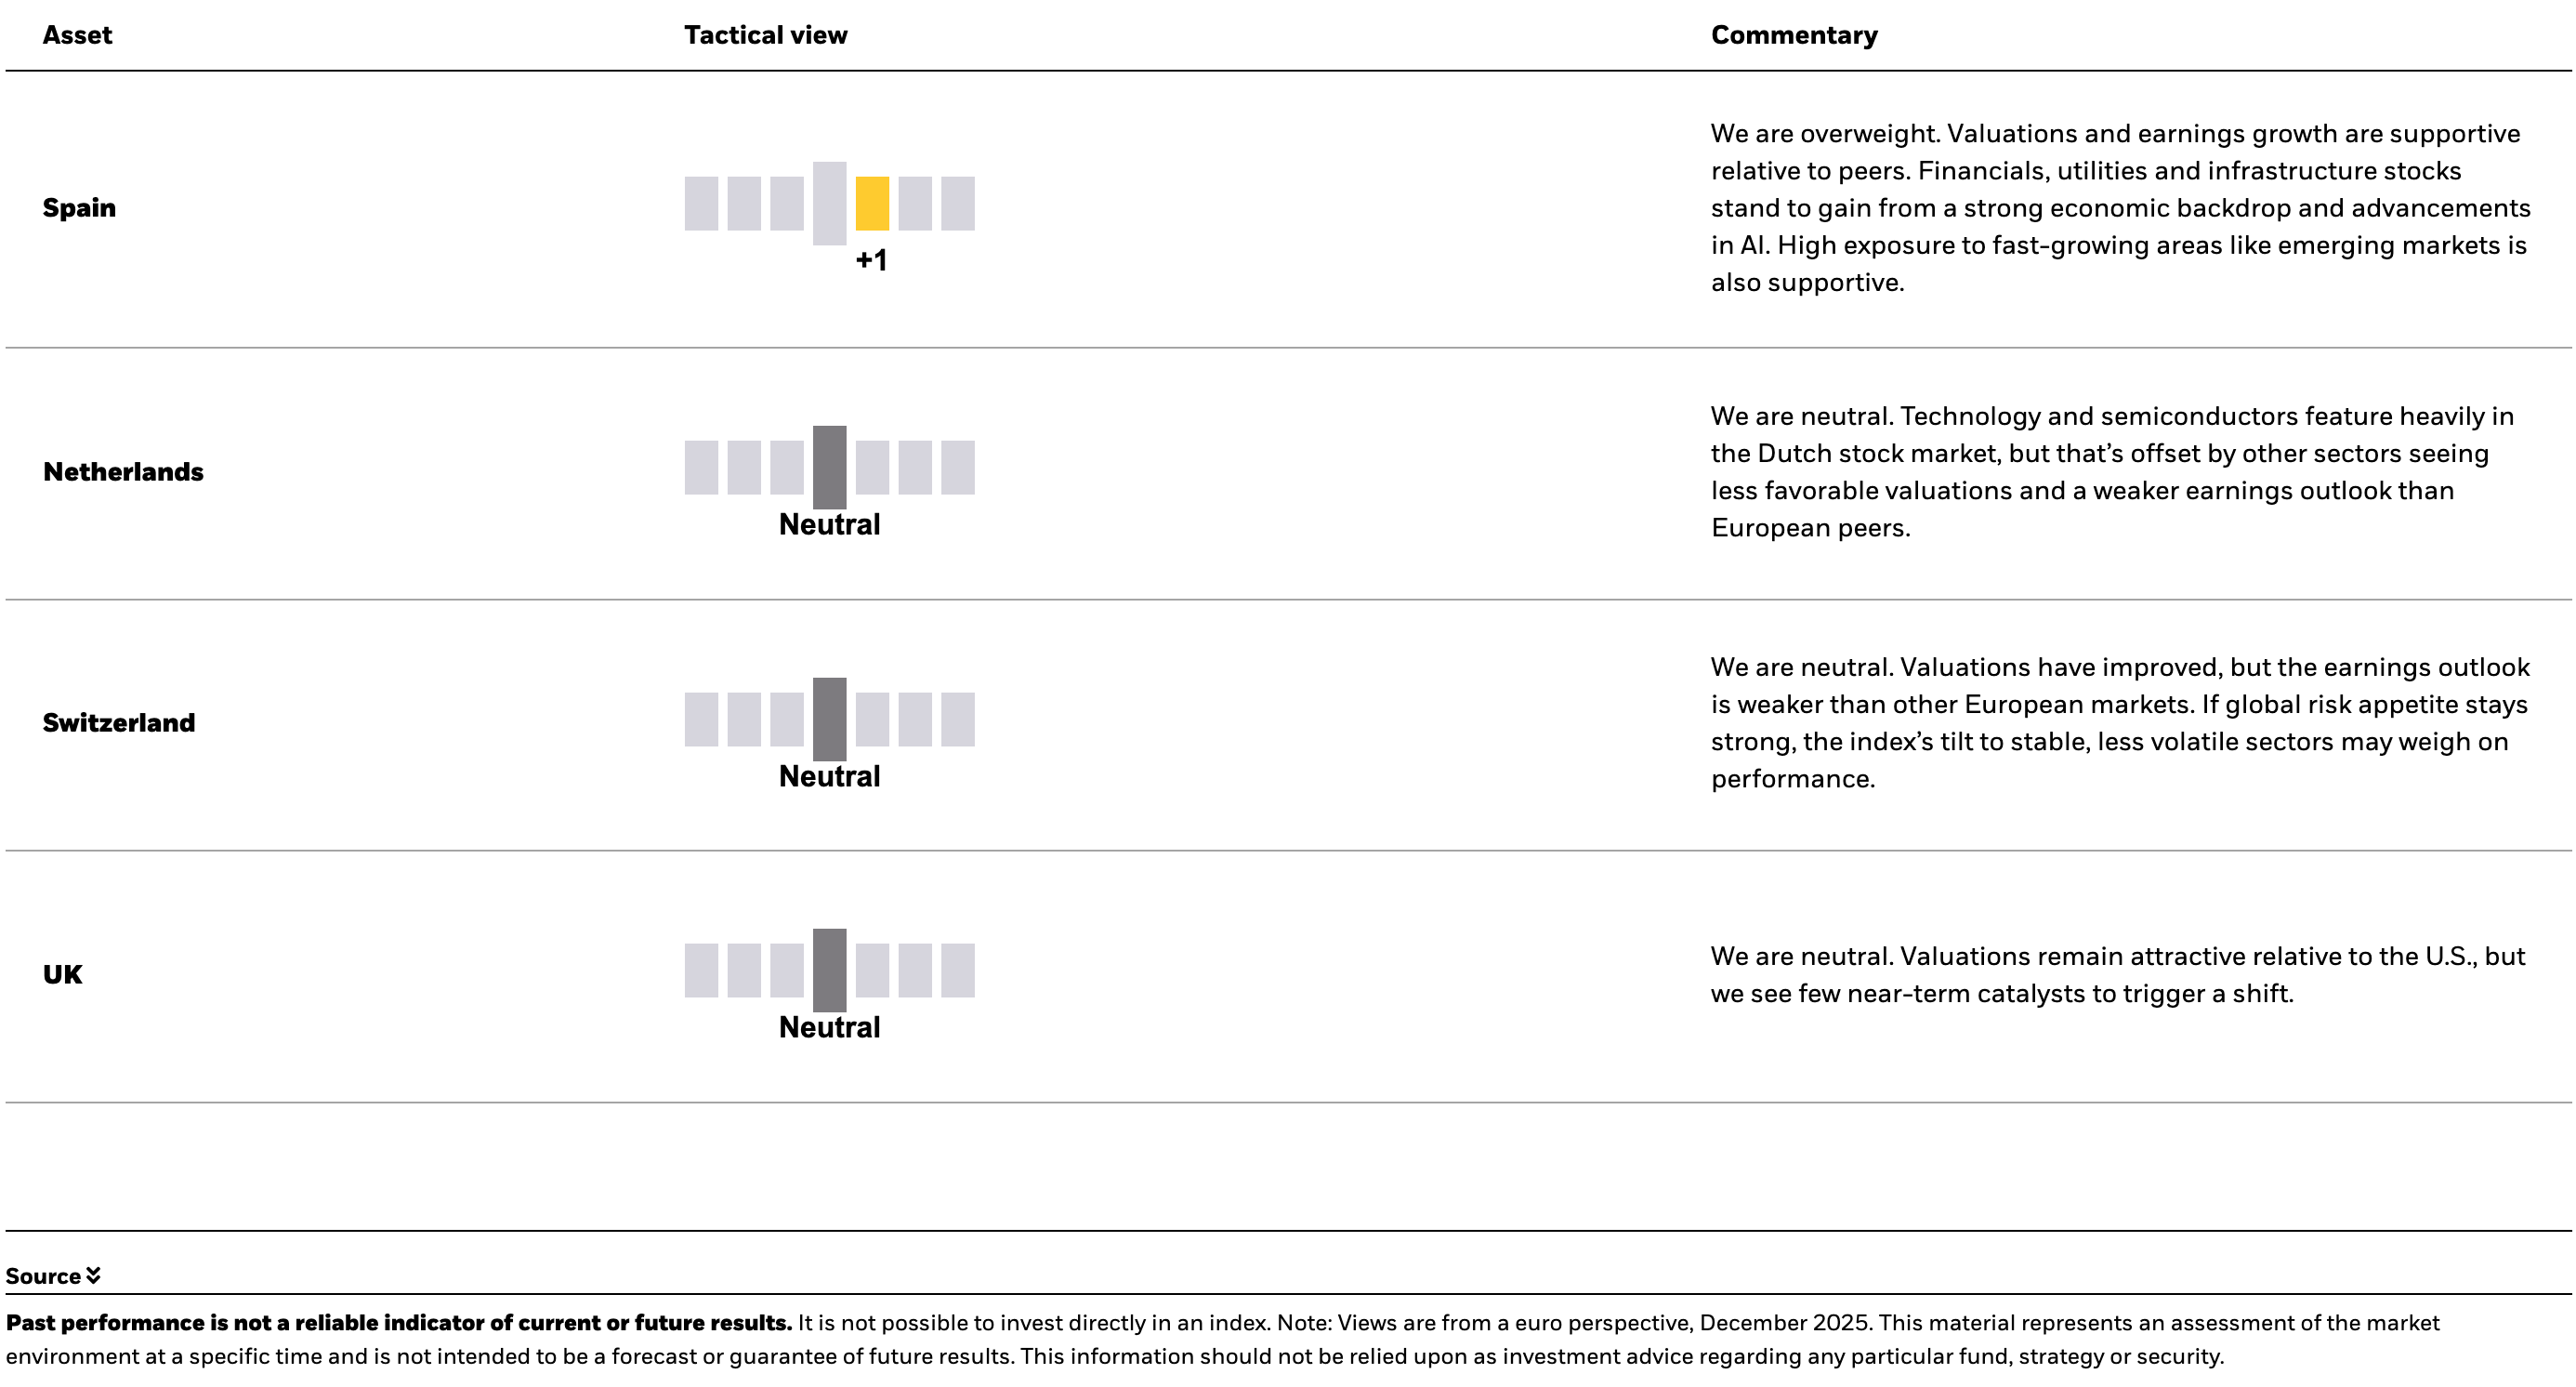
We stay overweight U.S. stocks on the broadening AI theme, with risk appetite supported by Fed rate cuts. The AI theme has broadened out this year, benefiting a wider array of markets including China, Taiwan and South Korea. Europe’s lagging earnings growth relative to the U.S. keeps us neutral its stocks, but we prefer sectors such as financials and industrials.
Big calls
Our highest conviction views on six- to 12-month (tactical) and over five-year (strategic) horizons, December 2025
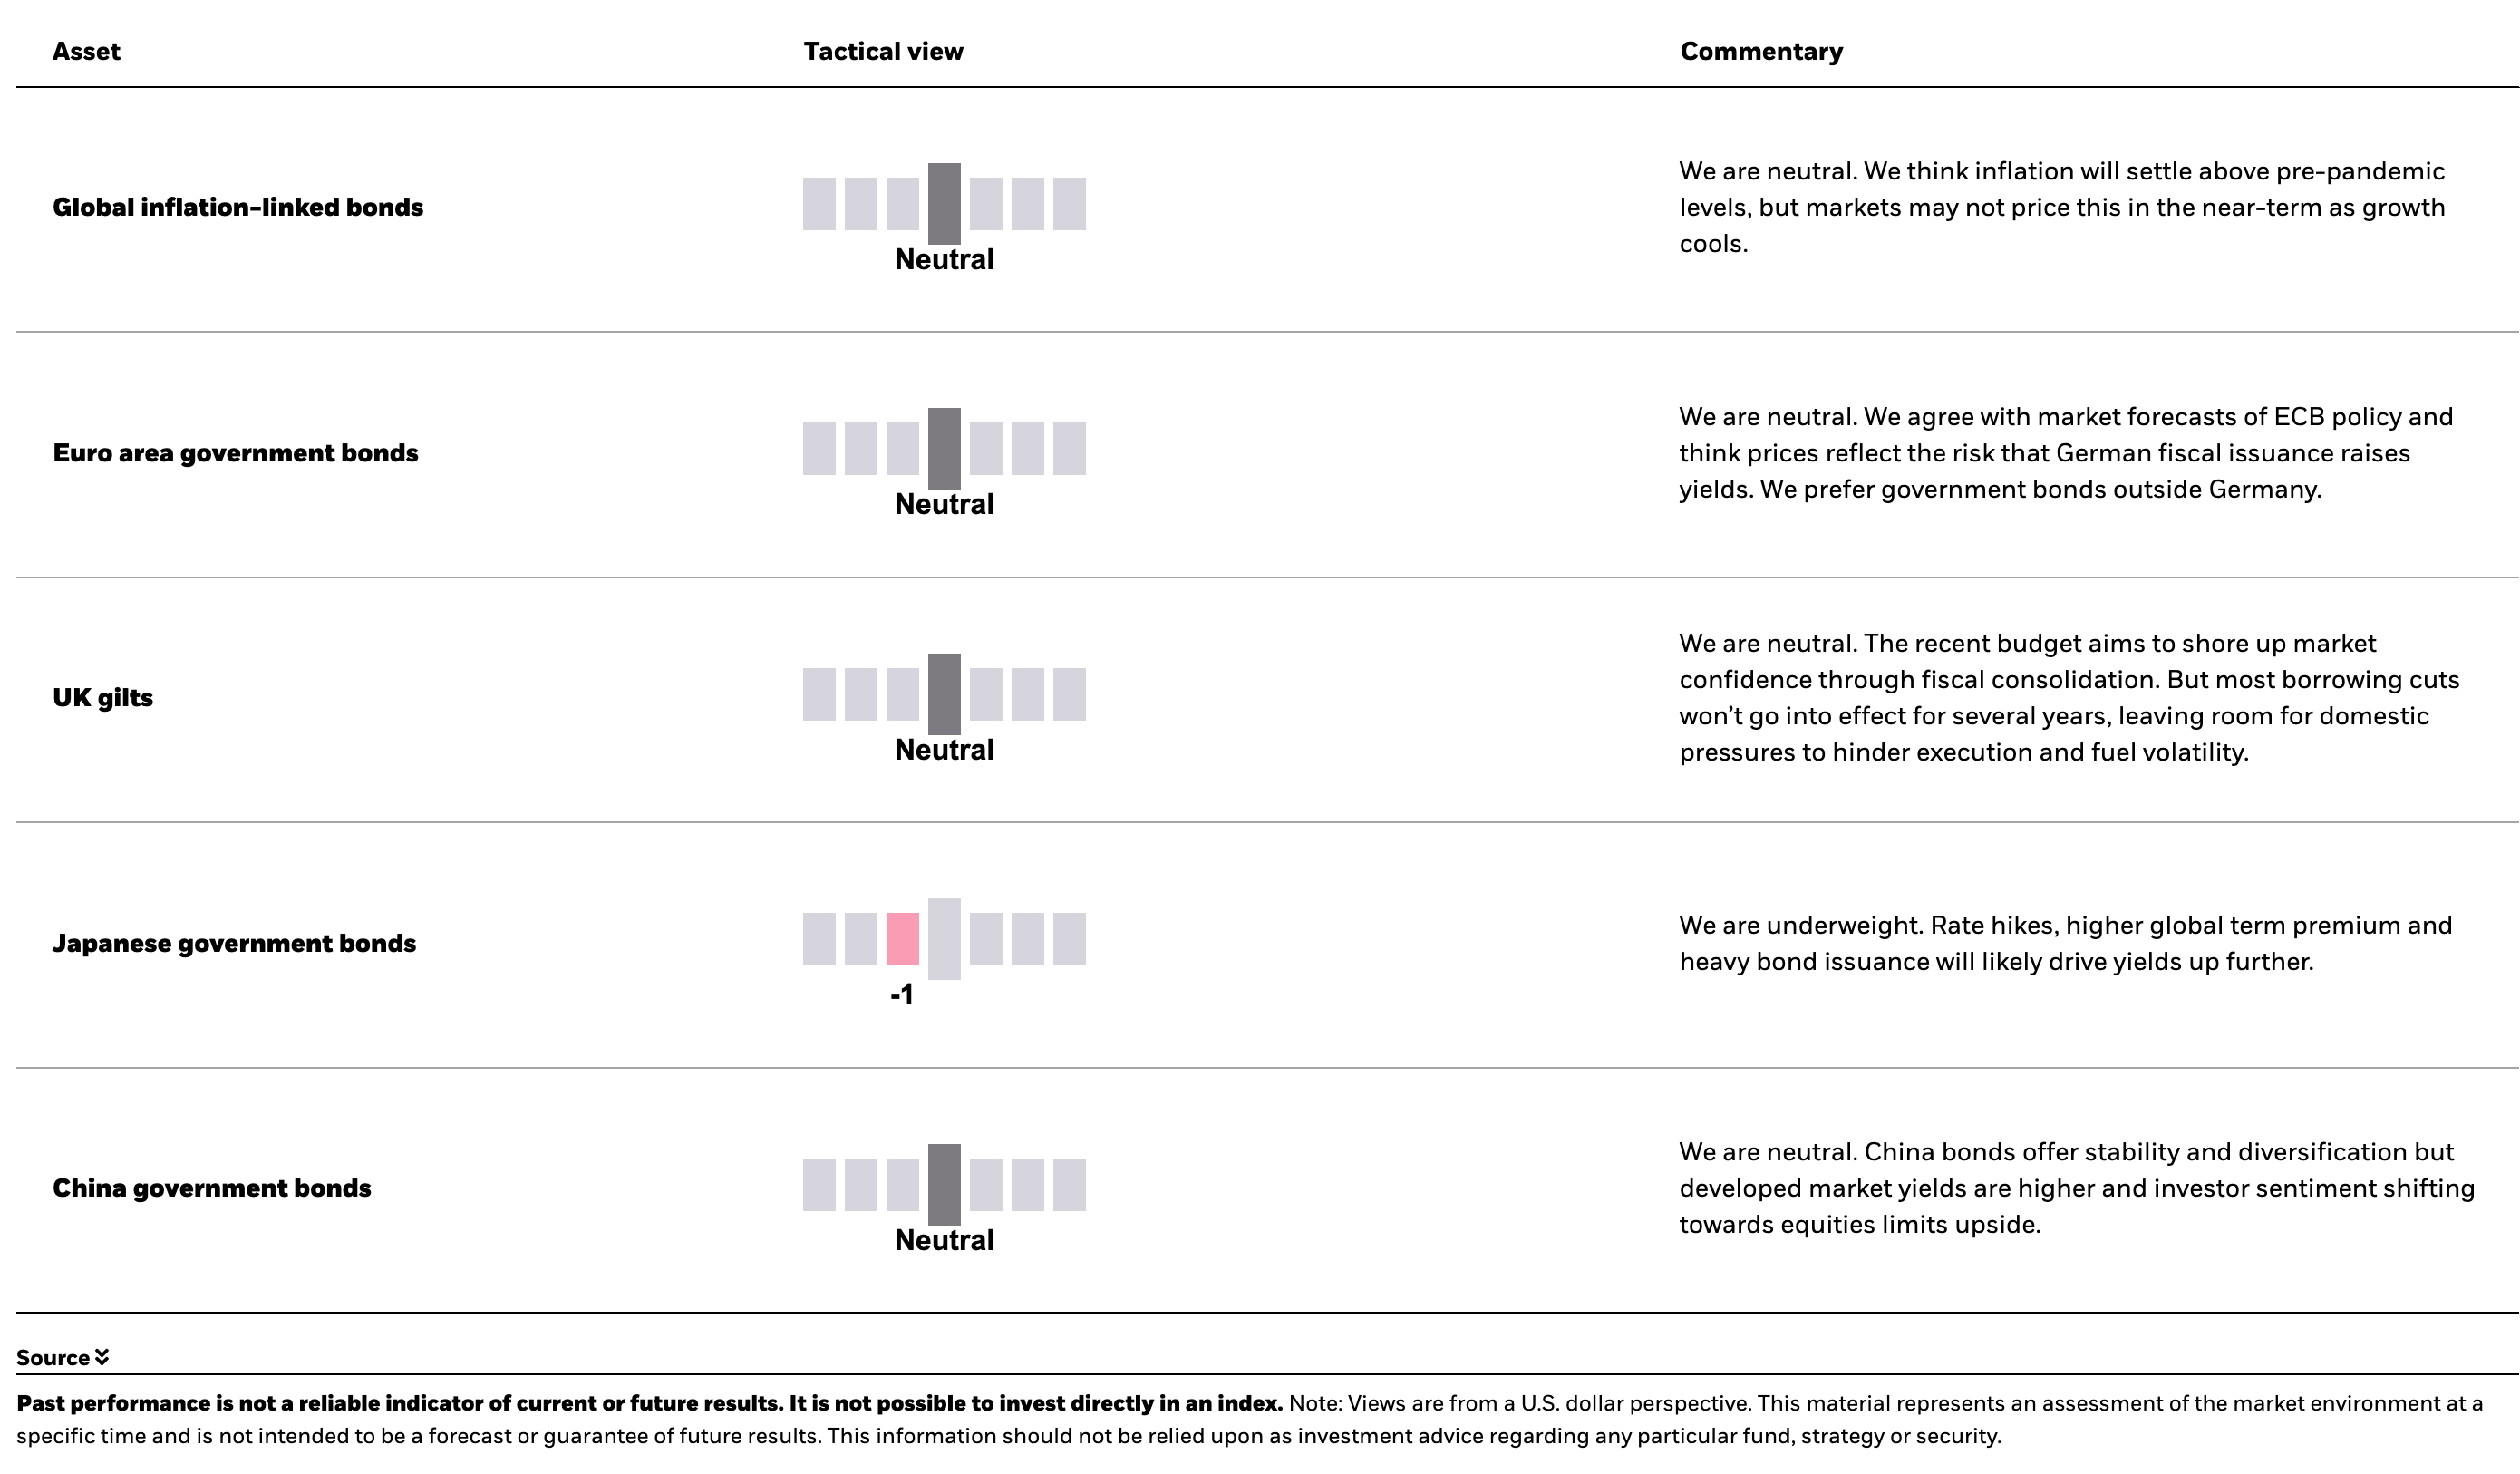
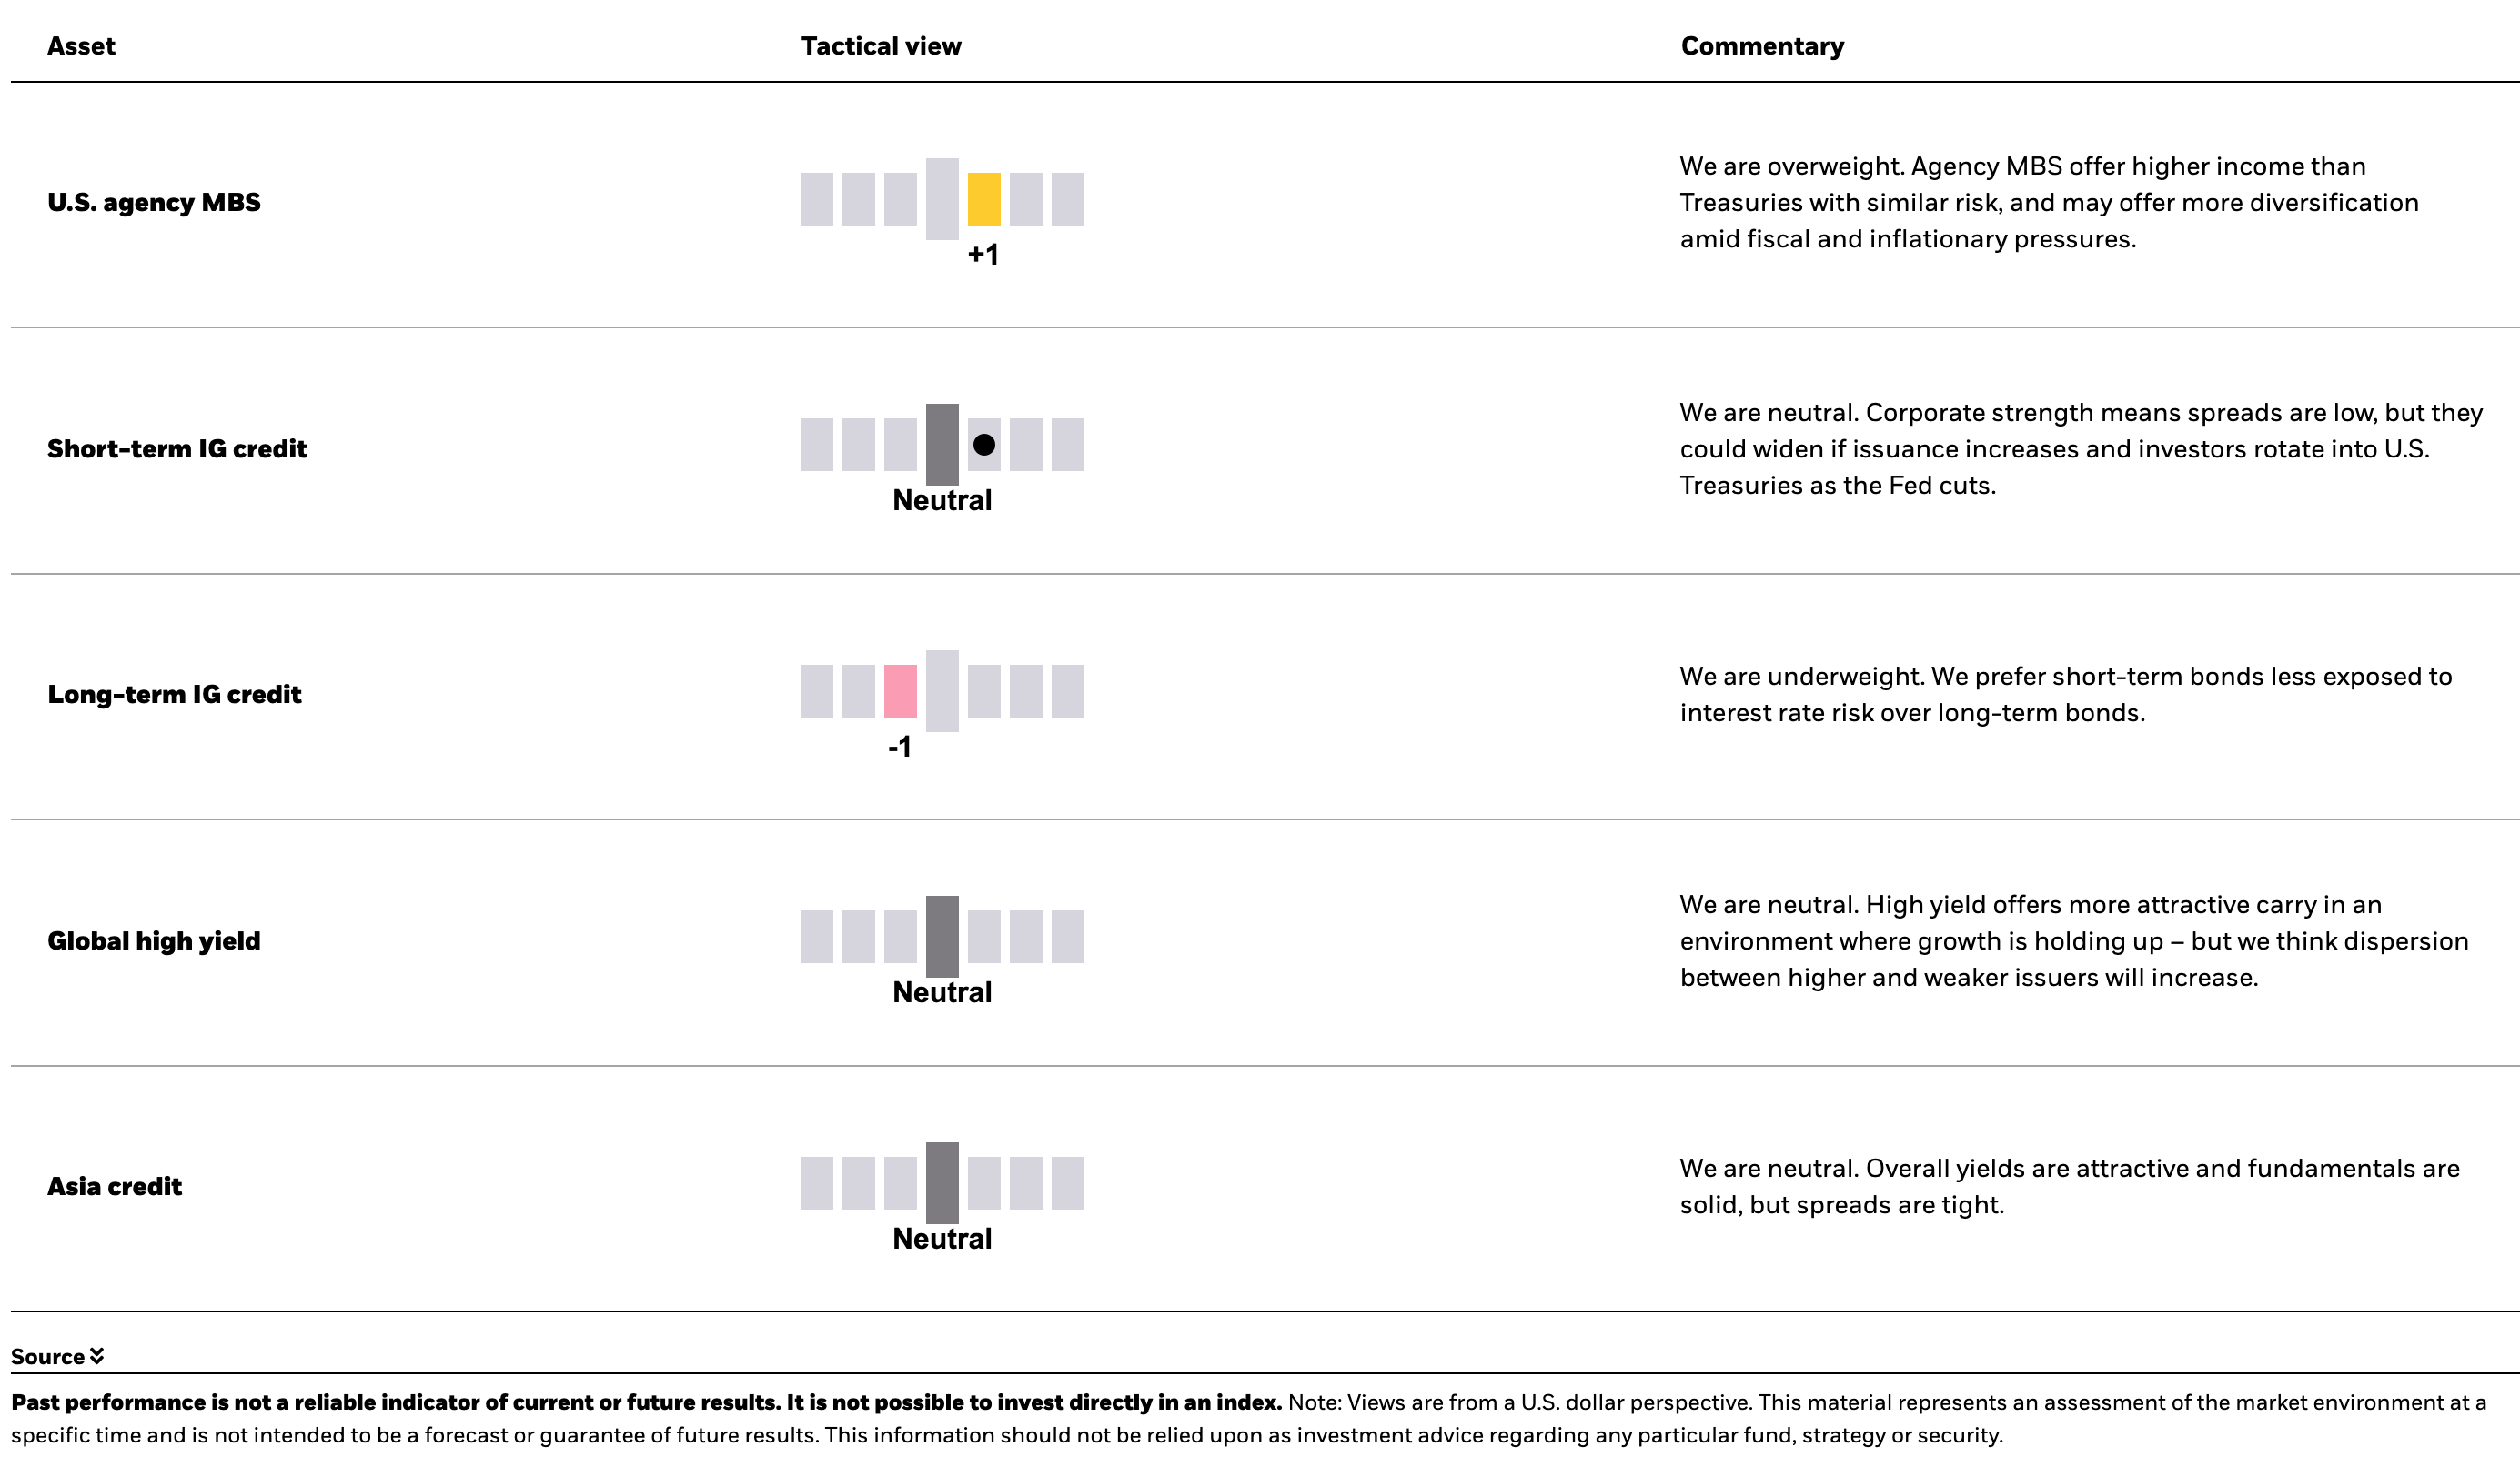
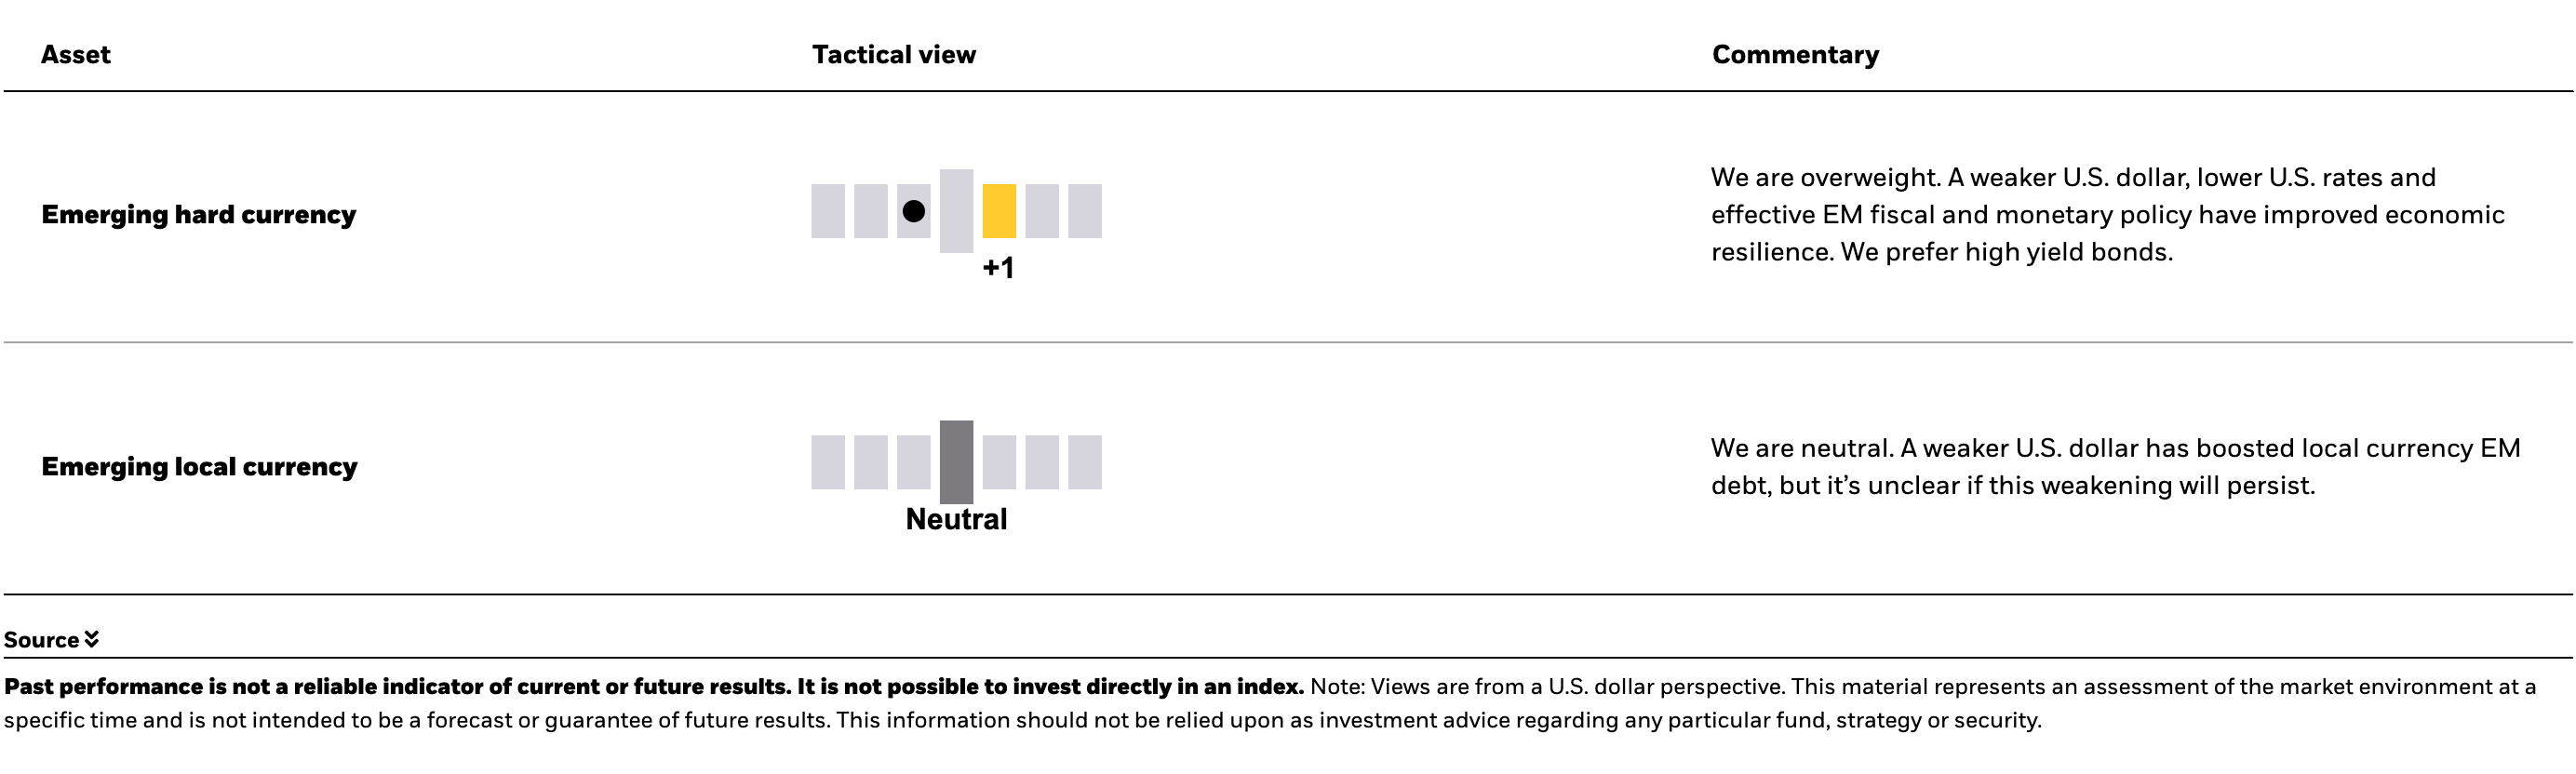
Tactical granular views
Six- to 12-month tactical views on selected assets vs. broad global asset classes by level of conviction, December 2025

We have lengthened our tactical investment horizon back to six to 12 months. The table below reflects this and, importantly, leaves aside the opportunity for alpha, or the potential to generate above-benchmark returns – especially at a time of heightened volatility.
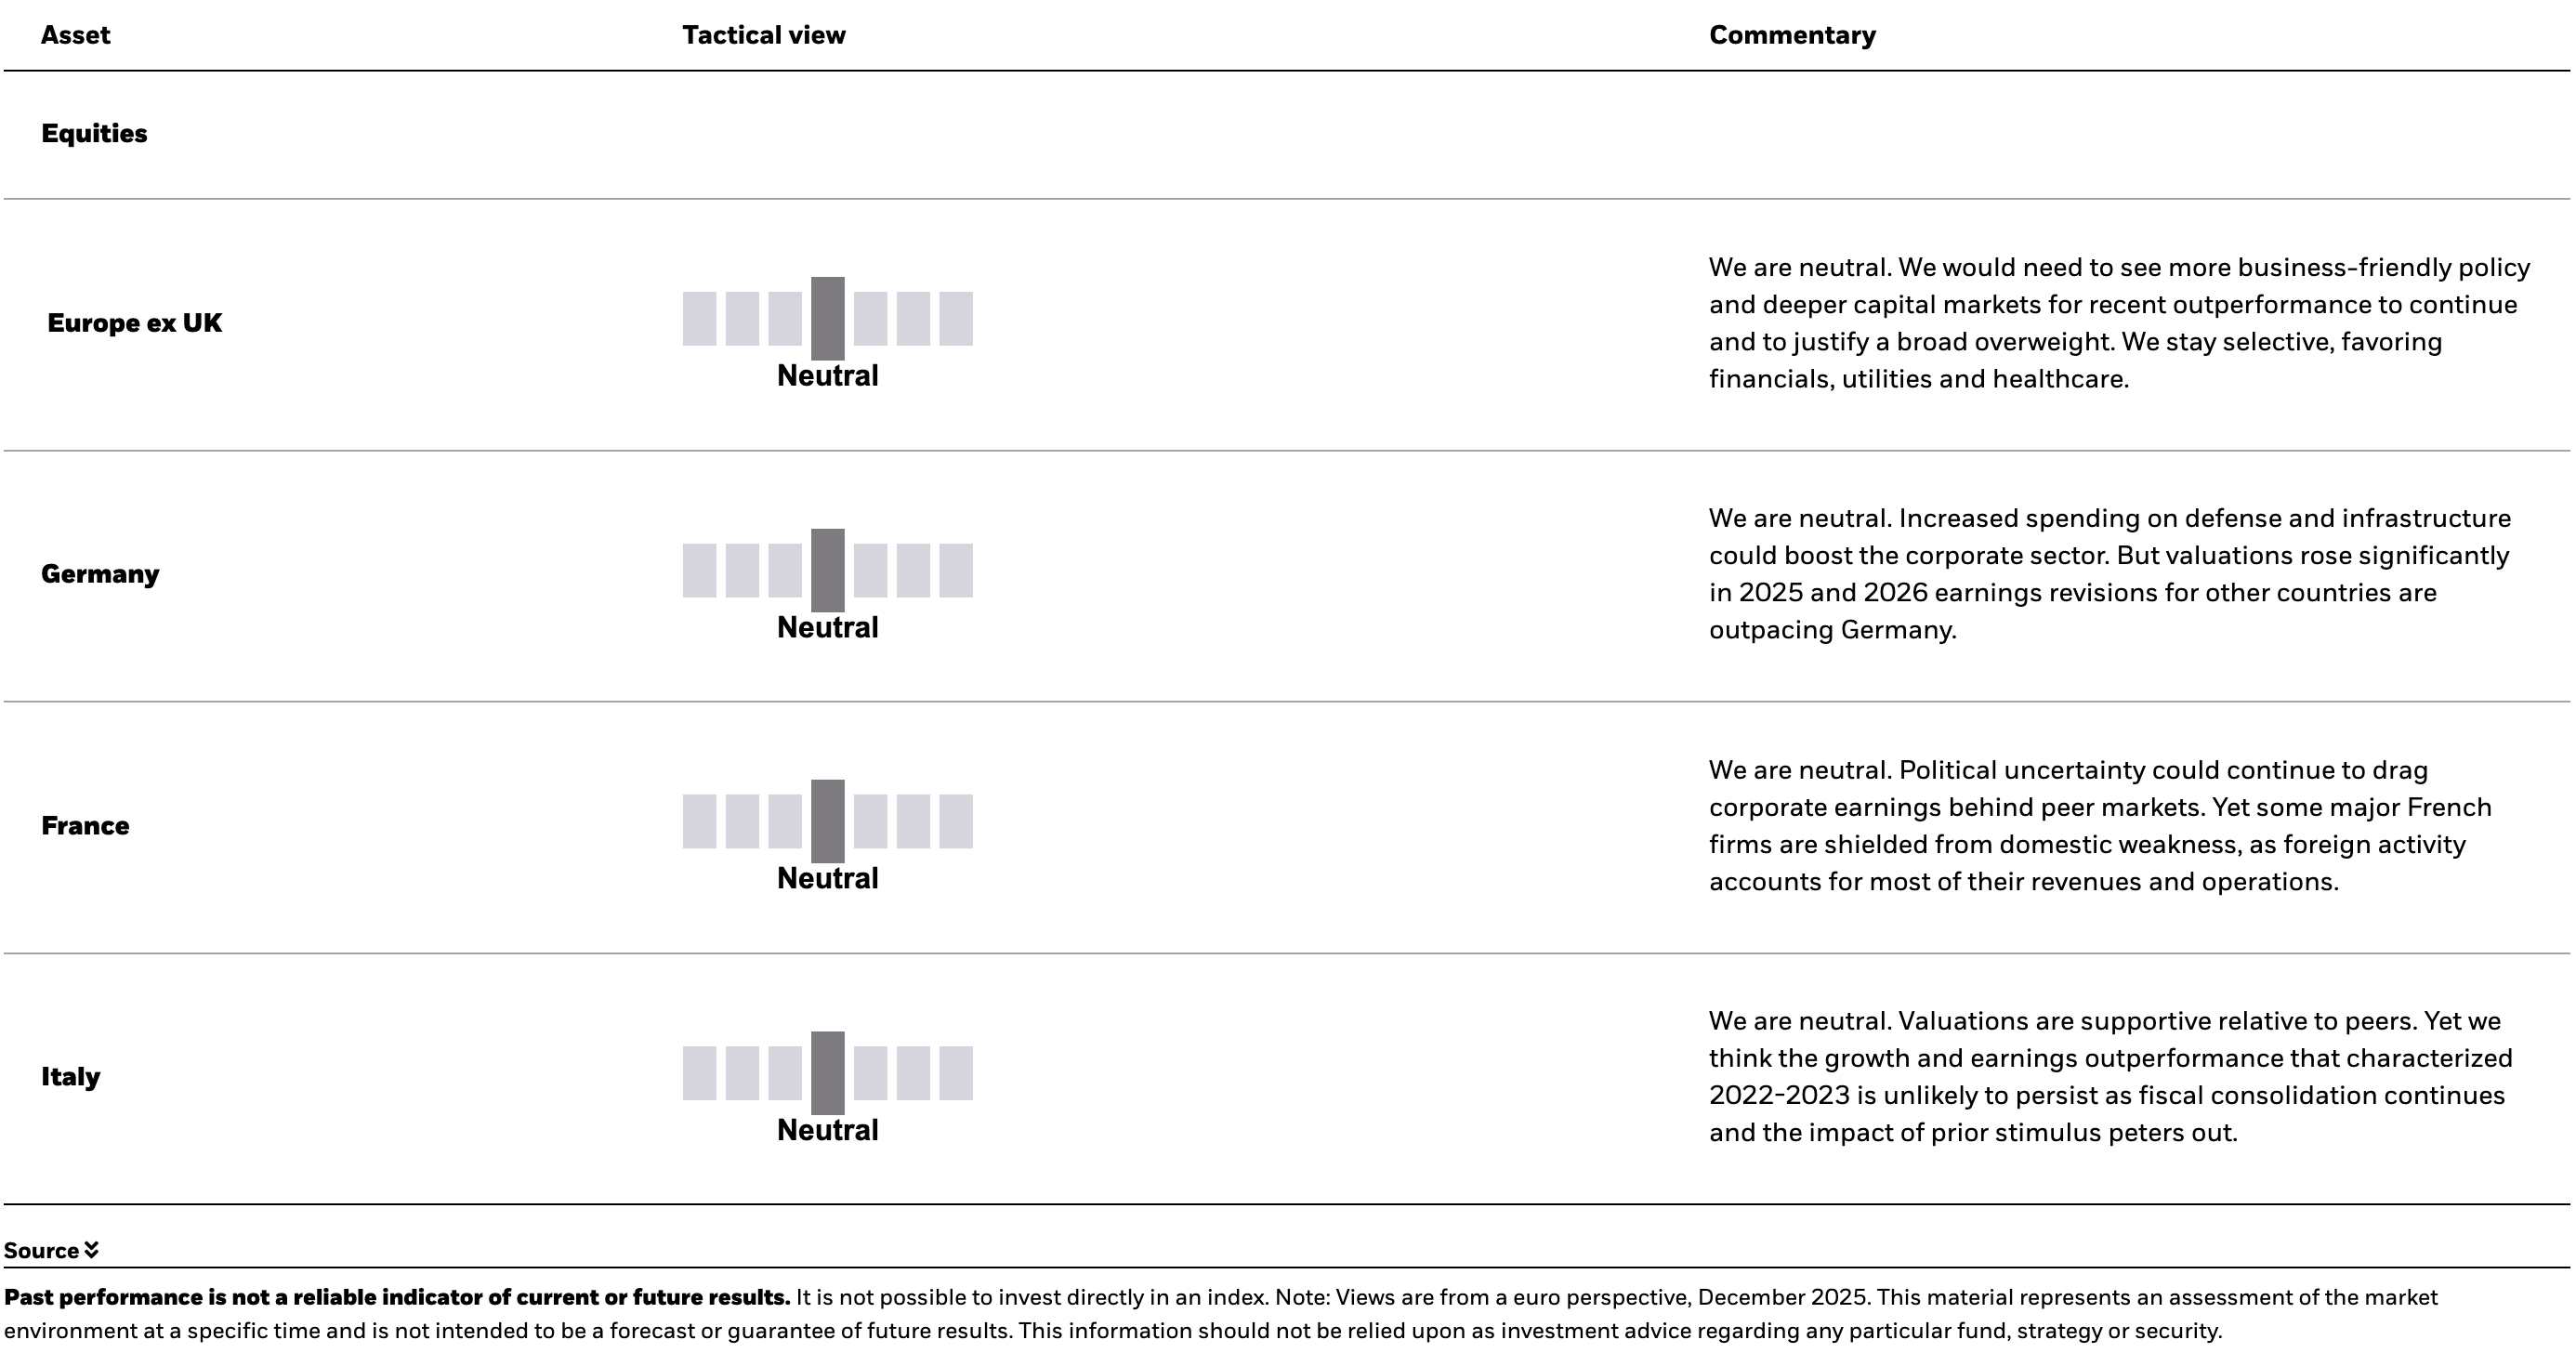
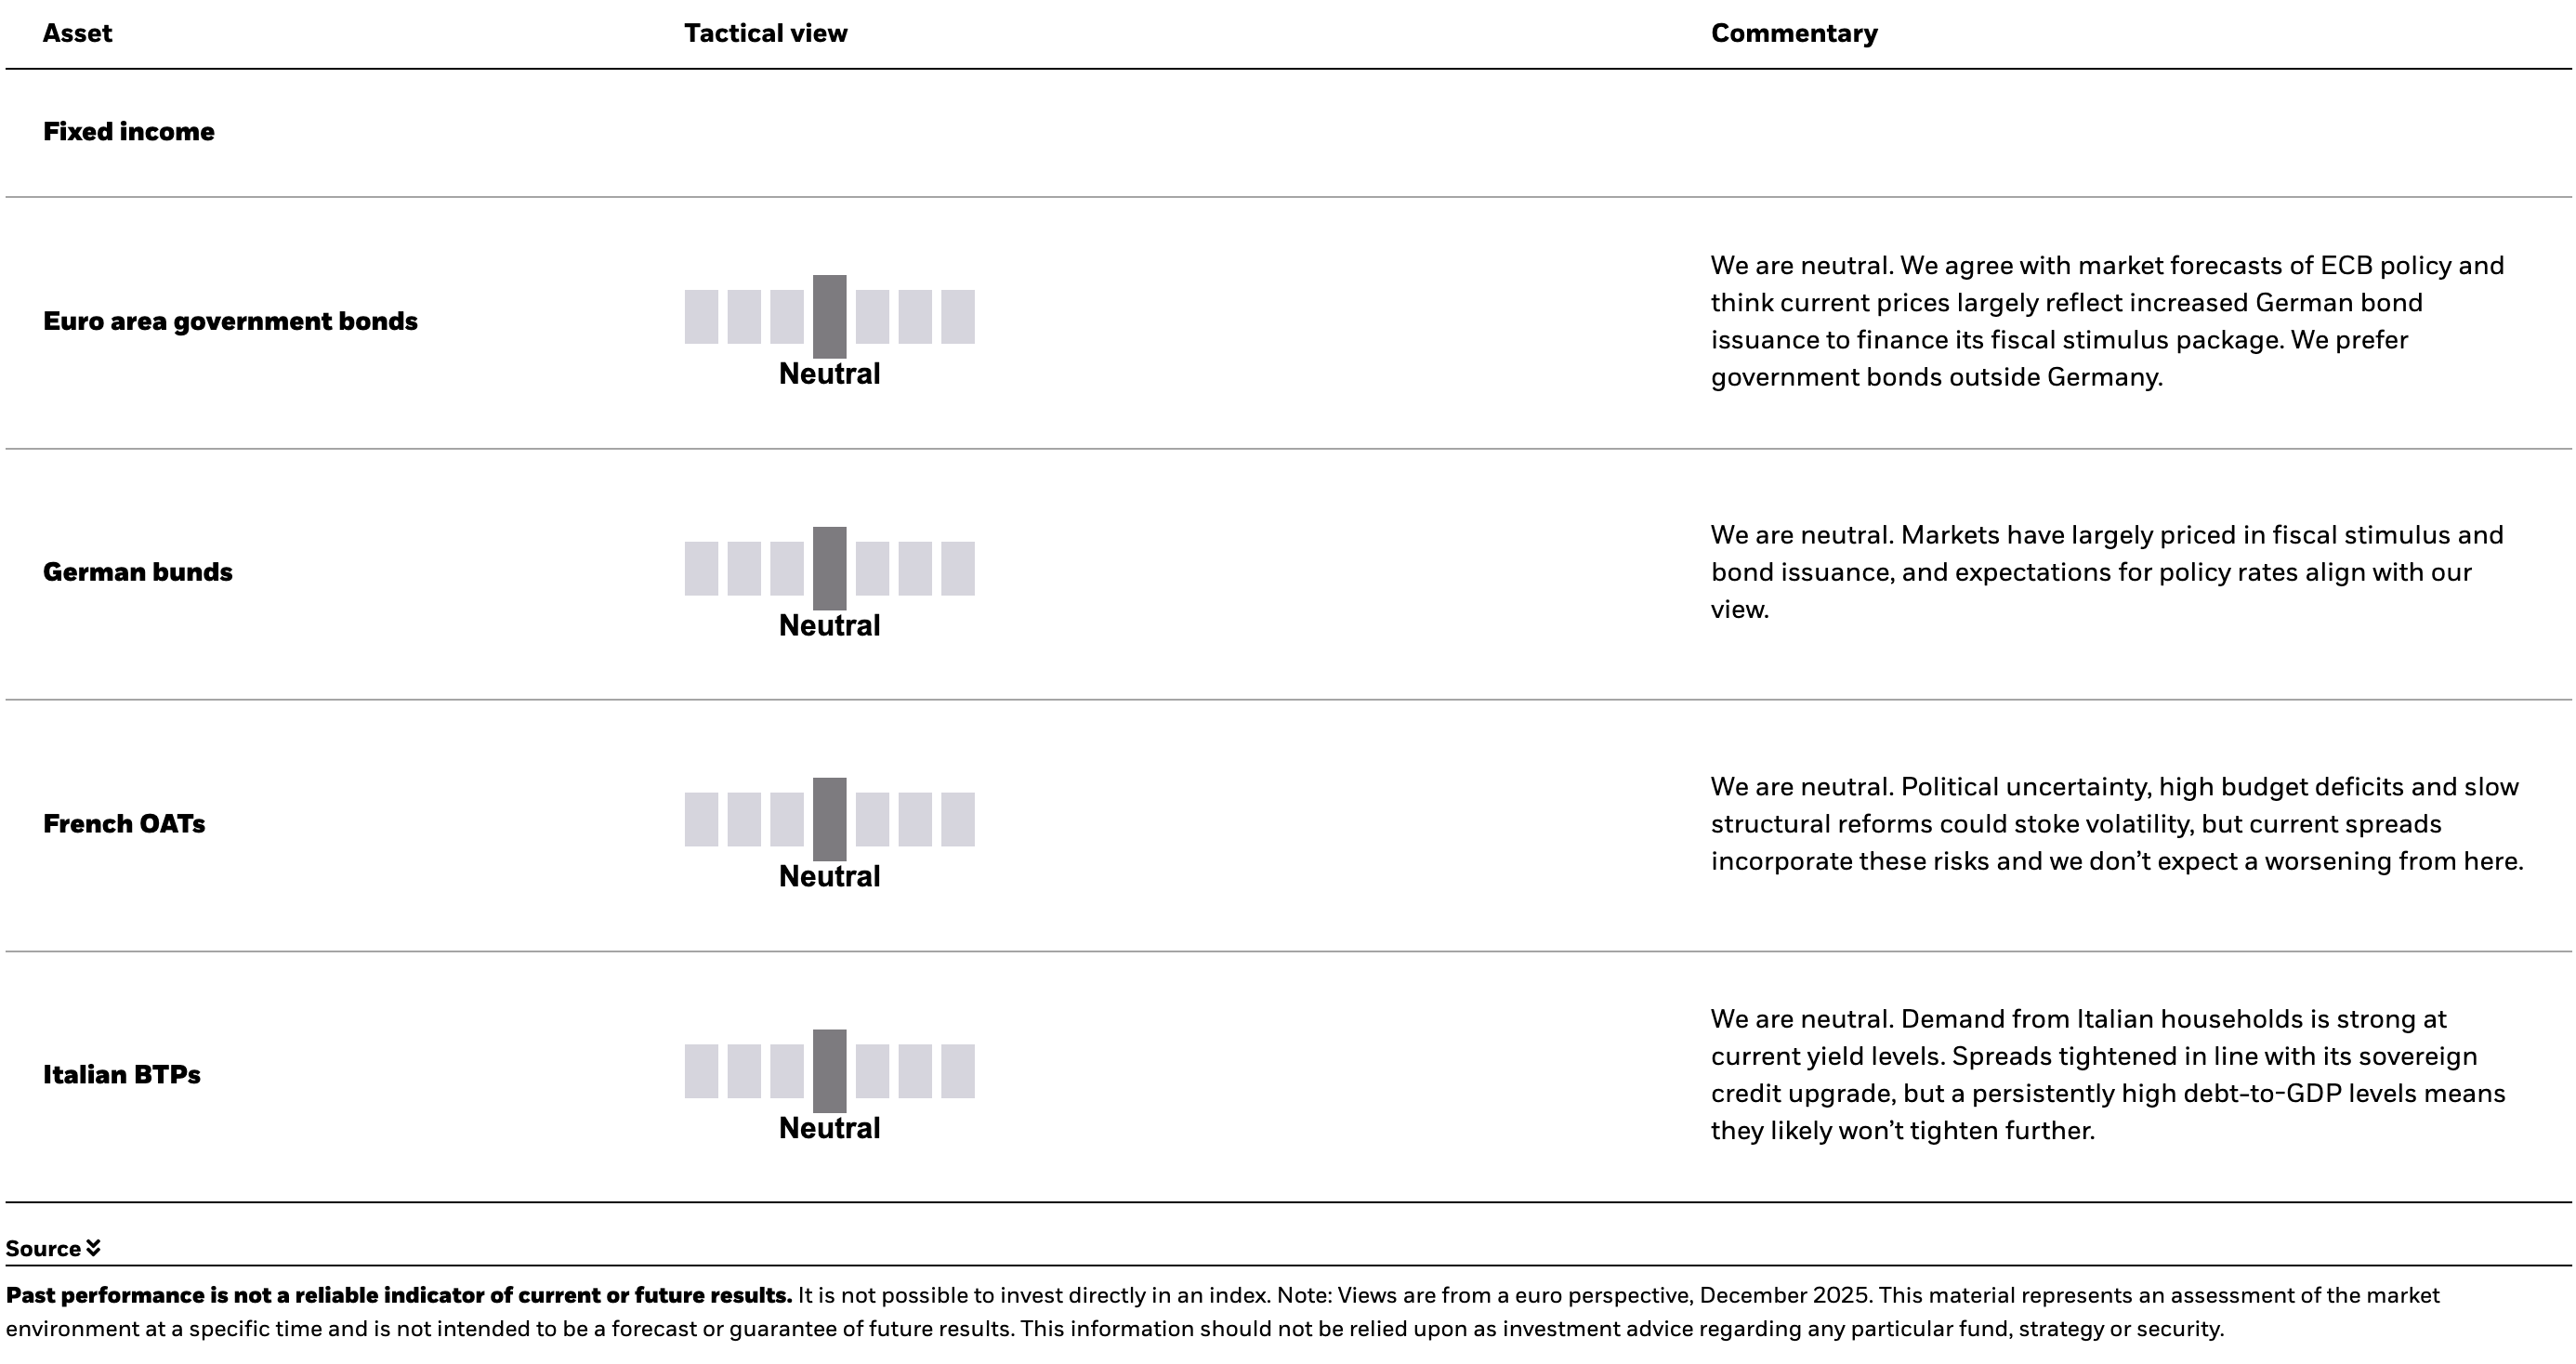
Euro-denominated tactical granular views
Six to 12-month tactical views on selected assets vs. broad global asset classes by level of conviction, December 2025
We have lengthened our tactical investment horizon back to six to 12 months. The table below reflects this and, importantly, leaves aside the opportunity for alpha, or the potential to generate above-benchmark returns – especially at a time of heightened volatility.
Copyright © BlackRock