by Richard Bernstein, Richard Bernstein Advisors
There have been two times in my career when speculation ran rampant, markets got frothy, and financial bubbles formed. One was the Tech Bubble and the other was the Housing Bubble. The current environment seems very much the same as those two periods, if not bigger.
That may sound like a warning but for long-term investors it’s actually a reason to be optimistic. Just as past bubbles ultimately gave way to powerful investment opportunities, we believe this one will too.
For every action, there is an equal and opposite reaction. Speculators’ extreme risk taking morphed into extreme conservatism after the bubbles deflated as surprisingly large losses spurred equally disproportionate fear.
One can never convince speculators that they are being imprudent during a bubble. After all, recklessness, not rationality and not sound fundamental analysis, is the life blood of such frothy periods. The point of this report is not to change short-term traders’ minds, but rather to merely show evidence that speculation is running rampant, and how that presents huge opportunities for more patient investors.
10 signs of extreme speculation/bubble:
-
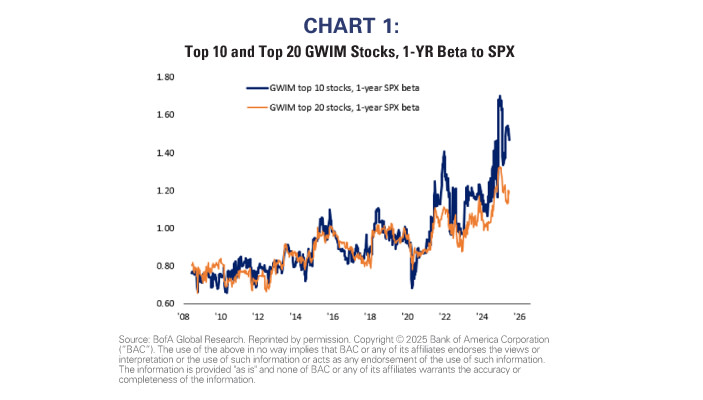
We have pointed out many times that private client equity beta is at all-times highs. As of the end of June, private clients’ equity beta was 1.5 for the top 10 holdings and 1.2 for the top 20 holdings. Both remain near the record levels of a few months ago.
2. Fund managers’ risk appetite has increased by the most in history during the last 3 months[1].
3. As of July 28th, 35% of average daily volume is now in stocks with prices less than $5[2].
4. Cryptocurrencies and meme coins continue to attract disproportionate capital despite that most will never have any economic purpose.
5. An increasing number of companies are abandoning their basic business models to hoard cryptocurrencies (they prefer to be called cryptocurrency “reserves”). It has become acceptable to borrow to facilitate hoarding.
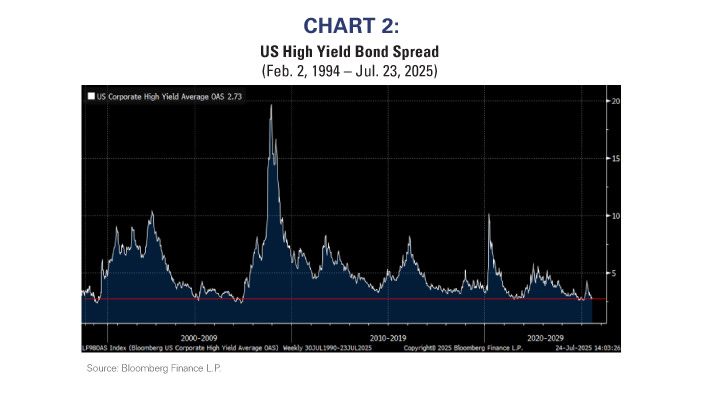
6. Credit spreads remain close to 20-year lows despite that the profits cycle appears poised to decelerate. The only time spreads were this narrow was prior to the Great Financial Crisis.
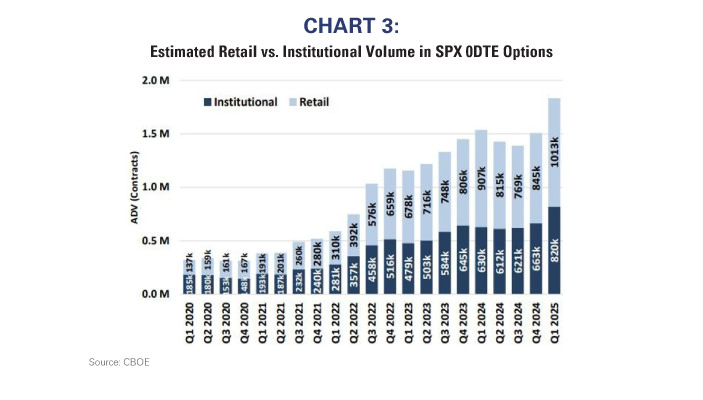
7. Individual investors’ use of zero-day options is at all-time highs and about 75% of levered ETFs market capitalization is held by individual investors[3].
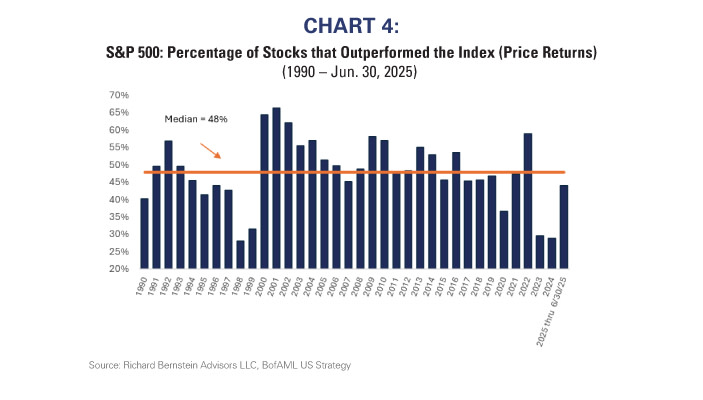
8. Narrow breadth is back in vogue. Goldman Sachs pointed out 2024 was the narrowest year in the US stock market since the Great Depression. Narrow leadership makes economic sense during a depression because companies are trying to survive let alone grow, and the few companies that can indeed grow lead the stock market. US economic growth has been healthy over the past several years, so the extraordinarily narrow leadership likely reflects speculation rather than historically weak fundamentals.
9. 70% of long-only fund managers now own 6 of the Magnificent 7 stocks, which represents an all- time high[4].
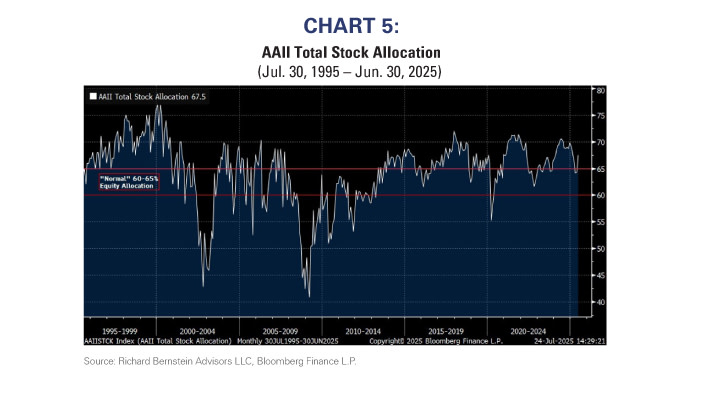
10. Although not extreme, individual investors’ stock allocations are above what is considered a “normal” allocation. History suggests some of the best times to overweight equities is when their allocations are well below normal. (Source: AAII)
What deflates the bubble?
Bubbles often end when financial conditions tighten, economic growth slows, and liquidity flows from speculation to necessities. Instead of day-trading, households are forced to use their cash flow to pay their mortgages, buy groceries, and buy gasoline for their cars.
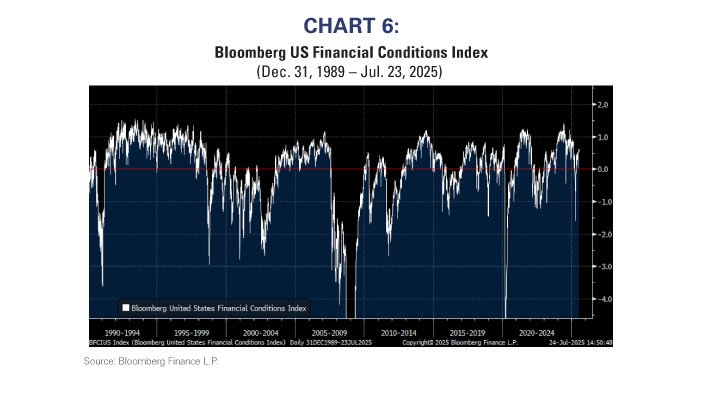
Financial conditions currently remain generous. However, if inflation proves more stubborn or growth slows more than is current consensus, history suggests that financial conditions could quickly change, and speculation accordingly stop.
Although seemingly forgotten, 2022’s stock market faced significant headwinds when the Fed was forced to tighten because of unanticipated inflation, and March 2025’s tariff-related inflation fears quickly tightened financial conditions and sent speculators scurrying.
Popular sectors, like Technology, Consumer Discretionary, and Communication Services were down between 25% and 40% during 2022, and they were all down more than 8% in a single month during March 2025.
So, it’s not a bad guess that any tightening of financial conditions, whether it is the Fed responding to higher inflation or growth slowing more than is expected, might cause speculation to reverse.
Investors versus speculators
This is not a bearish report. We believe investors are being presented with tremendous opportunities that are being overlooked by speculative, shorter-term traders. Opportunities, in sectors like dividend-paying stocks and non-US quality, present tremendous investment potential and currently dominate our portfolios.
Speculators should be wary, but investors should be licking their chops.
[1] Global Fund Manager Survey, July 15, 2025, BofA Global Research[2] NYSE US Equity Market Statistics, July 28, 2025[3] CNBC ETF Edge/Direxion, Feb 24, 2025[4] BofA Global Research, Active Managers’ Holdings, May 30, 2025. The Magnificent 7 (Mag 7) are a group of 7 widely-traded companies classified in the United States and representing the Communications, Consumer Discretionary and Technology sectors as defined by the Global Industry Classification Standard (GICS®) developed by MSCI Barra and Standard & Poor’s. These consist of AAPL, AMZN, GOOGL, META, MSFT, NVDA and TSLA.
INDEX DESCRIPTIONS: The following descriptions, while believed to be accurate, are in some cases abbreviated versions of more detailed or comprehensive definitions available from the sponsors or originators of the respective indices. Anyone interested in such further details is free to consult each such sponsor’s or originator’s website. The past performance of an index is not a guarantee of future results. Each index reflects an unmanaged universe of securities without any deduction for advisory fees or other expenses that would reduce actual returns, as well as the reinvestment of all income and dividends. An actual investment in the securities included in the index would require an investor to incur transaction costs, which would lower the performance results. Indices are not actively managed and investors cannot invest directly in the indices.Mag 7: The Bloomberg Magnificent 7 Total Return Index. The Bloomberg Magnificent 7 Total Return Index is an equal-dollar weighted equity benchmark consisting of a fixed basket of 7 widely-traded companies classified in the United States and representing the Communications, Consumer Discretionary and Technology sectors as defined by Bloomberg Industry Classification System (BICS). These consist of AAPL, AMZN, GOOGL, META, MSFT, NVDA and TSLA. International Quality: The MSCI World Ex USA Sector Neutral Quality Index. The MSCI World Ex USA Sector Neutral Quality Index measures the performance of international developed large and mid capitalization stocks exhibiting relatively higher quality characteristics as identified through the fundamental variables: ROE, earnings variability & debt-to-equity. US Stable Dividend Growth: The S&P High Yield Dividend Aristocrats Index. The index measures the performance of the highest dividend yielding S&P Composite 1500 Index constituents that have followed a managed-dividends policy consistently increasing dividends every year for at least 20 consecutive years. S&P 500®: The S&P 500® Index is an unmanaged, capitalization-weighted index designed to measure the performance of the broad US market. The index includes 500 leading companies covering approximately 80% of available market capitalization. Sectors: S&P 500® sectors in accordance with the Global Industry Classification Standard (GICS®) developed by MSCI Barra and Standard & Poor’s.
Copyright © Richard Bernstein Advisors

