by Raffaele Sevi and Jeff Shen, Systematic Investing, Blackrock
The second Trump presidency marks a new regime for government policy, with a range of potential macroeconomic and market implications. This quarter’s outlook focuses in on trade and tariffs—a source of significant uncertainty where change is underway early in the new administration. We assess how trade policy is influencing investment opportunities and risks through a range of data-driven, systematic insights.
The pillars of Trump 2.0 policy
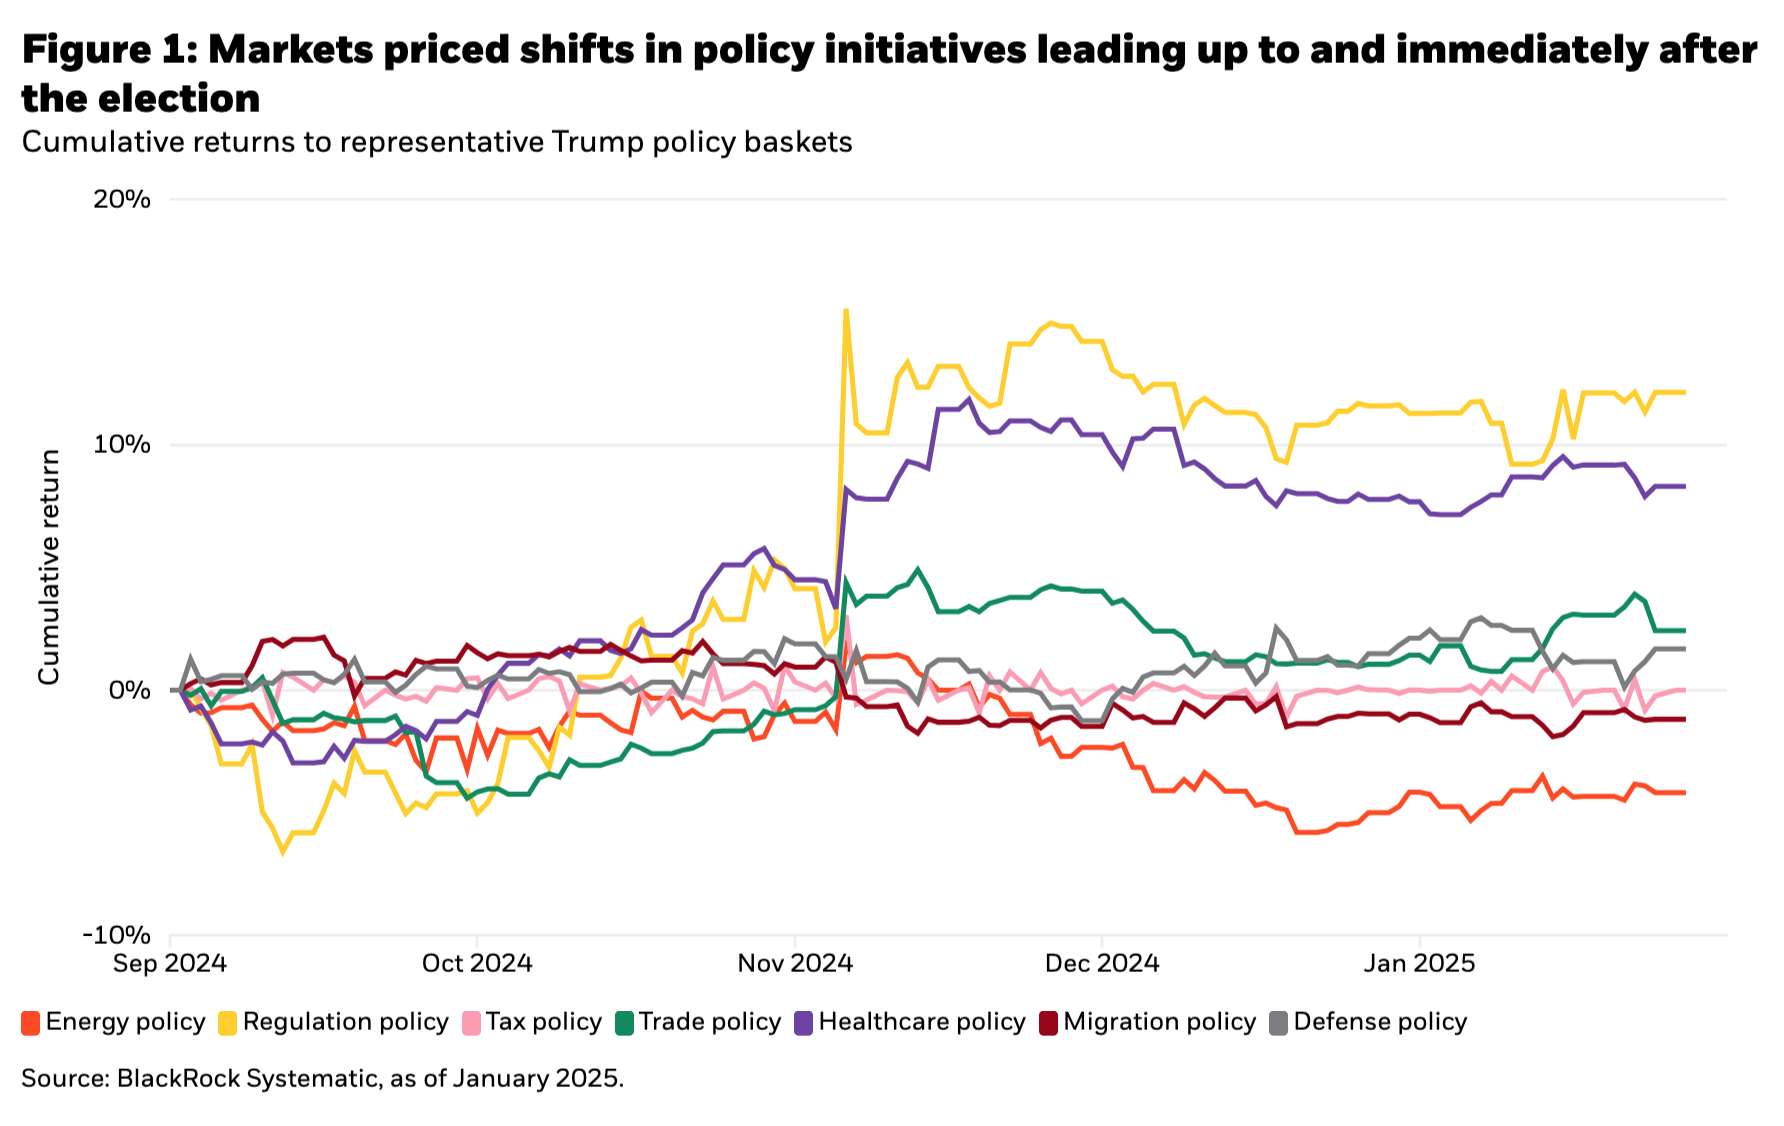
Looking across key policy priorities of the new administration, Figure 1 shows the performance of long-short equity baskets representing trade, regulation, defense, healthcare, energy, migration, and tax. In the period leading up to and immediately following the election result, markets began pricing in expectations for change across several of these sectors. Performance largely struggled in the weeks that followed, with many baskets ending the year below early-November highs as investors reassessed the degree that stated policy intentions will come to fruition and their overall impact.
Market expectations vs. potential policy reality
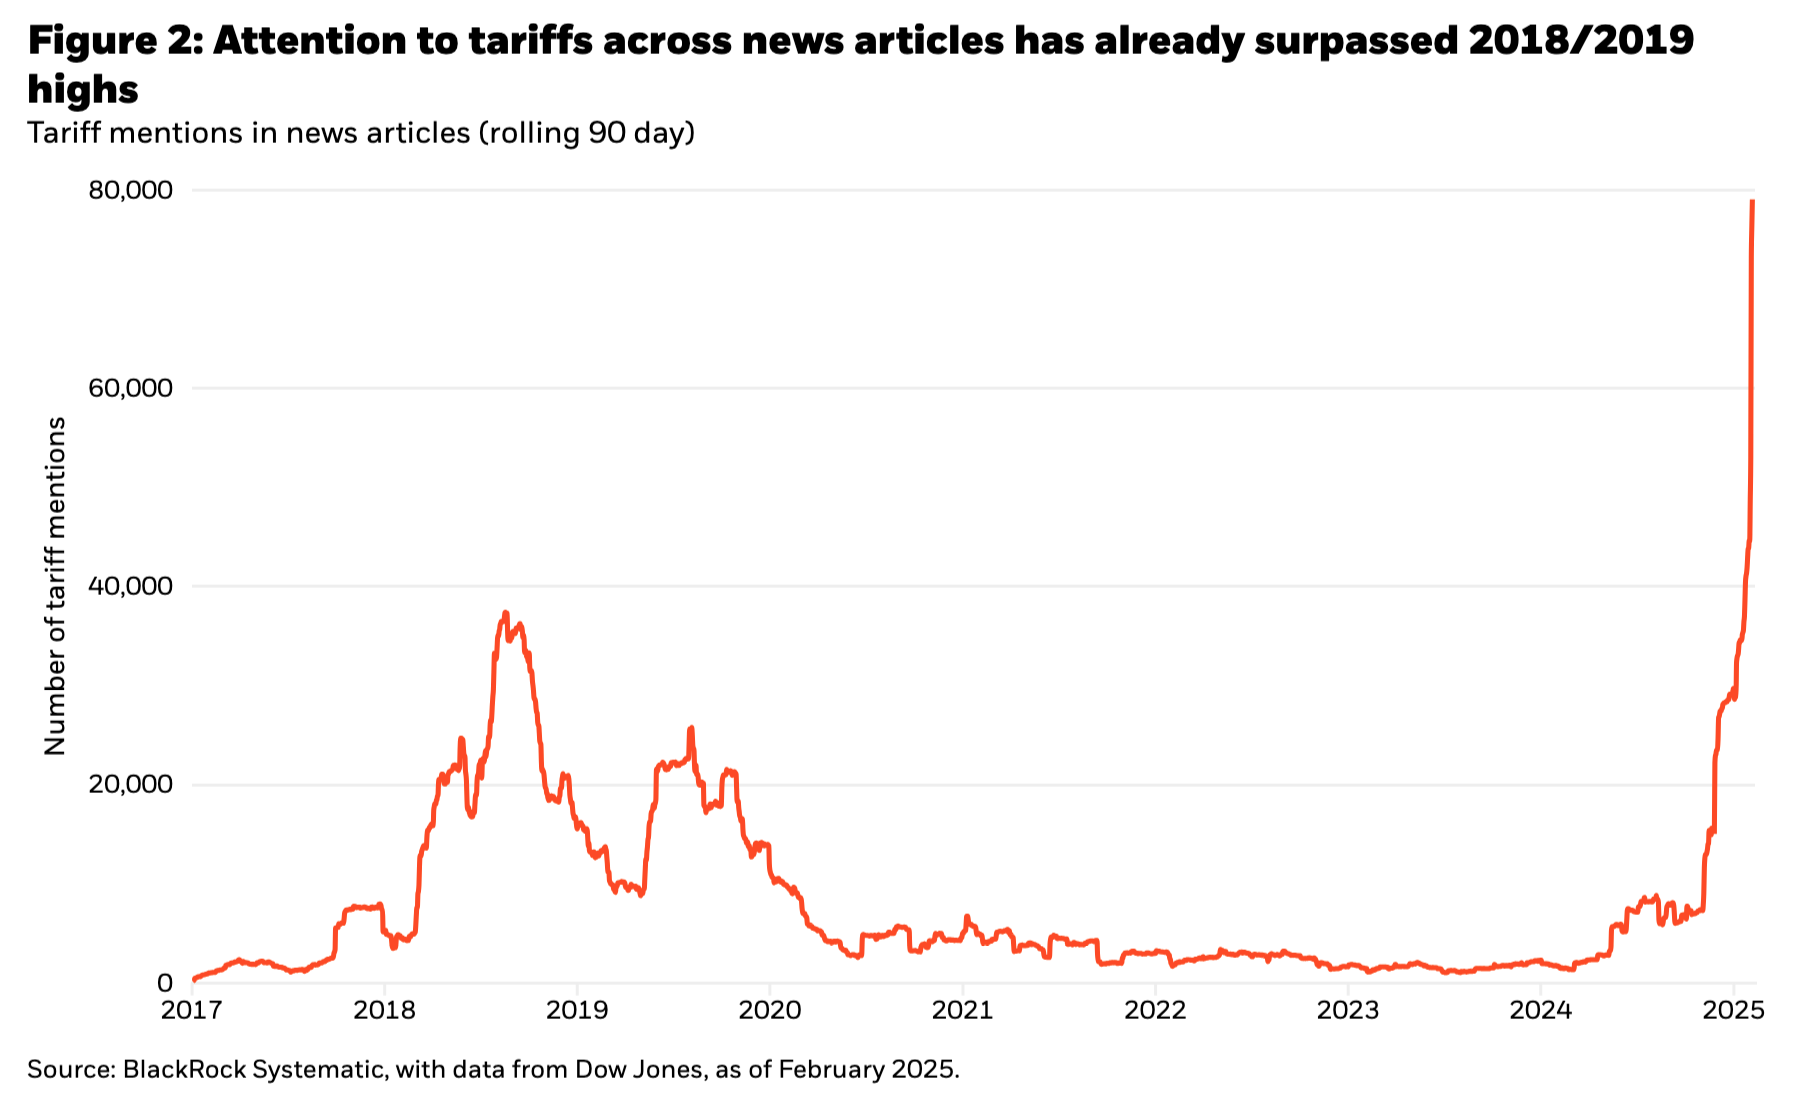
Among these pillars, trade policy stands out as a major source of uncertainty and volatility that has dominated headlines early on in Trump’s second presidency.
Figure 2 shows how news article mentions of tariffs—a proxy for market attention to the topic—have already significantly exceeded highs observed through the 2018/2019 period of tariff escalation during the first Trump administration.
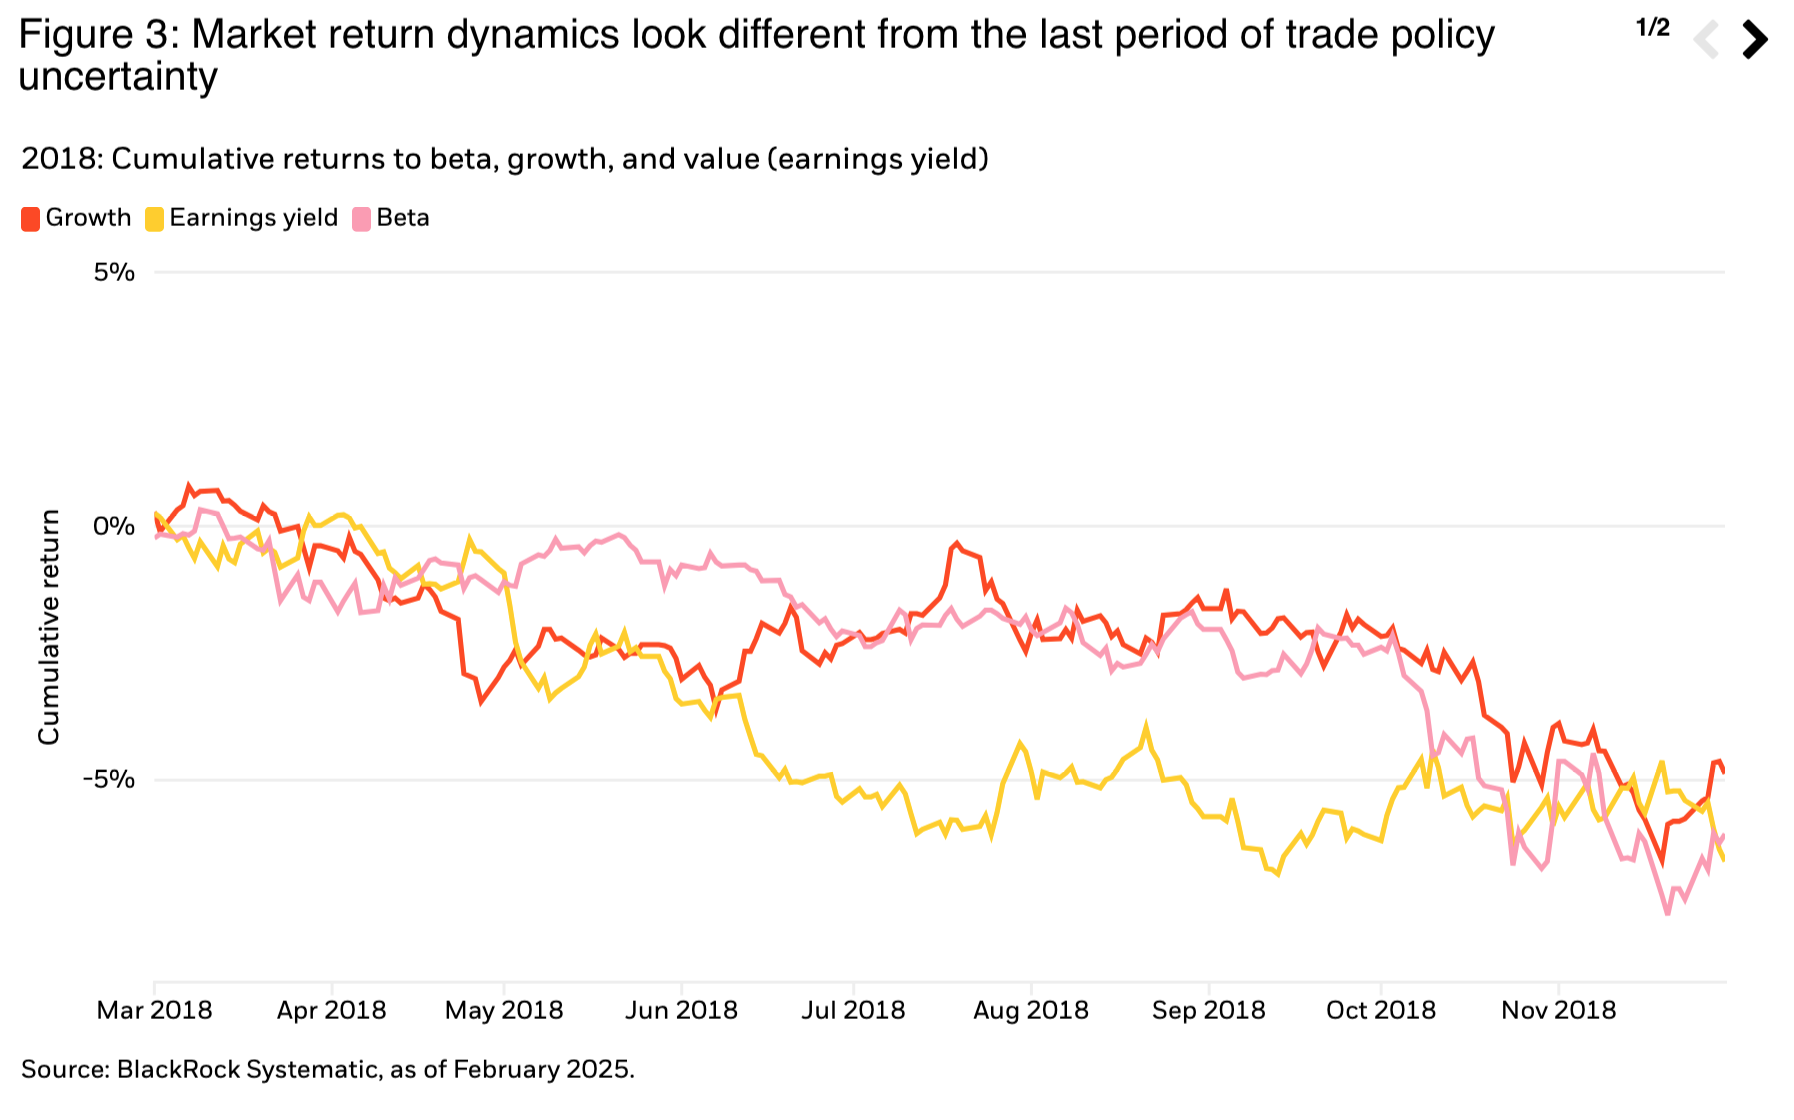
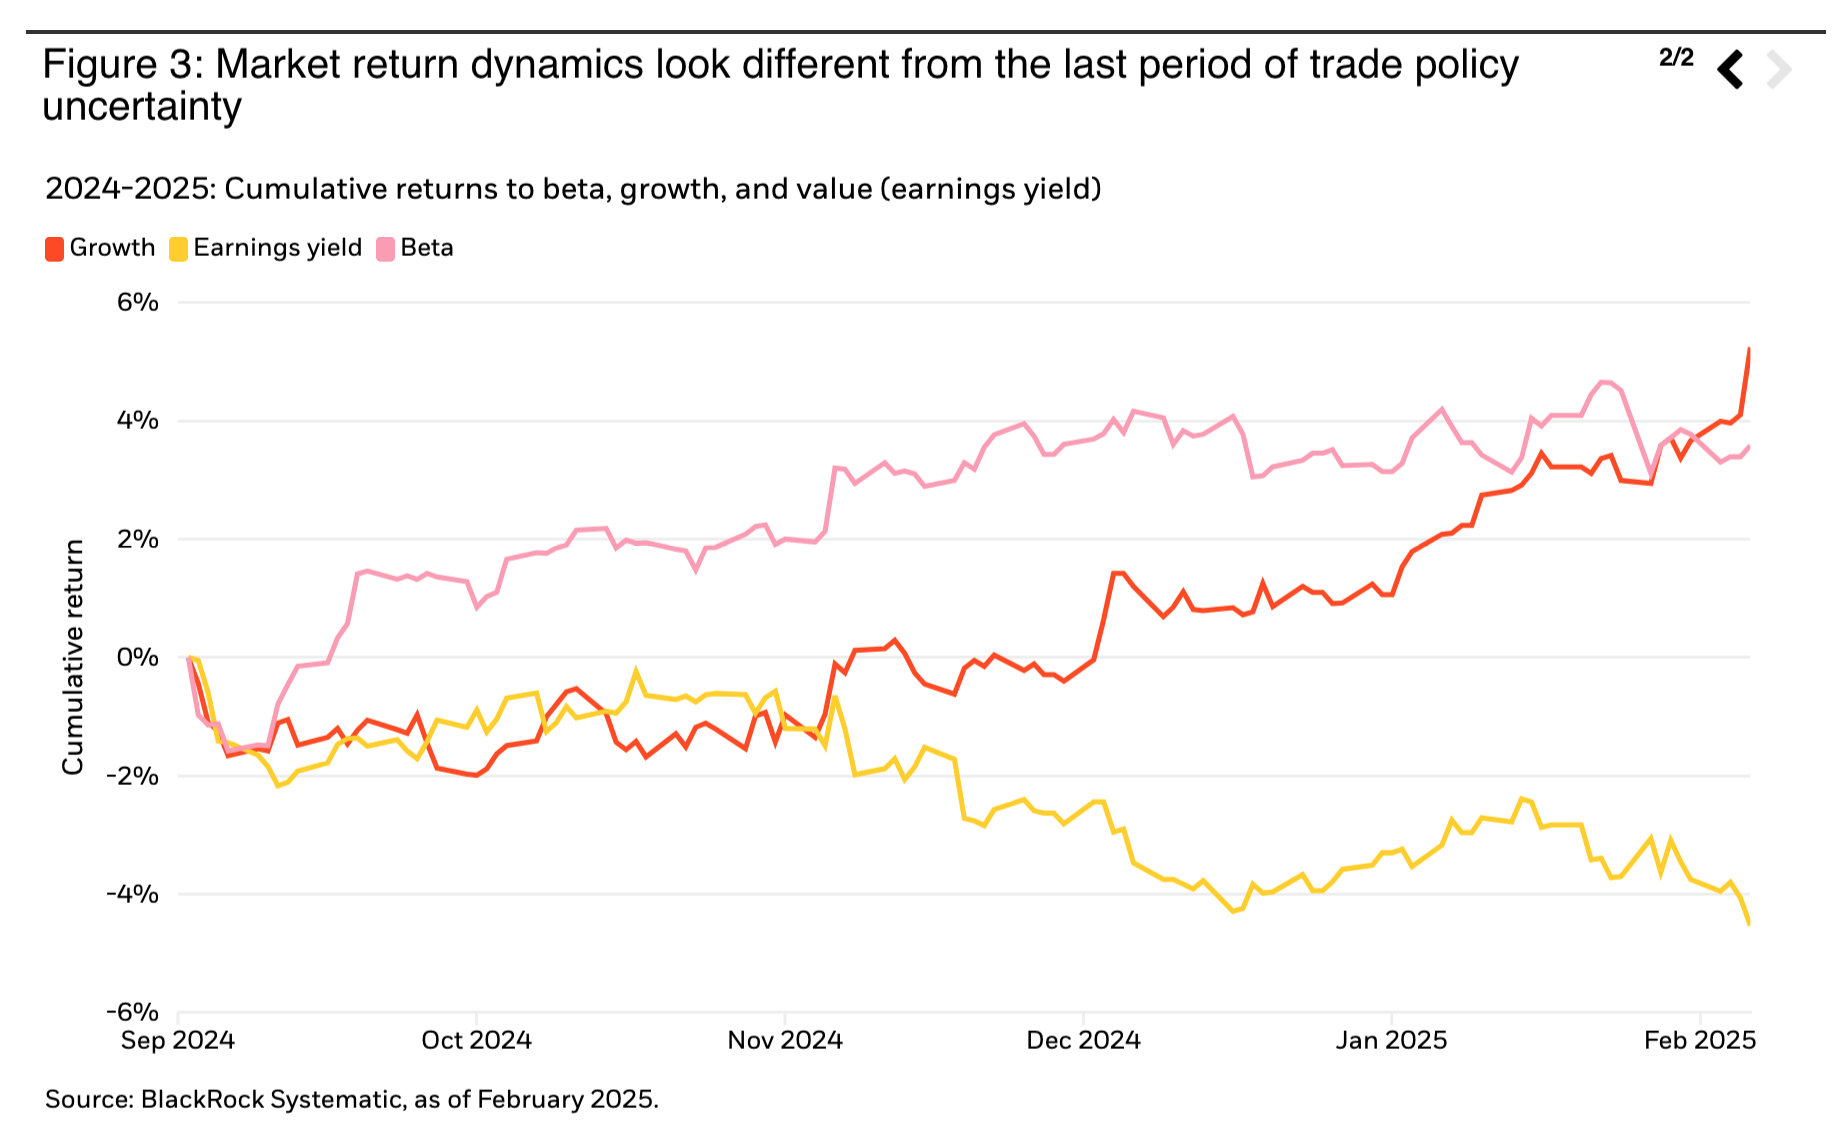
However, market return dynamics have looked different. Shown in Figure 3, market beta and growth and value styles struggled over the 2018 period. This time, beta and growth have shown strength as markets weigh the trade-offs of various policy pillars, so far appearing to emphasize the perceived positive impact of policies like deregulation.
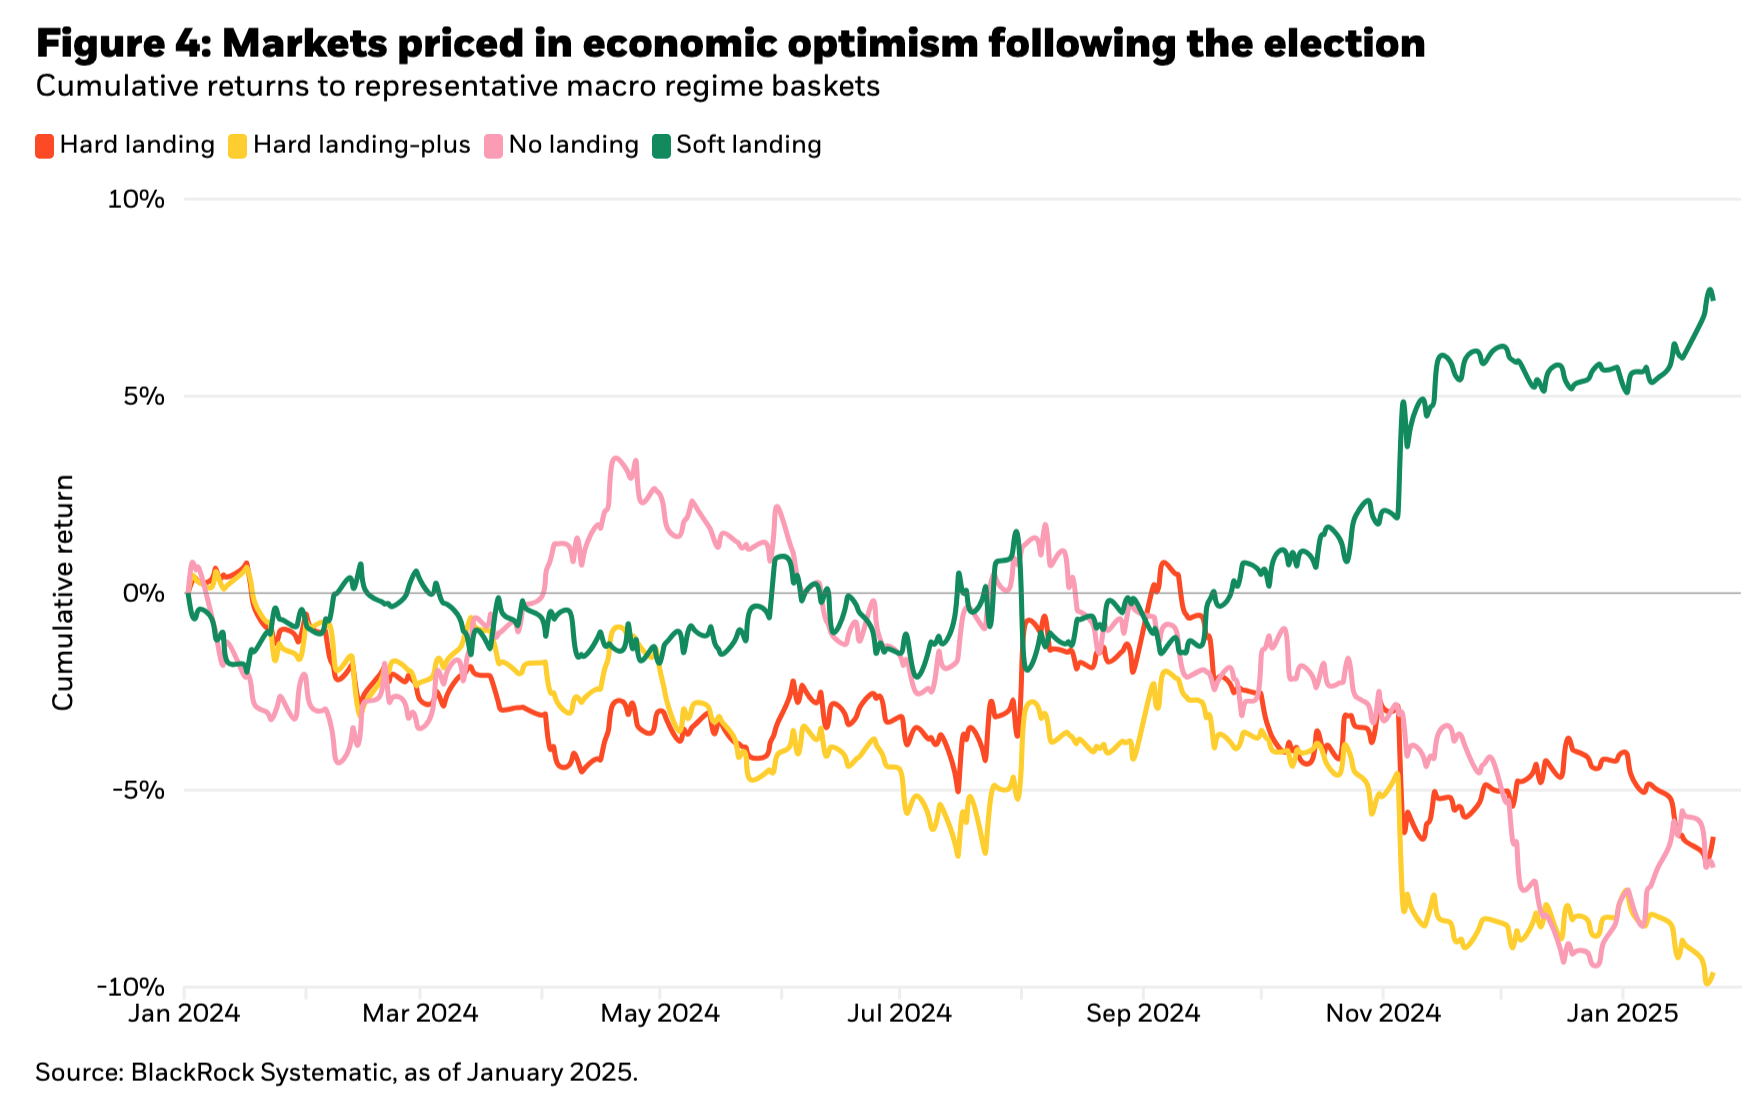
This is also reflected in returns to our macro regime baskets following the election result. These baskets align to a range of different economic outcomes based on historical returns during each scenario. Figure 4 shows the relative outperformance of the soft-landing basket following the election. In contrast, the “no landing” and hard-landing baskets lagged, suggesting limited concern over the potential inflationary or negative growth impact of tariffs.
With market trends diverging from Trump’s first presidency, how different might policy actions be this time around? We leverage the statistical accuracy of inputs from superforecasters to help estimate policy changes. We’d note the potential for outcomes to vary widely from these forecasts, underscoring the importance of remaining dynamic and agile as conditions evolve.
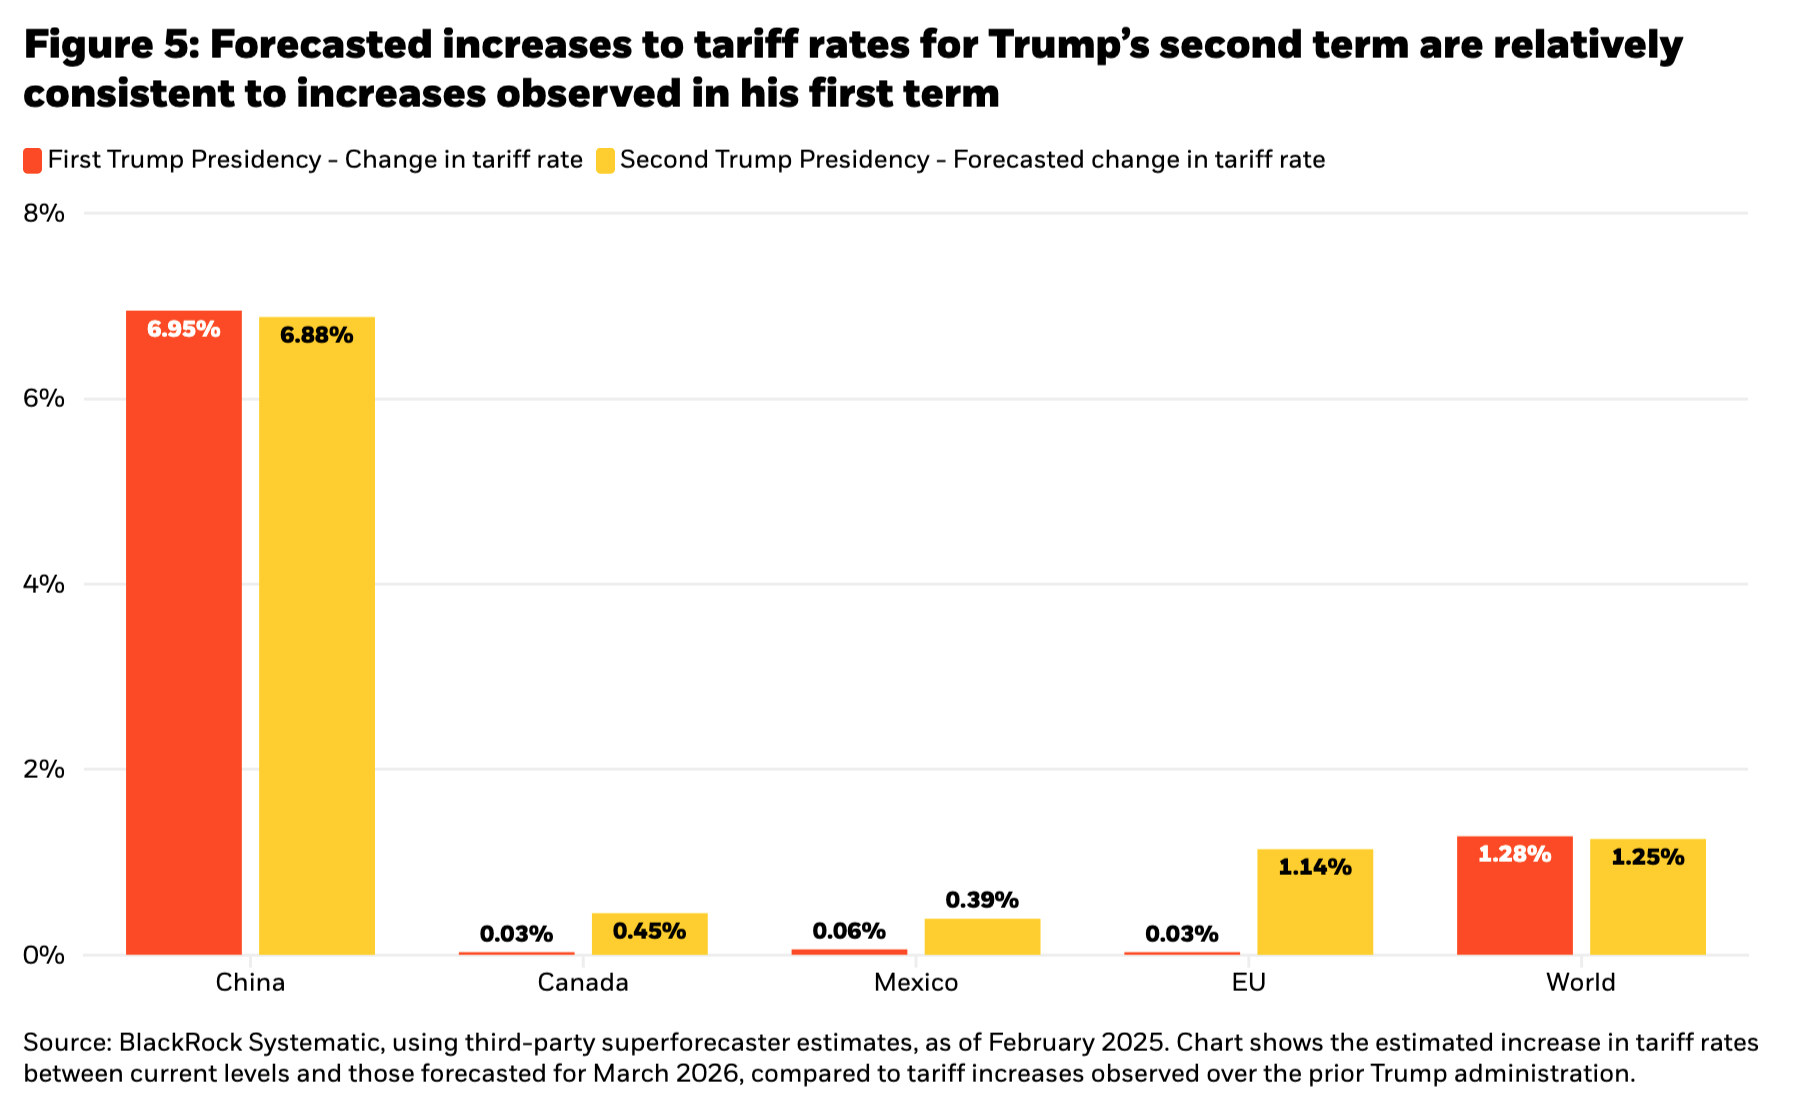
Figure 5 compares projected tariff rate increases for the upcoming year to those observed during the first Trump presidency. This gives a point of reference for how different policy action could be this time around. For example, additional increases to China tariffs are projected to be closely in line with increases over Trump’s prior term. Europe stands out as an area where increases could be more pronounced relative to 2018/2019. But at a high level, these forecasts suggest that tariffs should be about as significant as the last Trump administration.
Alpha opportunity in policy-driven divergence
If this is the case, it would imply that markets have yet to fully price the impact of higher tariffs. The high uncertainty surrounding US tariff escalation, potential retaliations, and other policy changes could contribute to increased volatility in directional exposures and more frequent reversals ahead.
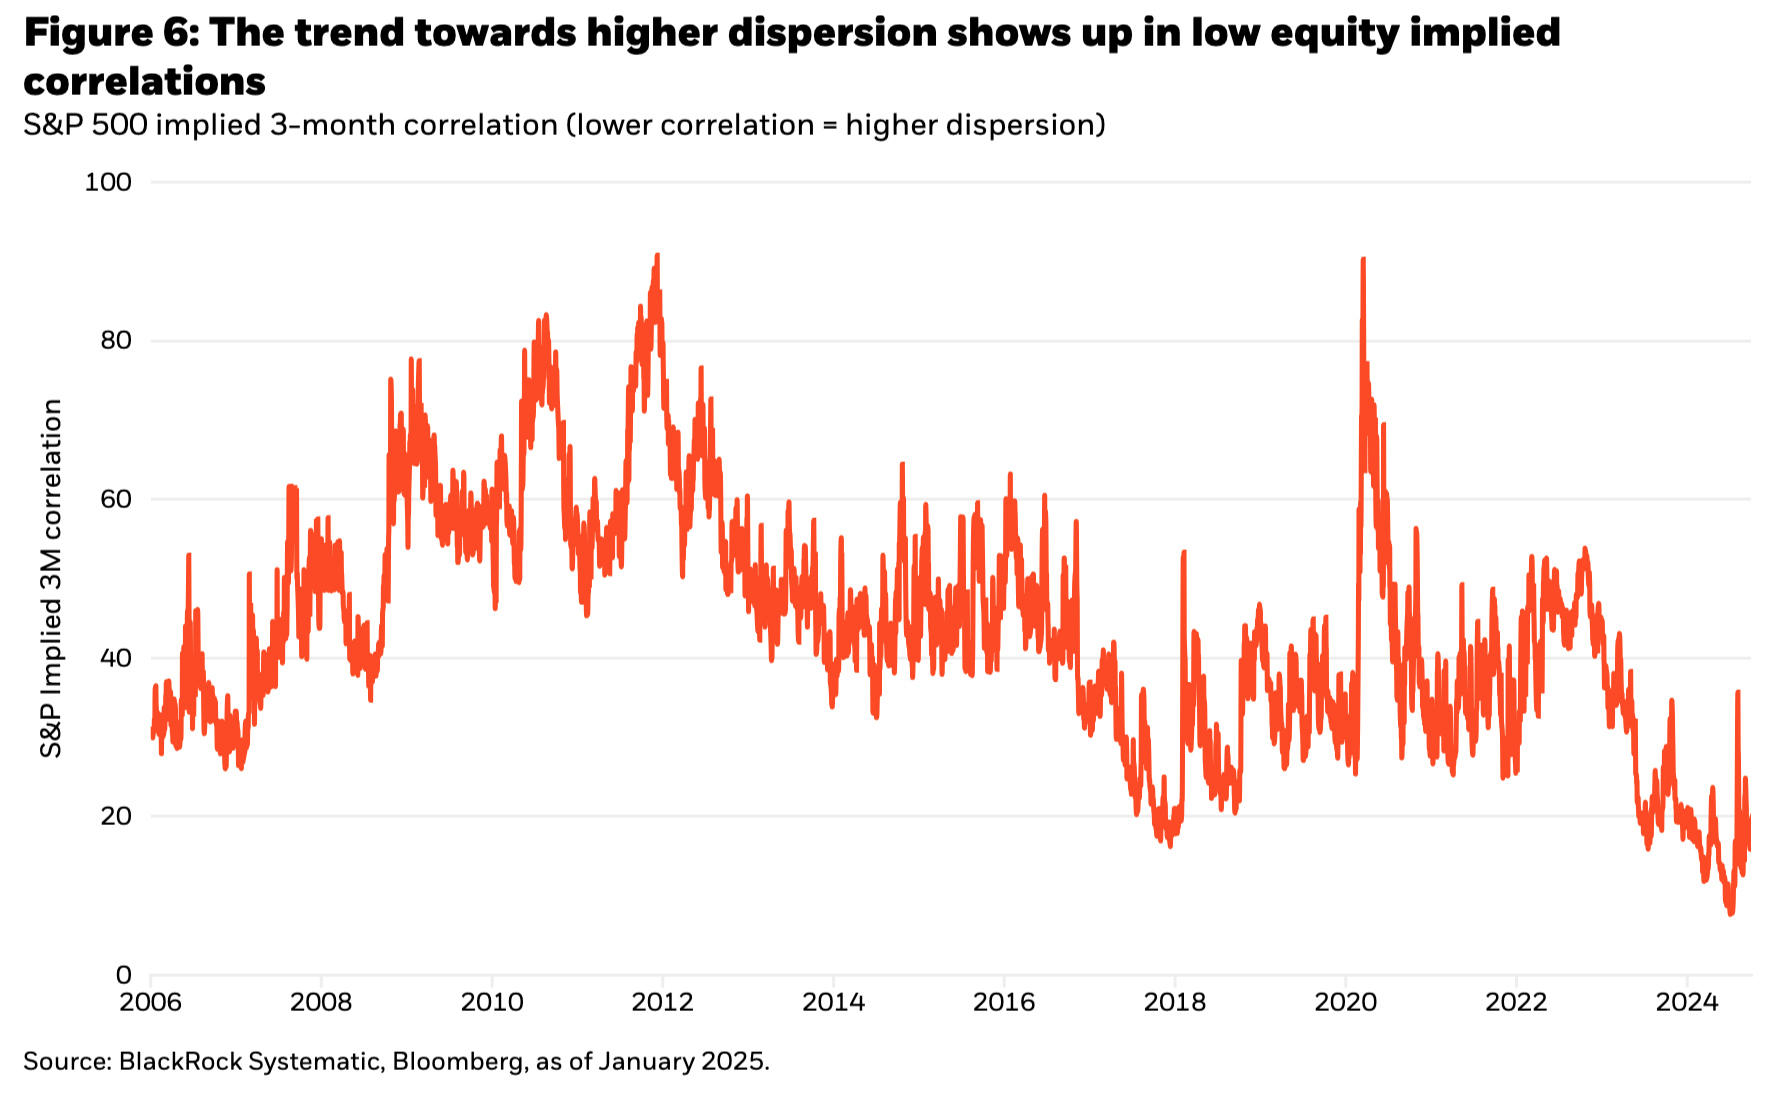
At the same time, this type of environment can drive elevated return dispersion beneath the surface as the level of sensitivity to these policy changes can vary widely across individual companies. This can be a tailwind for long-short equity strategies with reduced beta exposure, which take advantage of cross-sectional dispersion to generate alpha. Figure 6 shows how dispersion has become a defining characteristic of the post-COVID investment regime, with the low level of implied correlations across stocks reflecting greater divergence in company outcomes.
An alternative data edge in measuring tariff sensitivity
Our suite of alternative data insights related to trade policy provides a granular view of company sensitivity to these dynamics—helping to identify and exploit likely relative winners and losers across the equity market.
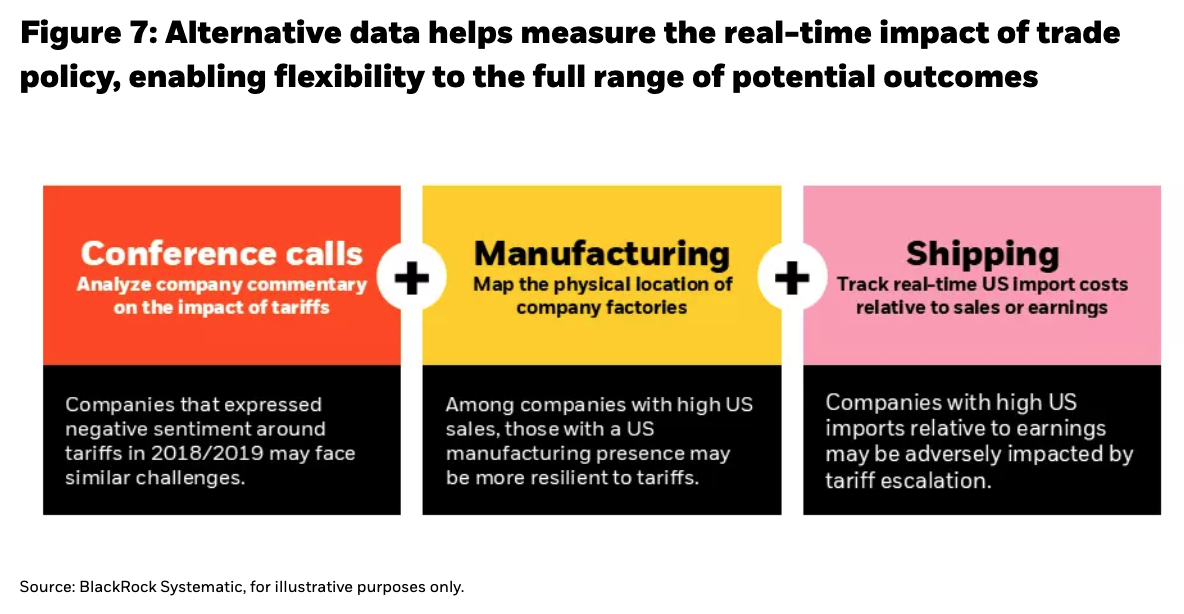
For instance, using a large language model supplemented with conference call transcripts from the 2018/2019 period, we can analyze how the sentiment of company commentary evolved over the prior period of tariff escalation. We find companies with complex global supply chains and those who primarily manufacture abroad with high US revenue exposure may be adversely impacted. This includes certain companies within consumer cyclicals, autos, and industrials.
Among companies with high sales exposure the US, we find that those with a strong manufacturing presence in the US are relative beneficiaries. We leverage alternative data on the physical location of factories to help identify these names. Beyond US companies emphasizing domestic reshoring, we can pinpoint non-US companies who may be more insulated from tariffs than investors might expect. For example, a European company with high US sales exposure may be relatively resilient to tariffs if they’ve built a strong physical manufacturing presence in the US. This also creates an opportunity to capitalize on dispersion between overseas companies producing and selling more in the US versus those dependent on revenue primarily from exports to the US.
We also track US import activity through real-time shipping data. We’ve identified companies with high US imports relative to their earnings to be most vulnerable to tariffs, with examples including a European chemical company, a European auto manufacturer, and certain US retail and industrial names. Furthermore, taking the effective tariff rate that companies are currently paying to import products into the US, we can adjust for expected increases in tariffs to forecast the future impact to earnings.
Used alongside our broader mosaic of alternative data, these text-based and geospatial insights help paint a real-time picture of tariff implications—helping us to navigate this highly uncertain backdrop with dynamism.
Macro strength meets trade policy uncertainty
If tariffs were to be applied aggressively and quickly, that could pose a potential threat to the macroeconomic outlook. For instance, in 2019 industrial production globally started to slump with the implementation of tariffs. This raises the question of how the current US economy is positioned for potential changes in trade policy.
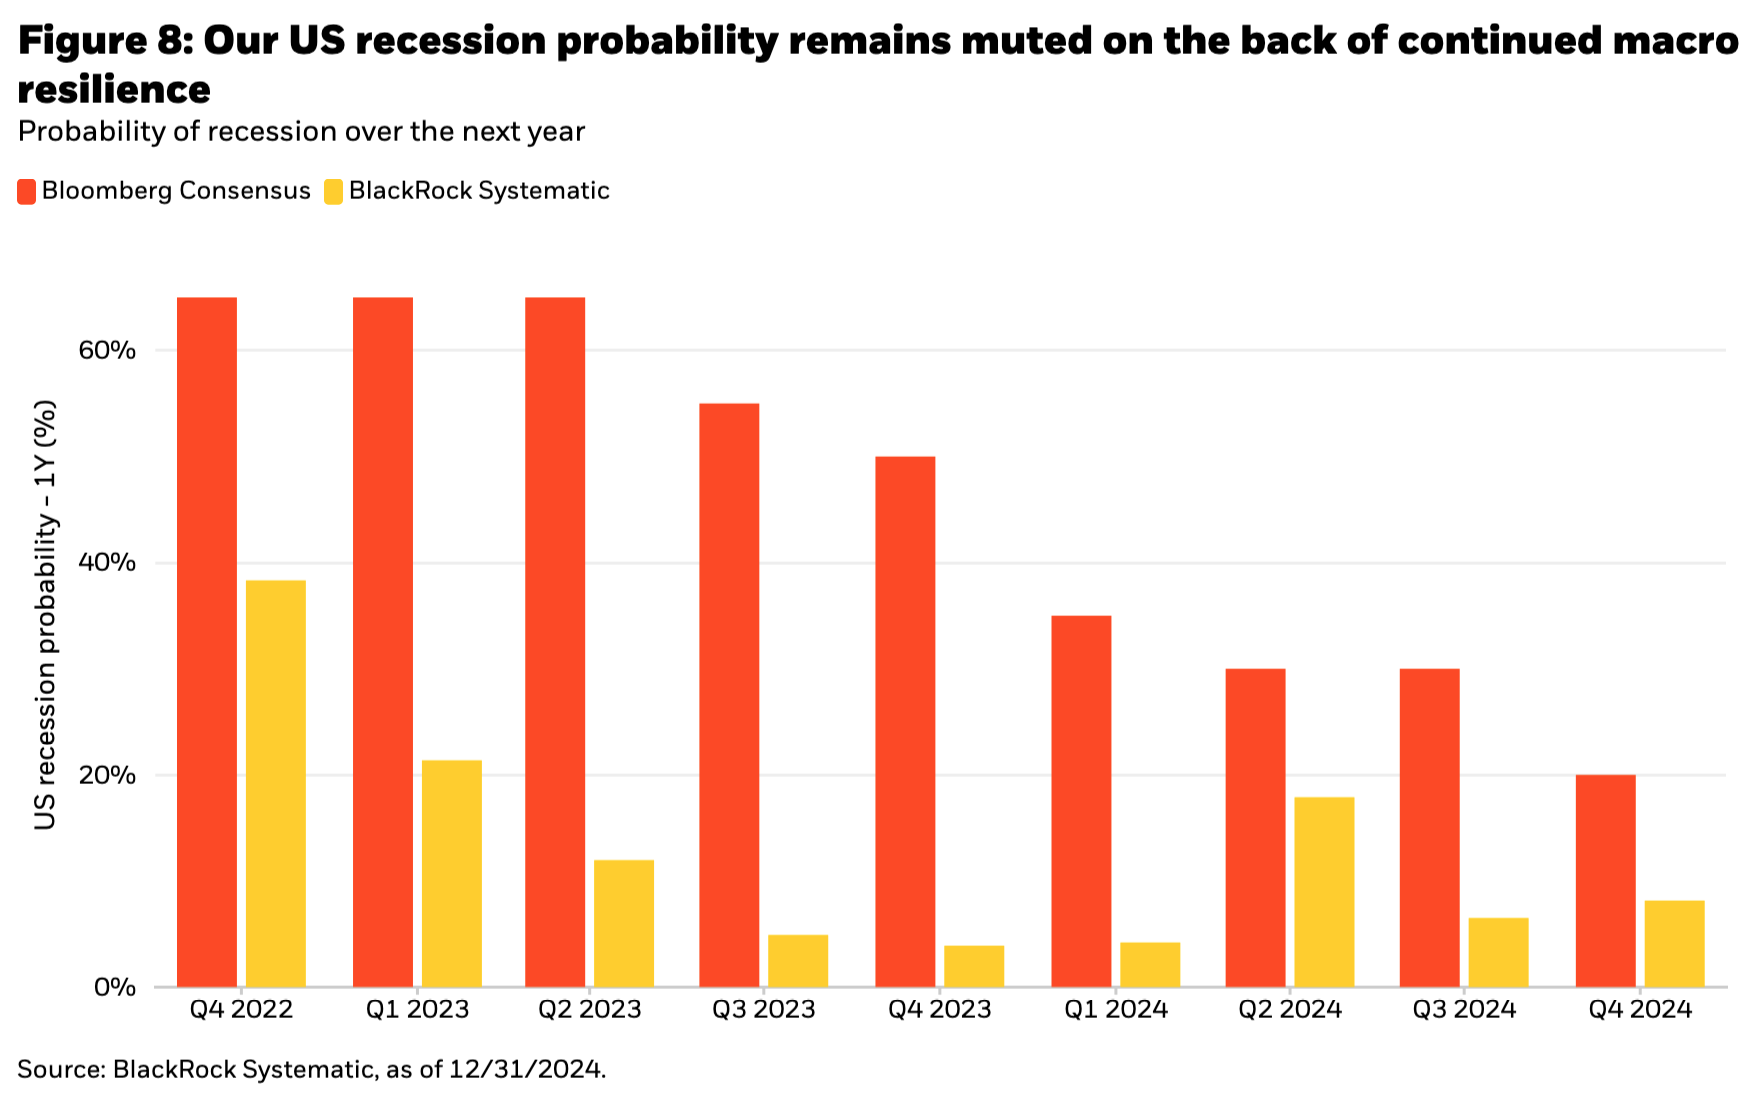
Figure 8 shows that our estimated US recession probability remains muted and has come down from Q2 2024, with Bloomberg consensus expectations increasingly converging towards our view over recent months. Recent declines in our recession probability model are driven by inputs like strong consumer auto sales and yield curve disinversion.
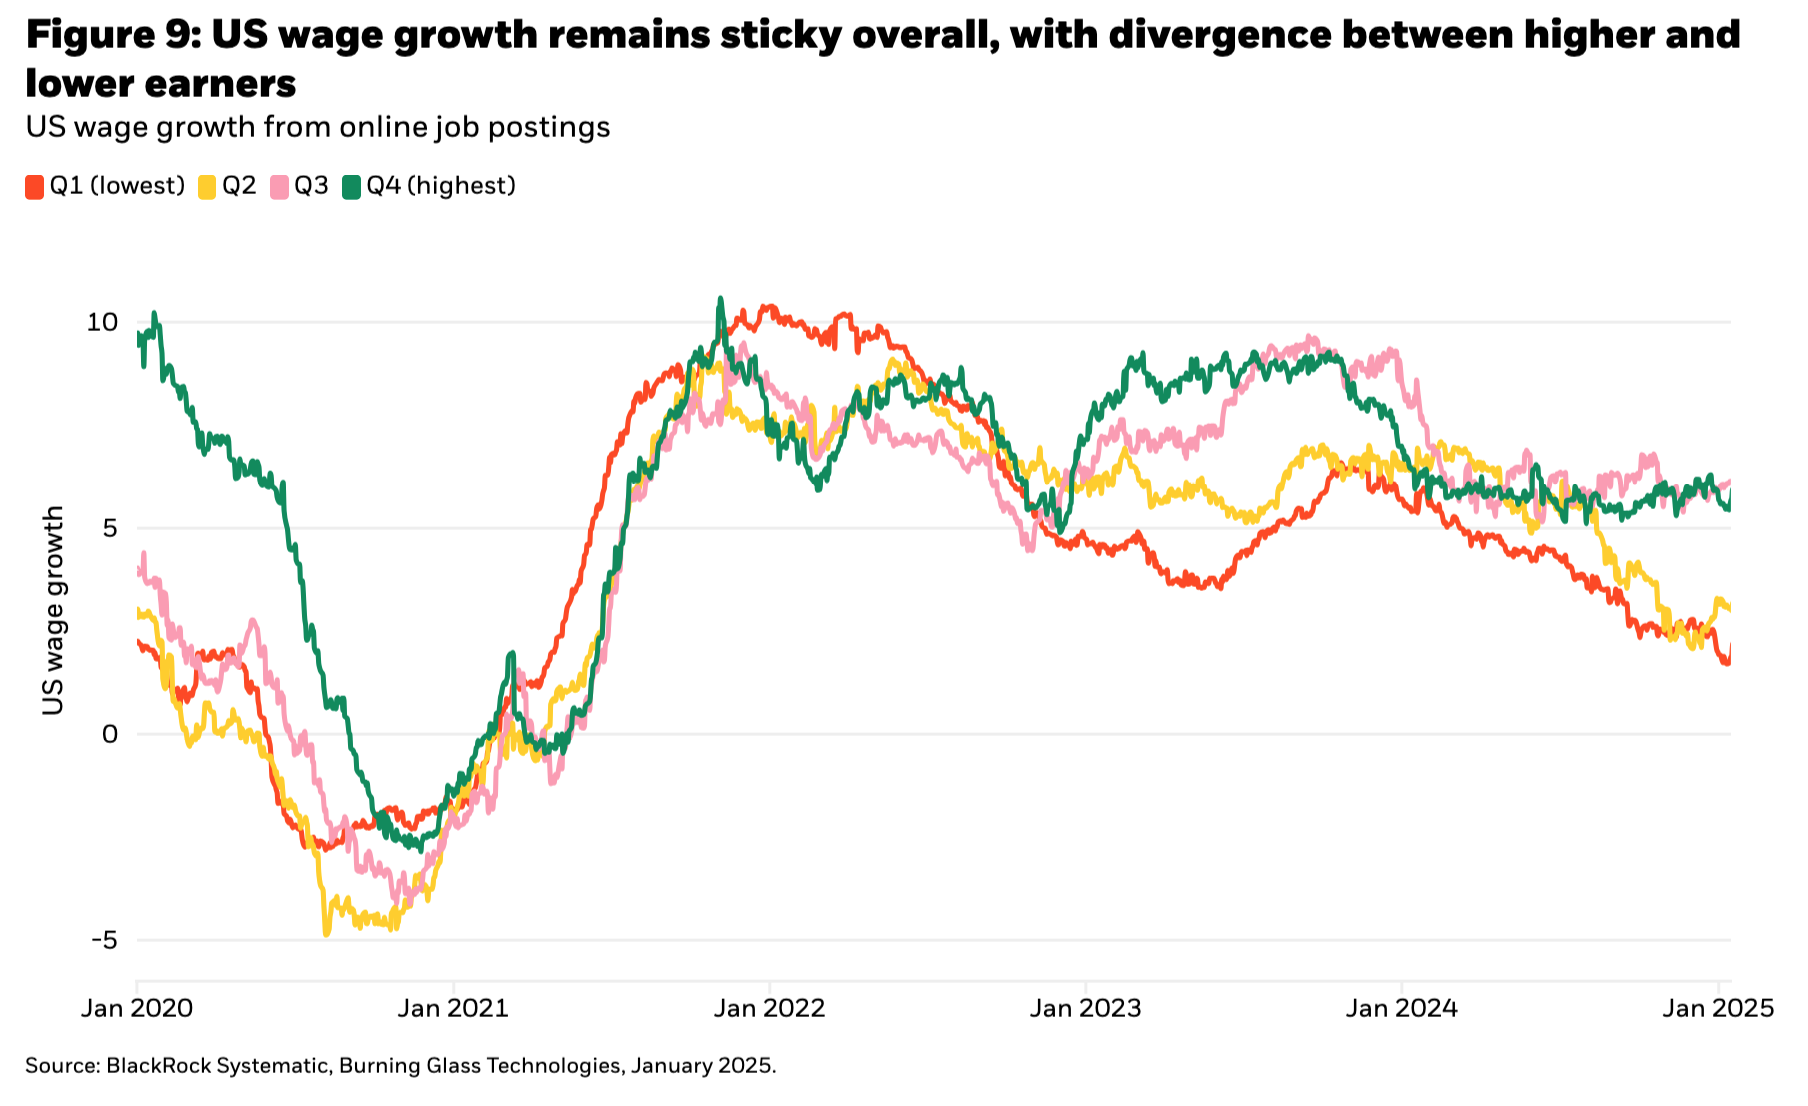
The pace of progress in the normalization of US wage inflation has stalled over recent months based on our real-time view from online job postings. Along with the potential for continued sticky services inflation, Figure 9 shows evidence of the K-shaped economy playing out in the labor market with a growing divide between wage growth for higher and lower paying jobs (Q1 being the lowest and Q4 being the highest). Wage pressures have remained most elevated for higher income cohorts where consumer spending power could have a larger aggregate economic impact, supporting the outlook for continued robust consumer activity.
Conclusion
Uncertainty surrounding trade policy is high, and markets have yet to fully price the potential escalation of tariffs. This could pose a risk to market beta but the range of potential outcomes presents an opportunity for alpha-oriented strategies that can take advantage of higher dispersion in company outcomes as firms adapt to policy change with varying degrees of success. As systematic investors, alternative data provides a real-time view of how tariffs are impacting companies across the breadth of the market—allowing us to dynamically navigate a range of possible scenarios.