


by Jeffrey Rosenberg, Managing Director, Systematic Fixed Income, BlackRock
Key points
- The Fed pause that gives pause: Stronger-than-expected inflation and labor market data into the end of 2024 led to the US Federal Reserve's (“Fed’s”) decision to pause interest rate cuts. Easier financial conditions, along with positive real wage growth, have bolstered wealth and consumer spending. These dynamics have reduced the impact of higher interest rates on the real economy relative to historical cycles, so far requiring less normalization than policymakers previously expected.
- Policy uncertainty trumps macro uncertainty: Fears of a recession induced by tight monetary policy have continued to fade with signs of persistent economic strength. Market focus has shifted to governmental policy uncertainty as investors weigh possible changes to be implemented by the new administration, with the biggest areas of focus being potential negative surprises from trade and immigration policies and potential positive surprises related to taxes and deregulation.
- Navigating the (new) conundrum: Our prediction for a “new conundrum” played out in 2024 as long-end yields moved higher despite the start of interest rate cuts—going against the “bonds are back” consensus narrative. For 2025, the potential for further steepening reinforces the importance of where you hold your duration, with the short-end and belly of the curve appearing most attractive.
The Fed pause that gives pause
Stubborn inflation and strong labor market indicators raise concerns that policy could be less restrictive than the Fed previously thought.
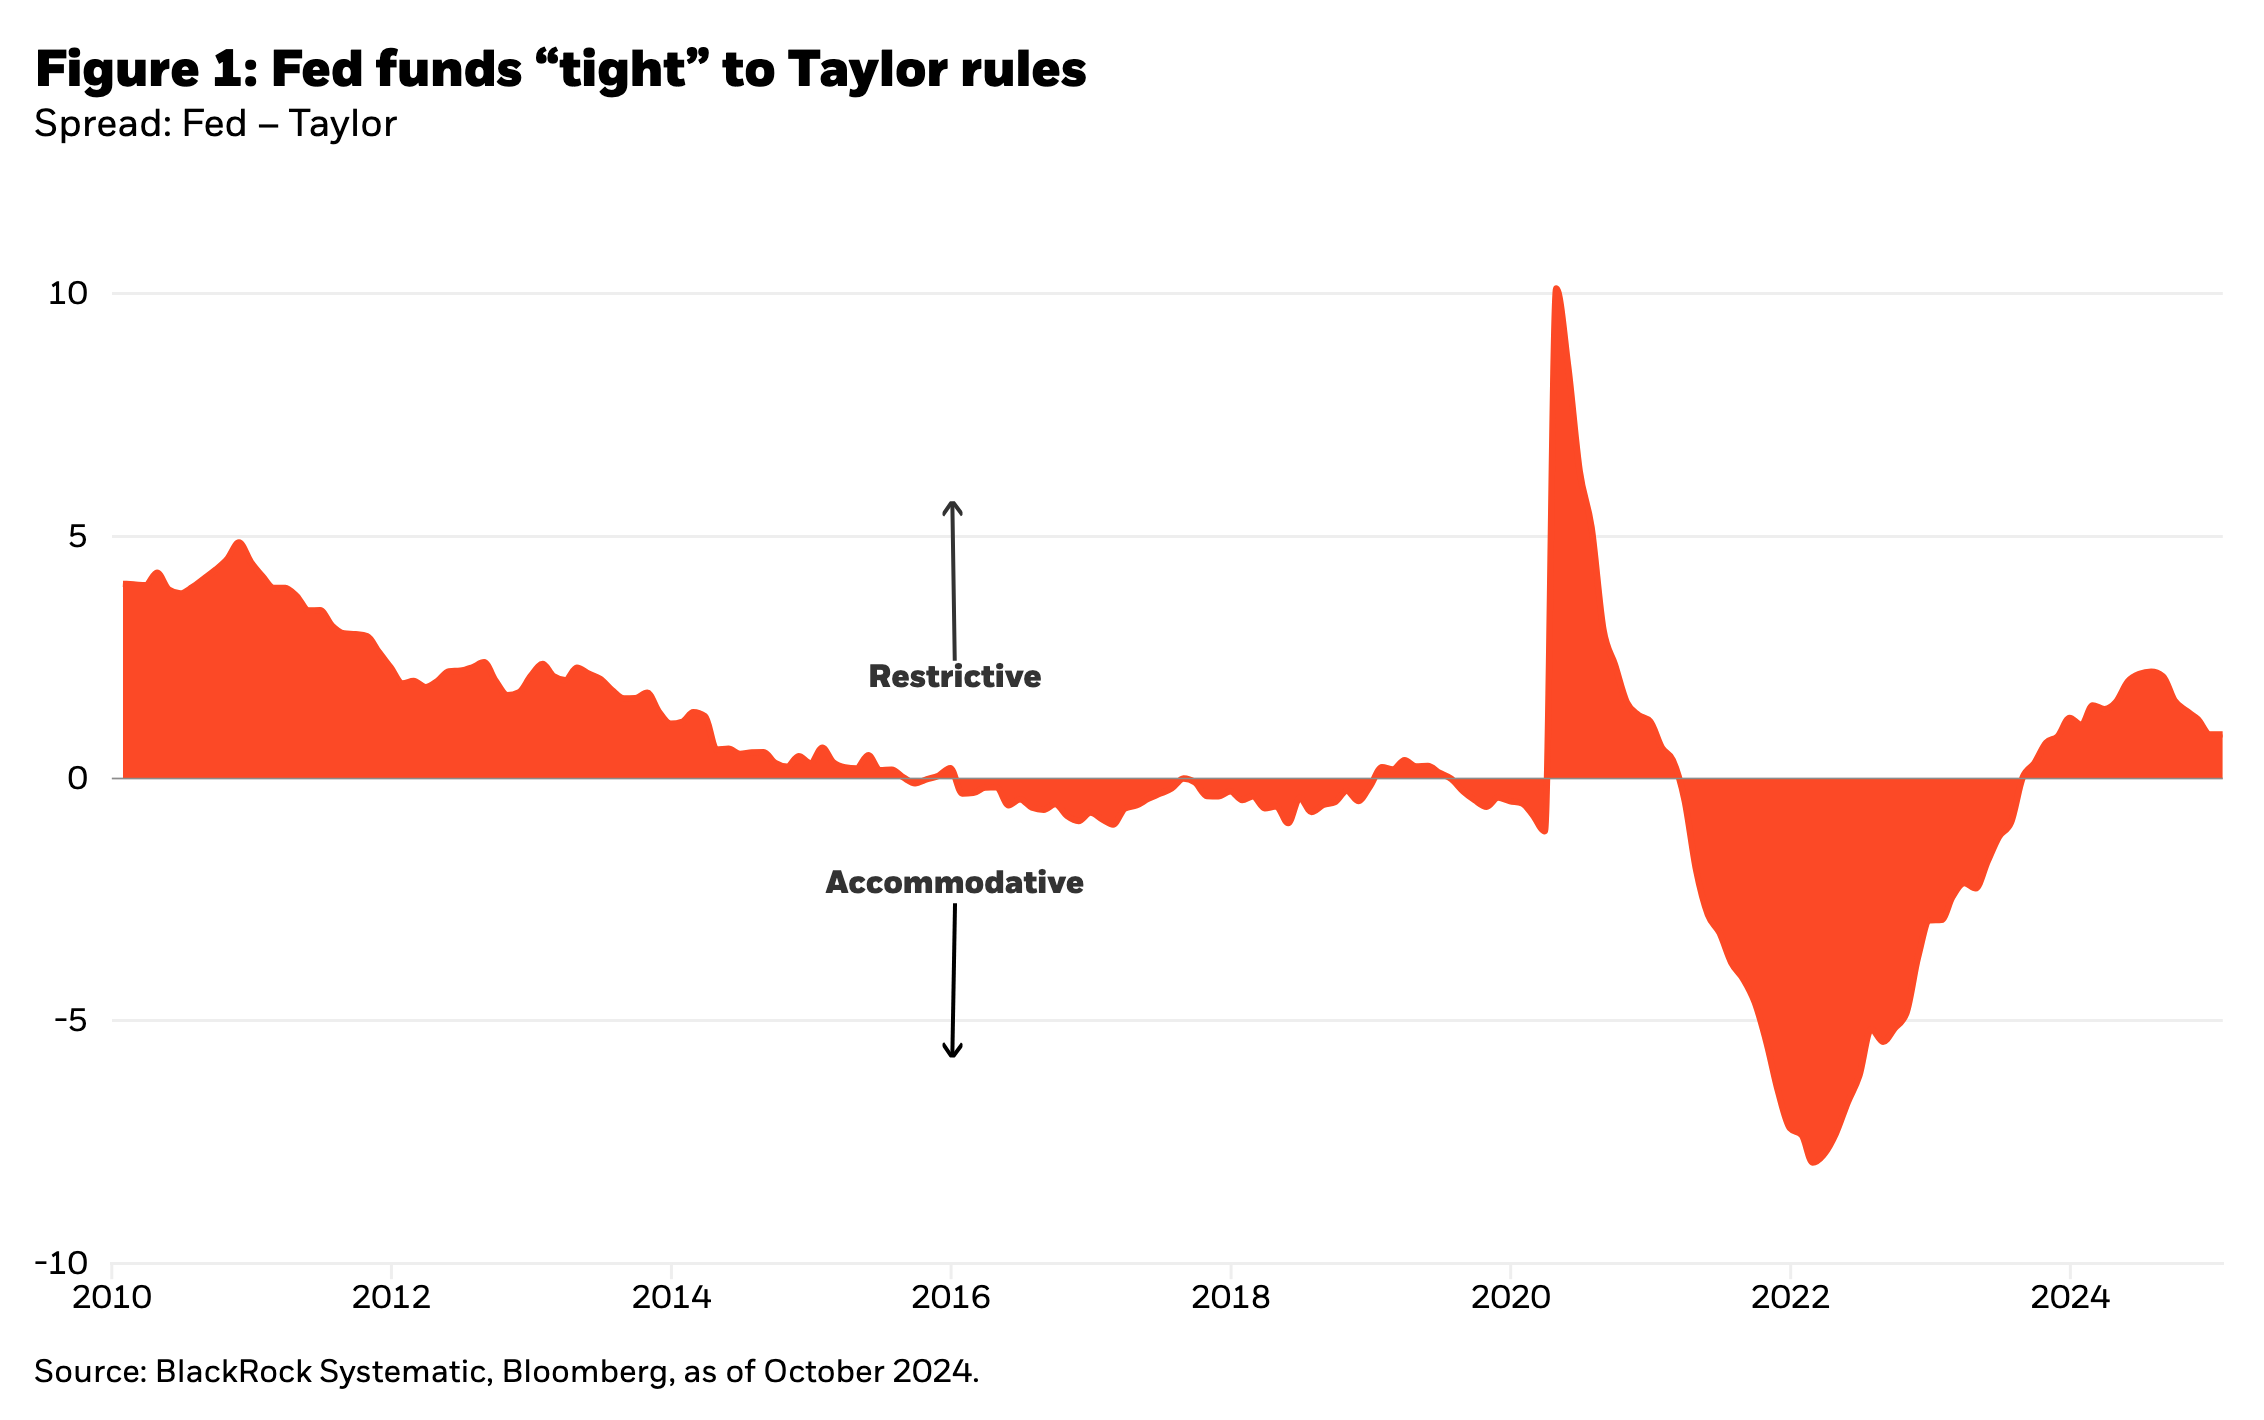
The Fed’s assessment of restrictiveness relies mainly on two observations: reference to historical comparisons of real (inflation-adjusted) policy rates and labor market tightness. The current Fed funds rate of 4.5% stands well above most estimates from well-known “Taylor rules” for monetary policy putting policy rates around 100 bps lower. Despite the tightening of the labor market from very strong conditions, the overall economy’s resilience measured by Gross Domestic Product (“GDP”) growth, a recent stabilization in the unemployment rate, and the halting pace of normalization in hourly earnings growth inject some uncertainty into that assessment.
At the same time, the Fed has mostly ignored the impact of easy financial conditions—the combination of stock, bond, and credit conditions—offsetting increases in interest rates by bolstering wealth and confidence. These dynamics have helped fuel consumption and growth. Stock market performance has been disproportionately influenced by the incredible wealth, cash flows, and valuation impact of surging investments in artificial intelligence (“AI”). The resulting impact on macro conditions is potentially underestimated by the Fed’s focus on real policy rates as determinant of policy restrictiveness.
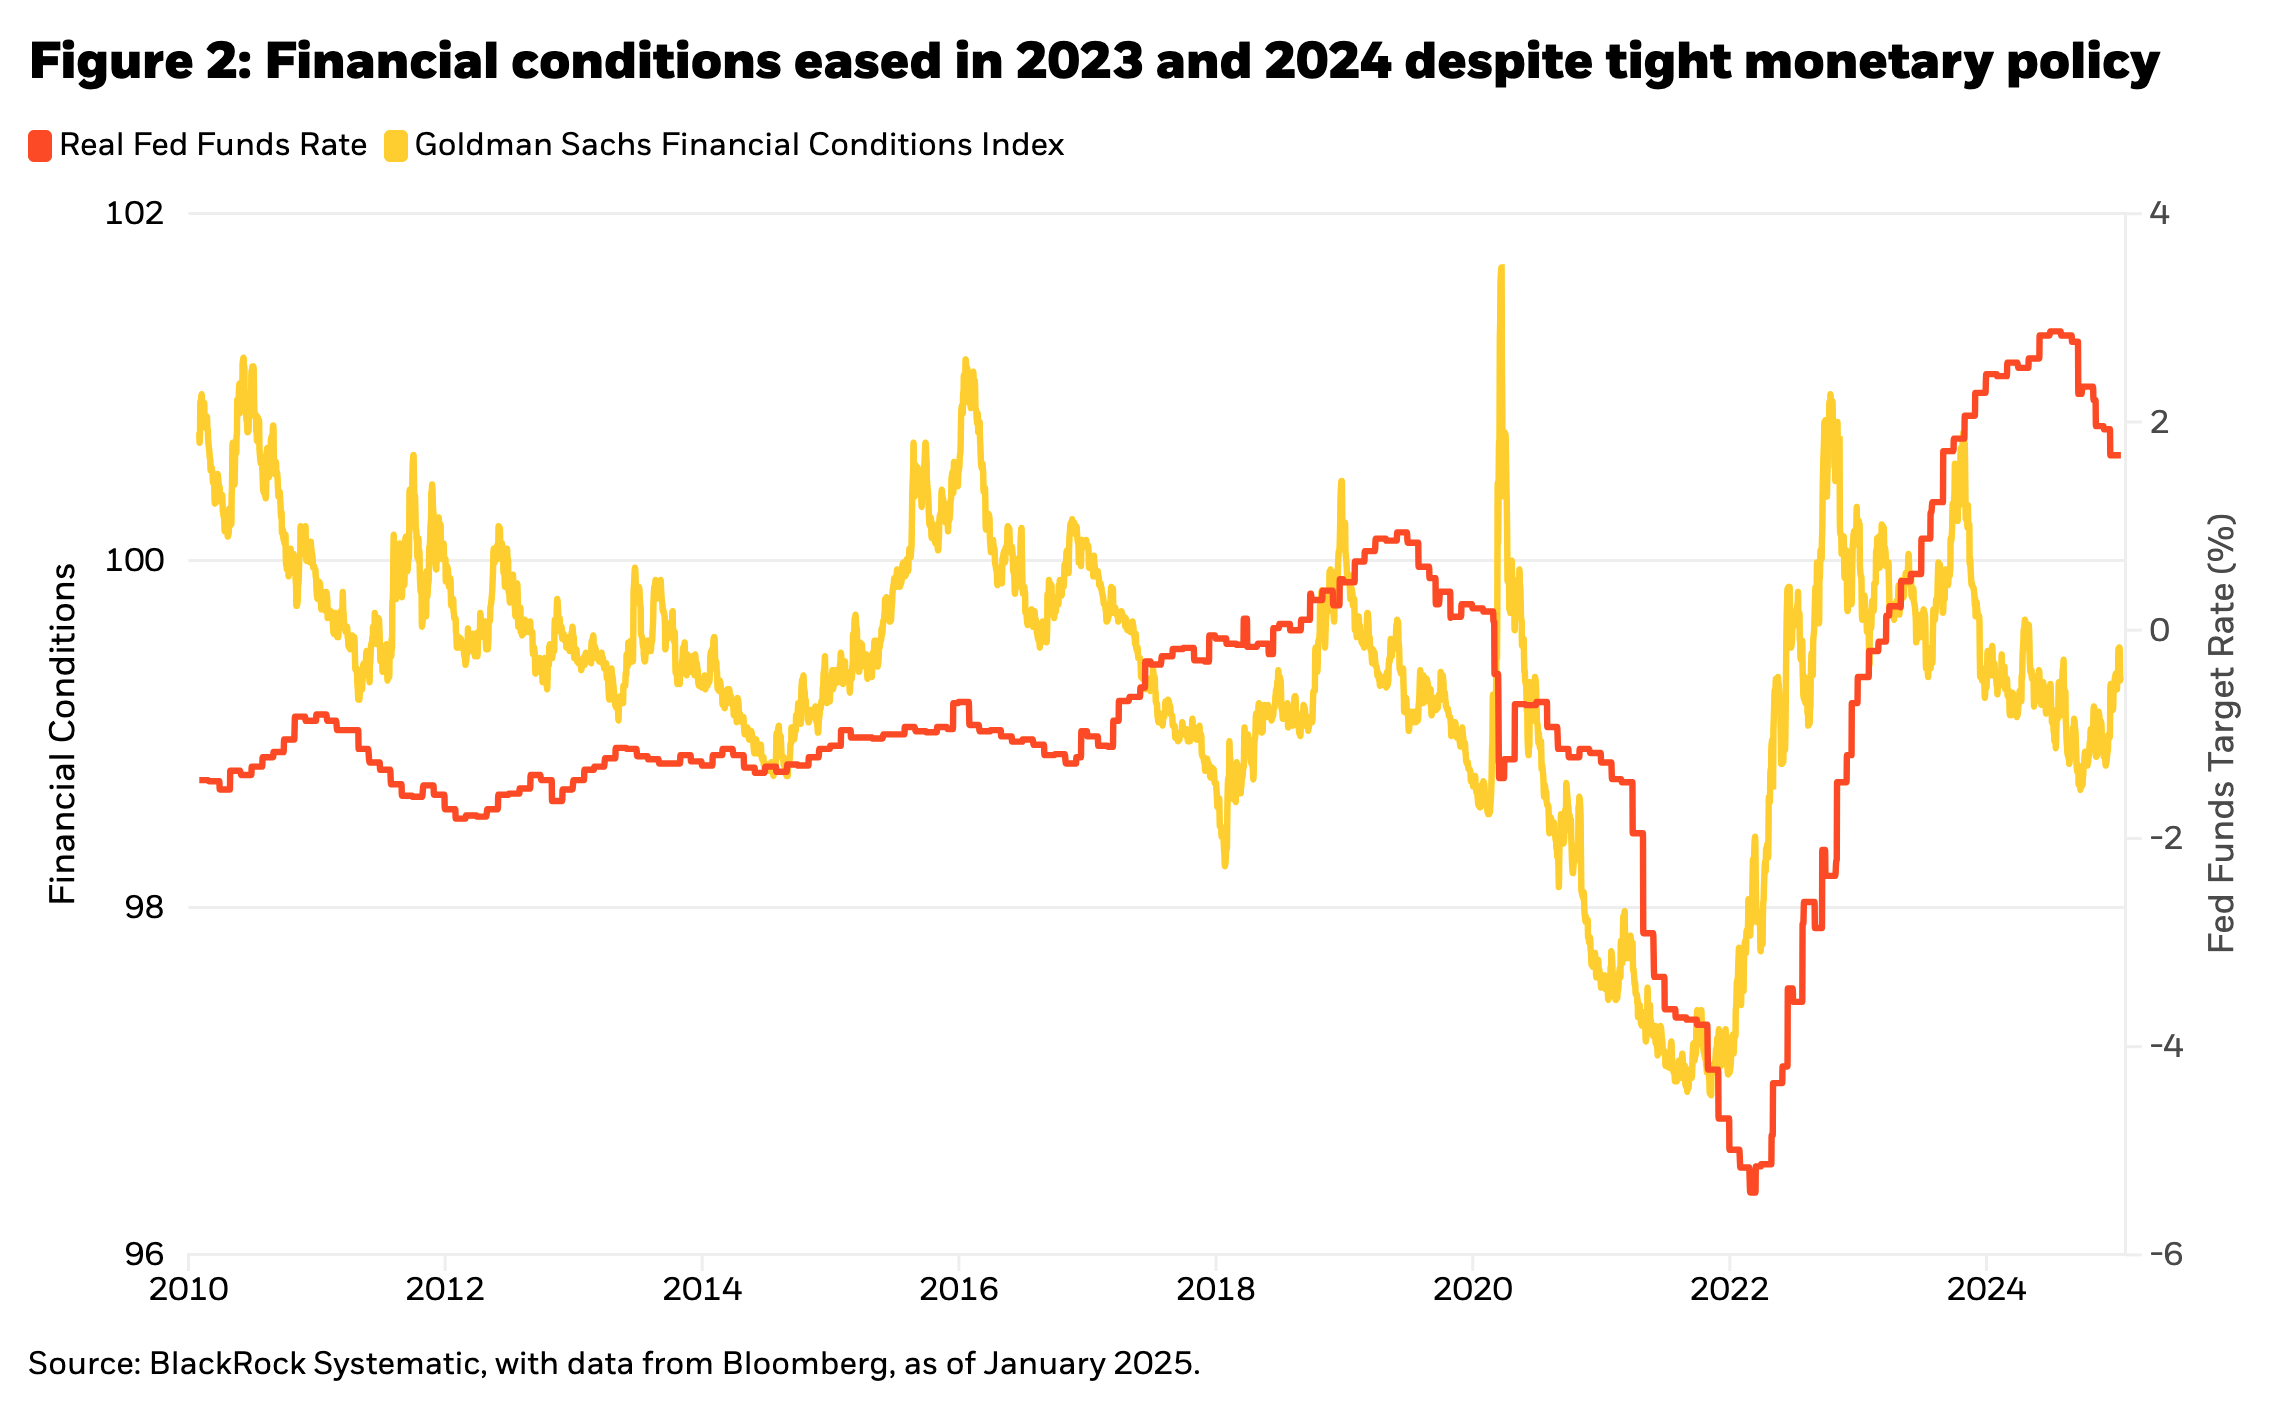
In a more typical cycle, the transmission of higher rates would tighten policy in the real economy through interest rate sensitive sectors like housing and borrowing. But today, the effects of higher rates have been offset by wealth effects boosting consumer confidence and consumption along with the return of positive real wage growth. This has rendered effective monetary policy less tight, requiring less normalization than in past cycles. The Fed’s move to pause interest rate cuts at the end of 2024 appears to recognize these facts.
Policy uncertainty trumps macro uncertainty
With financial conditions easing on the back of strong equity and credit markets, and rising wealth and real wages supporting consumption, fears over a recession induced by monetary policy tightening have given way to government policy uncertainty as the dominant macro theme for 2025. Among various policy initiatives, the outlook for trade and immigration (the potential negative surprises) and taxes and deregulation (the potential positive surprises) are the most significant areas of investor focus.
The immediate post-election market reaction reflected a greater impact from the potential positive effects of tax and deregulation policies. Equity baskets capturing anticipated relative winners and losers in Figure 3 also strongly priced in the effects of the Trump administration leading up to and immediately following the election decision.
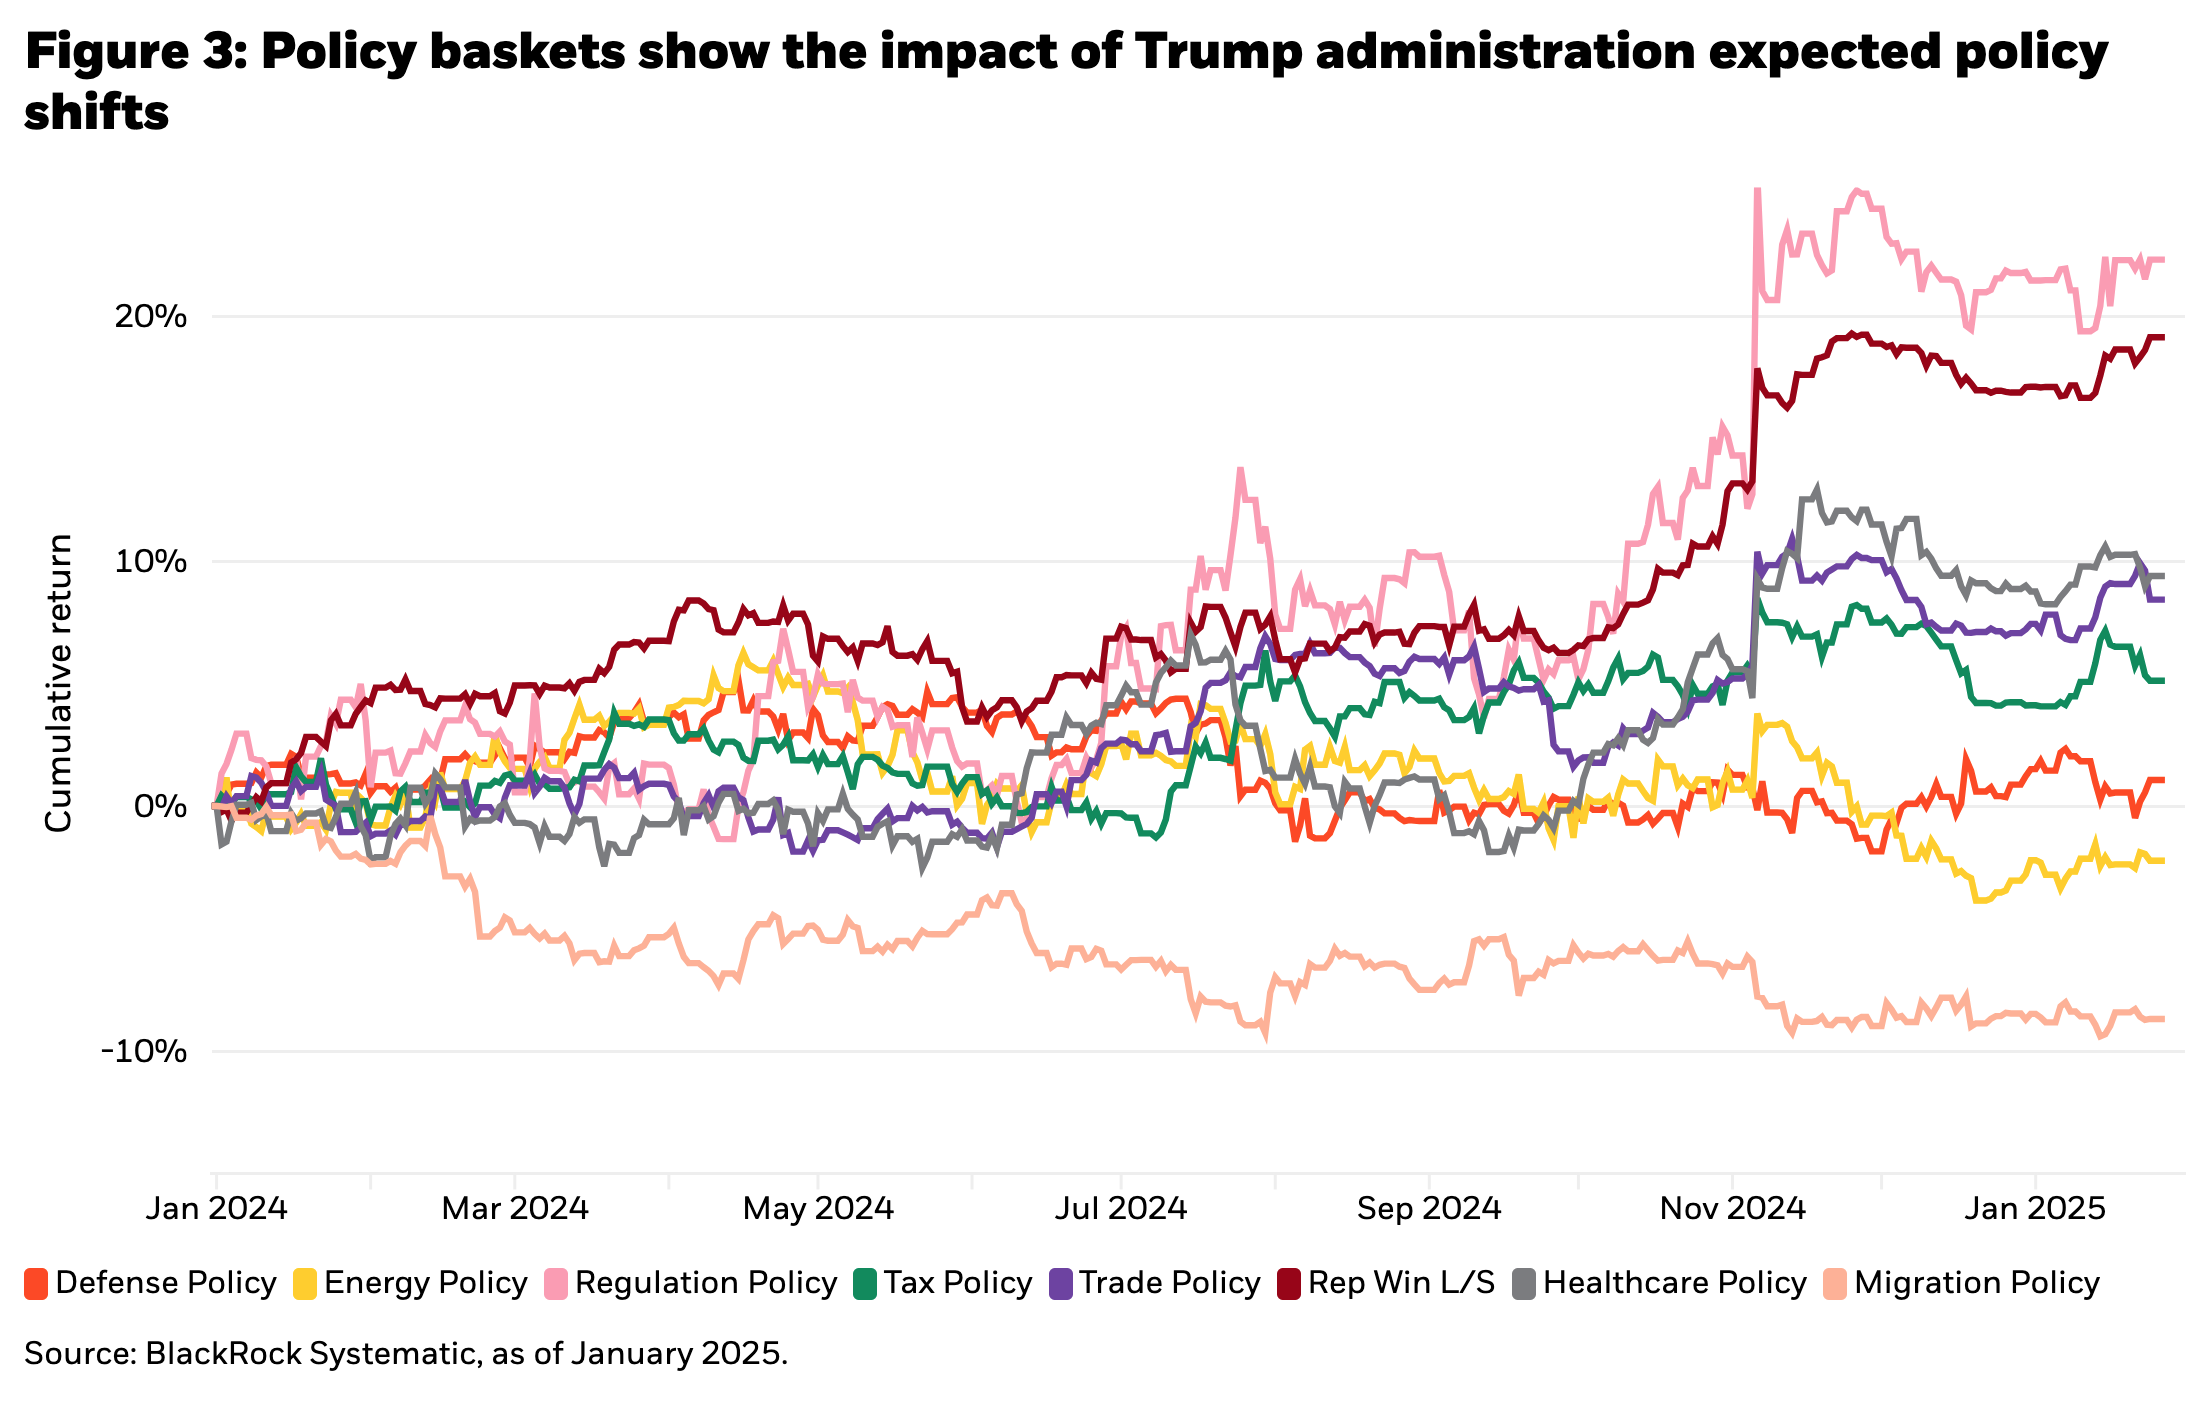
However, more recent performance of these policy baskets has been mixed to negative, suggesting increased caution in the outlook surrounding the balance of market positive versus negative policy outcomes.
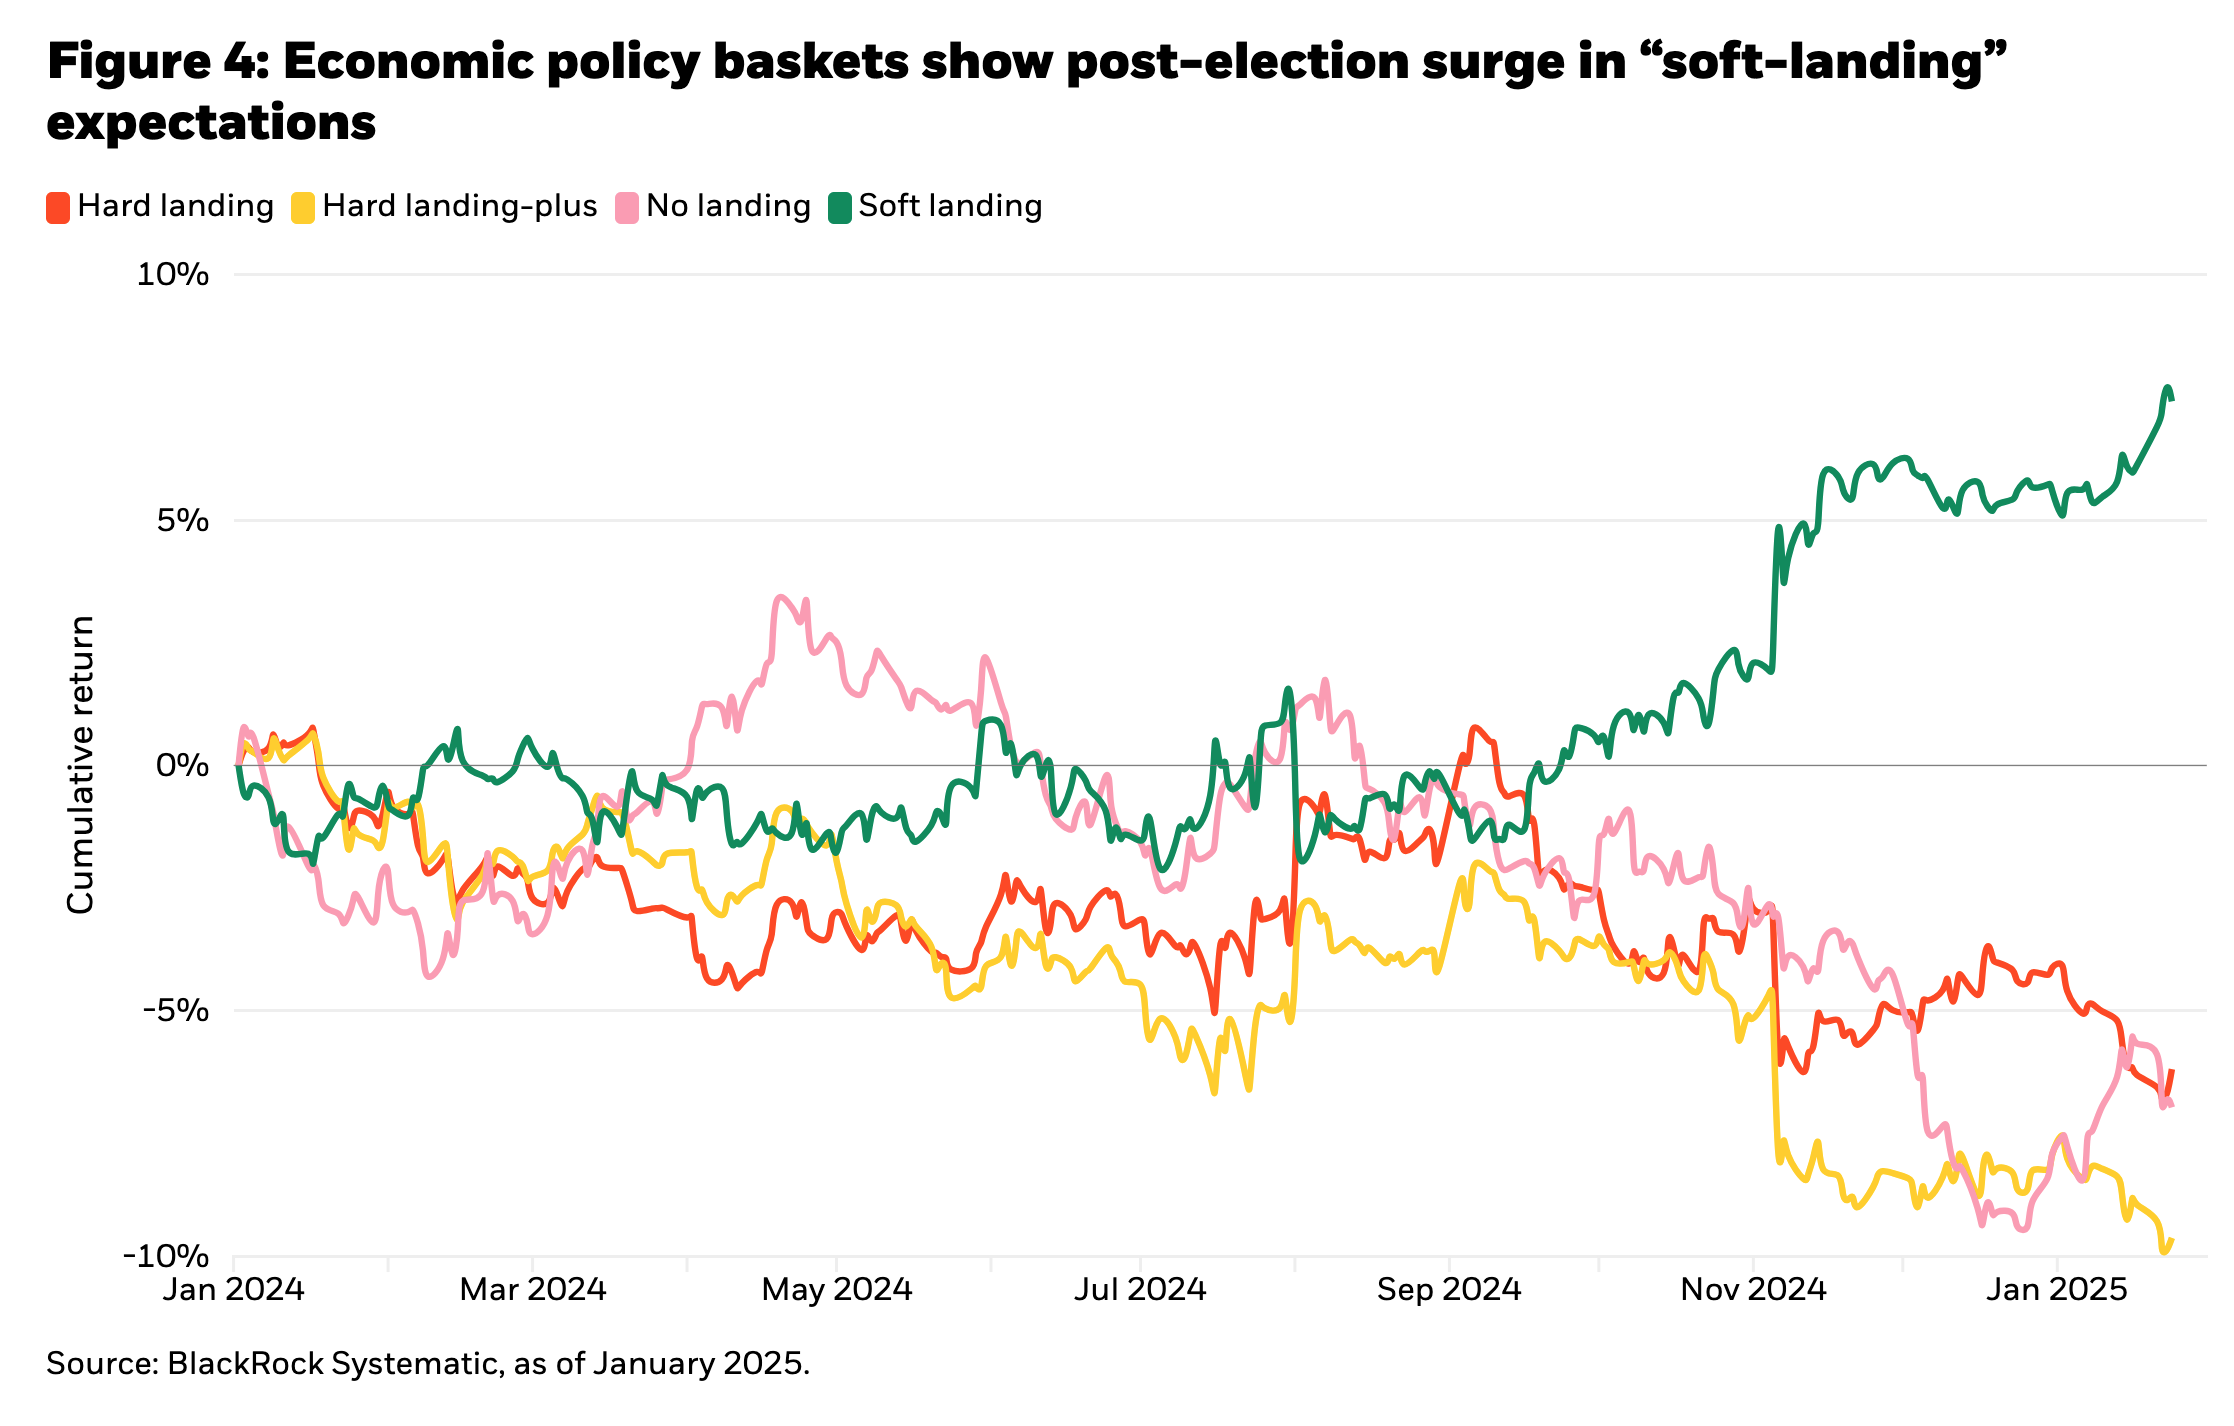
Another observation from our policy basket sentiment indicators highlights the post-election shift towards soft-landing economic scenarios and away from the earlier concerns pricing a hard-landing or “no-landing” characterized by sustained high inflation and growth. These basket returns in Figure 4 highlight the shift in the post-election consensus narrative away from economic risk and towards policy risk.
Navigating the (new) conundrum
2024 marked yet another year of hoping bonds would be back, only to be disappointed by another subpar (and in this case sub-cash) return year. We instead saw our prediction of a “new conundrum” realized as the Fed cut interest rates by 100bps, only to see 10-year yields rise by 100bps. The name references the opposite of the of the conundrum coined by former Fed Chair Greenspan during the 2004-2005 hiking cycle when long-term rates trended lower despite higher policy rates.
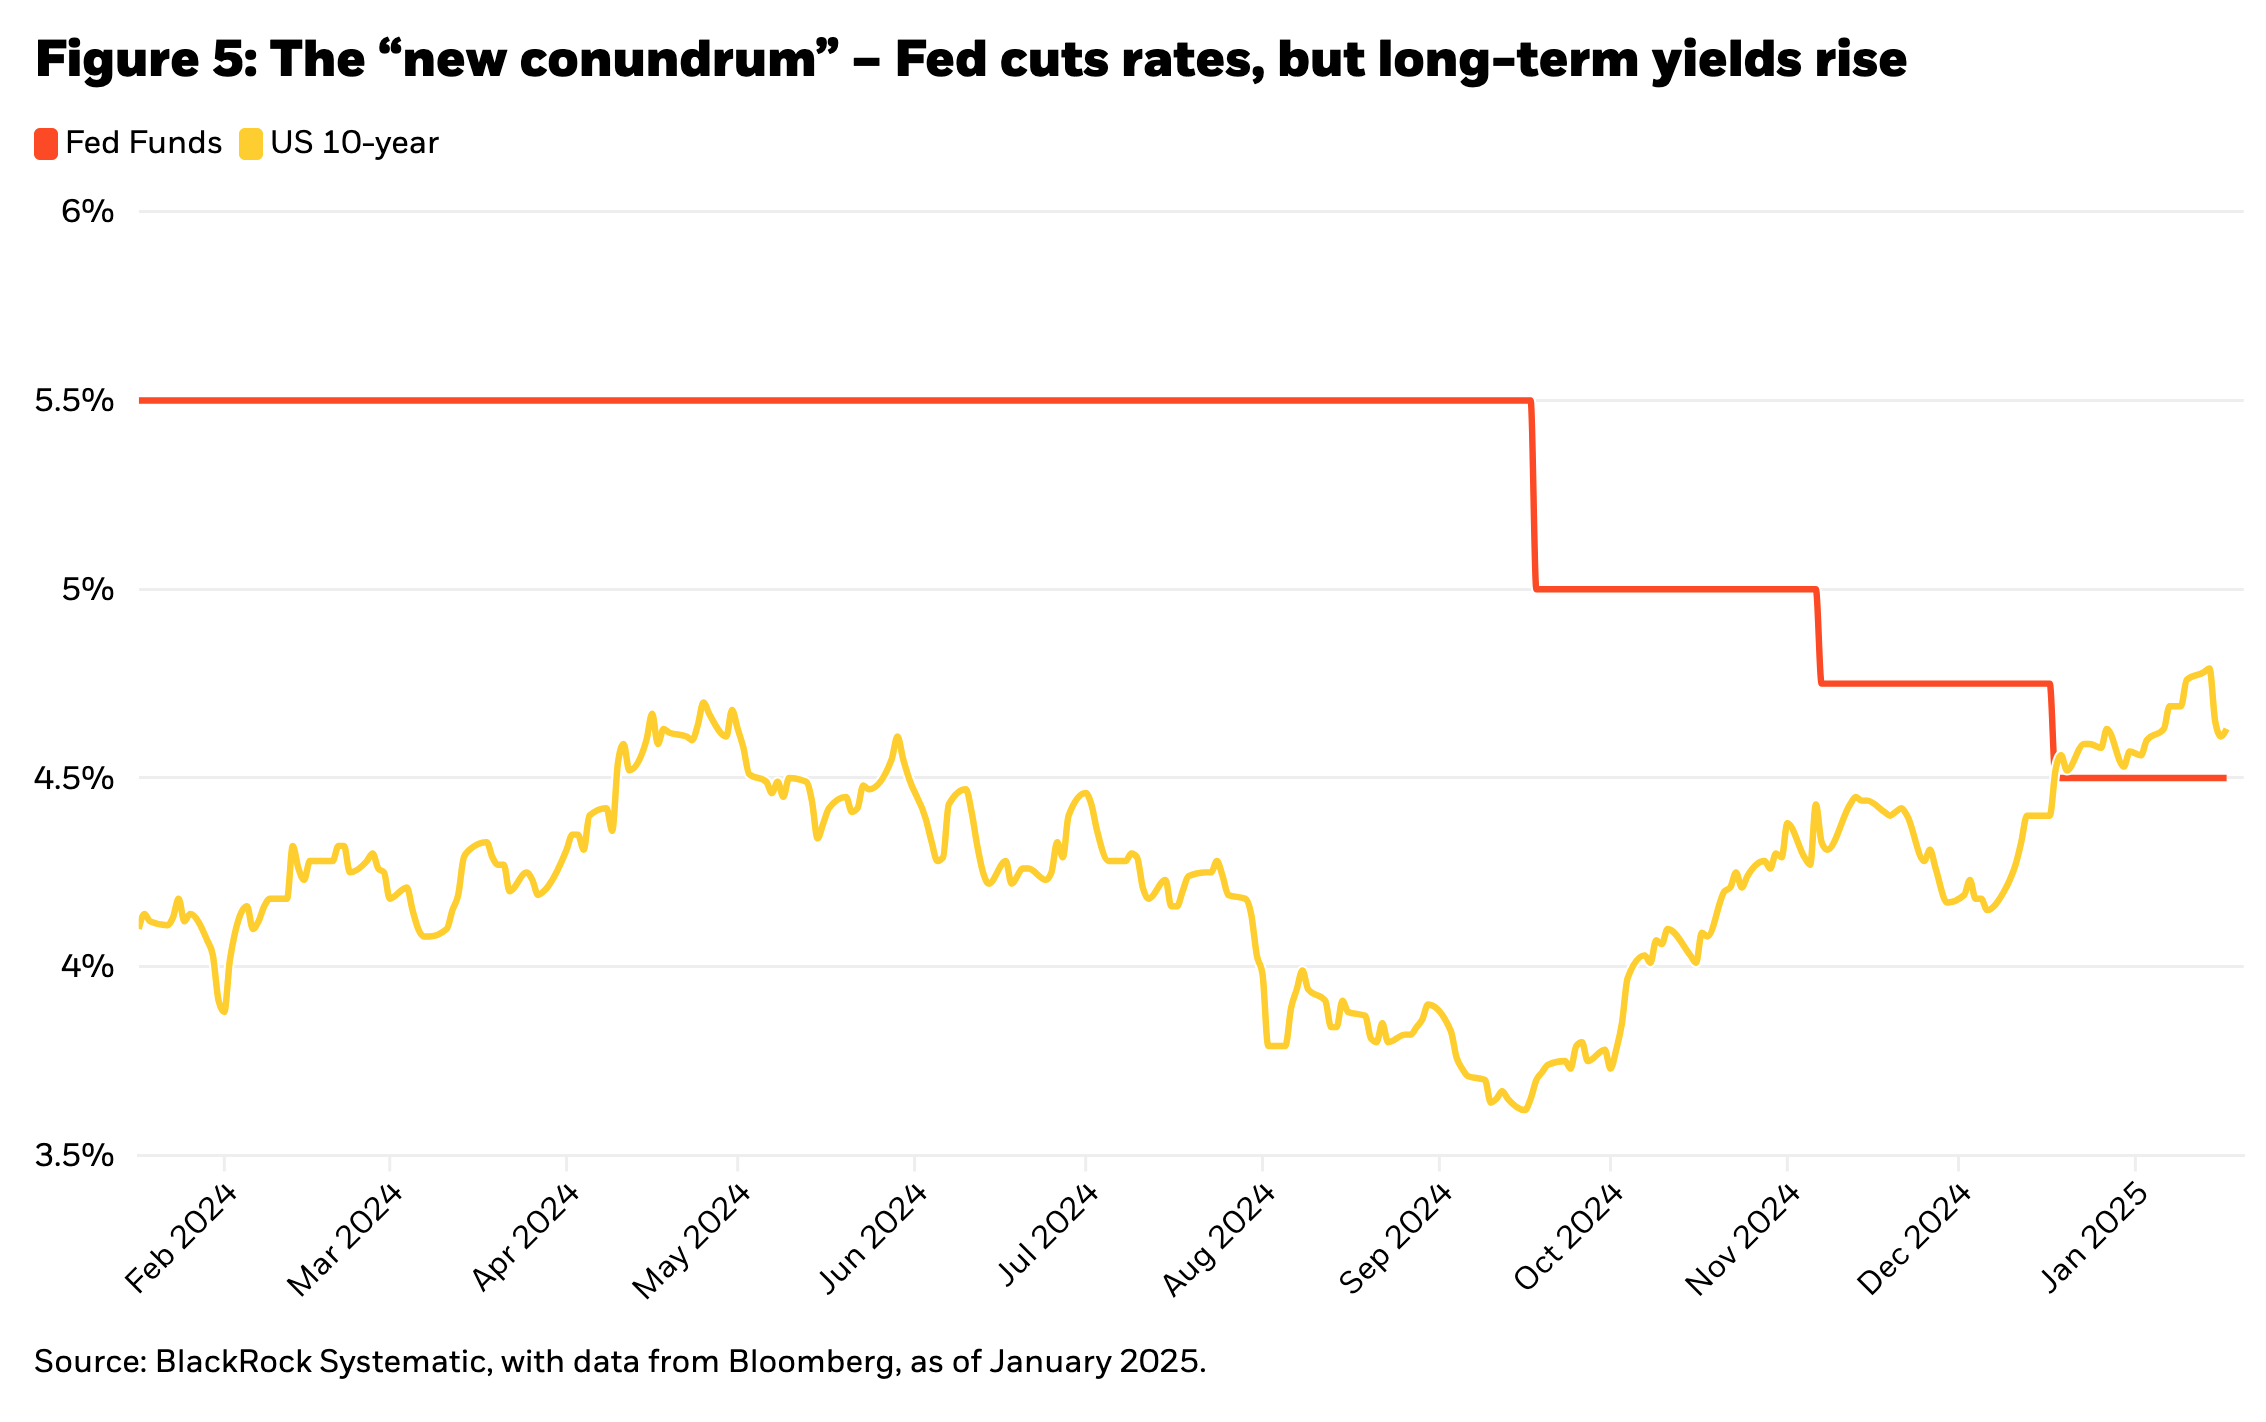
While these moves following the Fed’s initial cut partly reflected an unwind of earlier rate declines (in a “buy the rumor, sell the news” fashion), 10-year rates ended up over 50bps for the year despite the start of the cutting cycle.
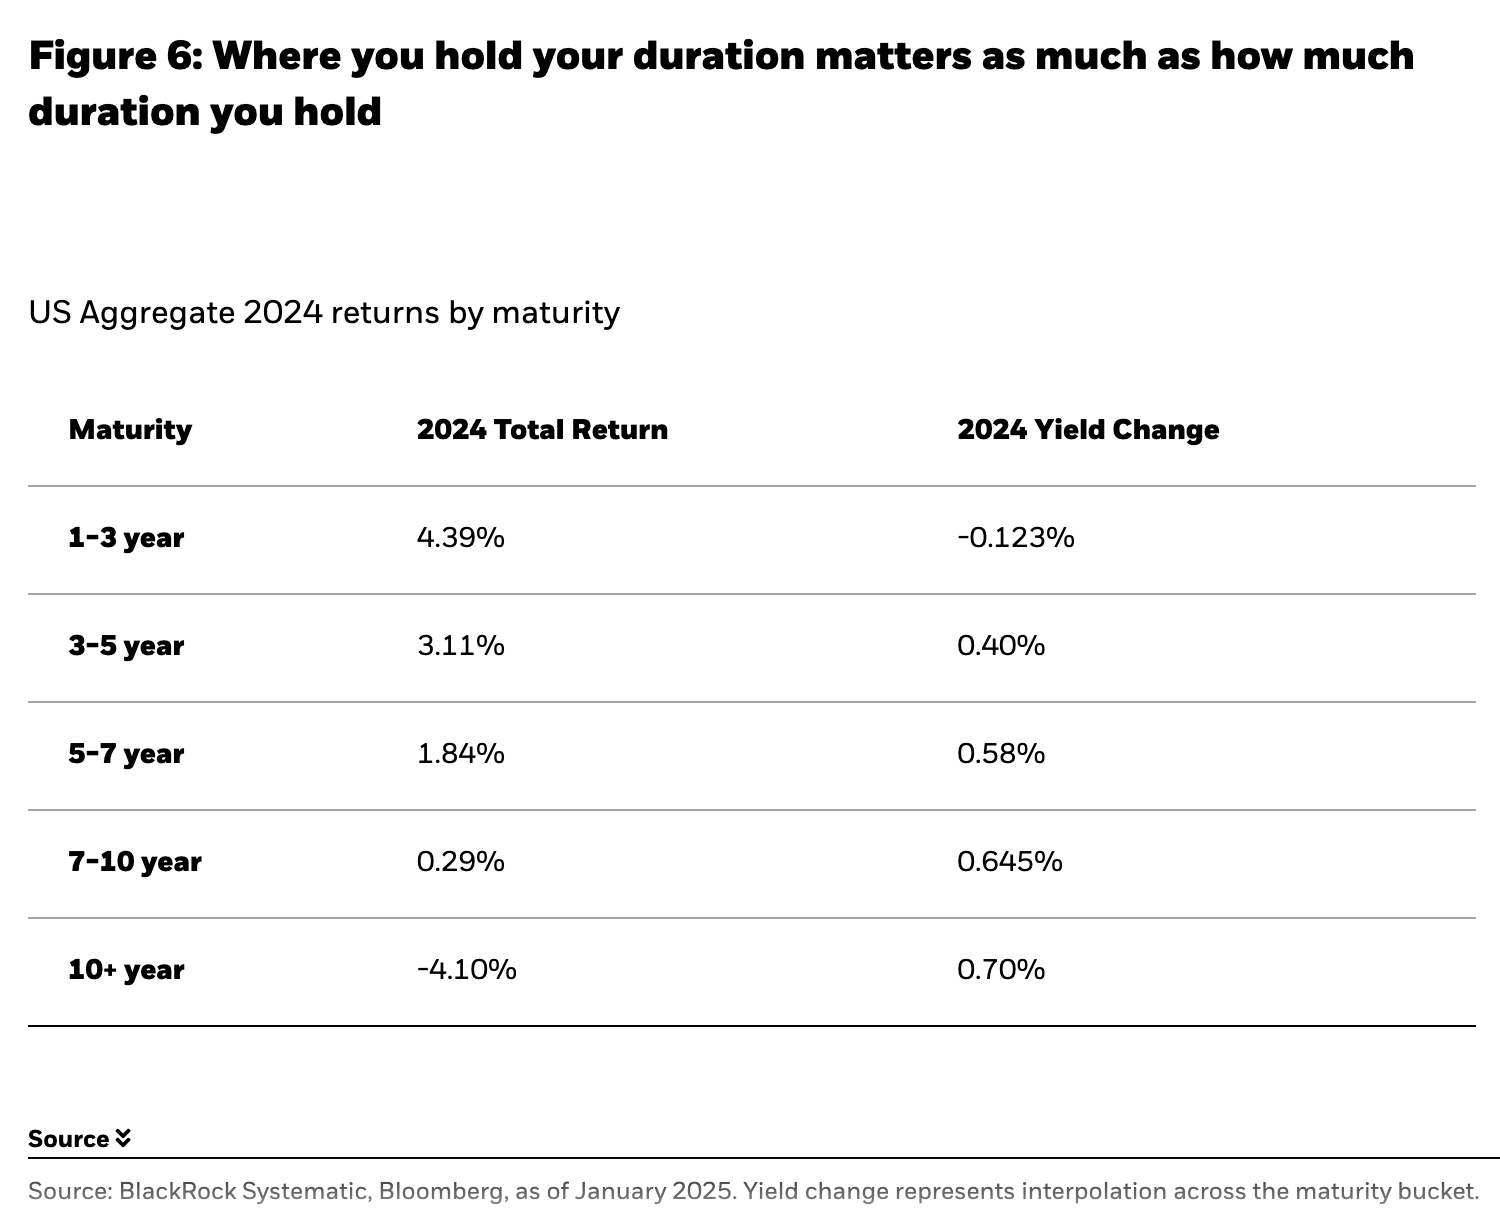
The “bonds are back” consensus view was to buy bonds when the Fed is cutting rates. Yet our “new conundrum” thesis highlighted the vulnerability in this outlook: where you hold your duration matters as much as how much duration you hold. In other words, where you hold your interest rate exposure—short, intermediate, long—mattered a lot in 2024. Considering that 2-year yields were relatively unchanged, 5-year yields were up 54bps, 10-year yields were up nearly 70bps, and 30-year yields were up 75bps, total return performance across the curve varied widely.
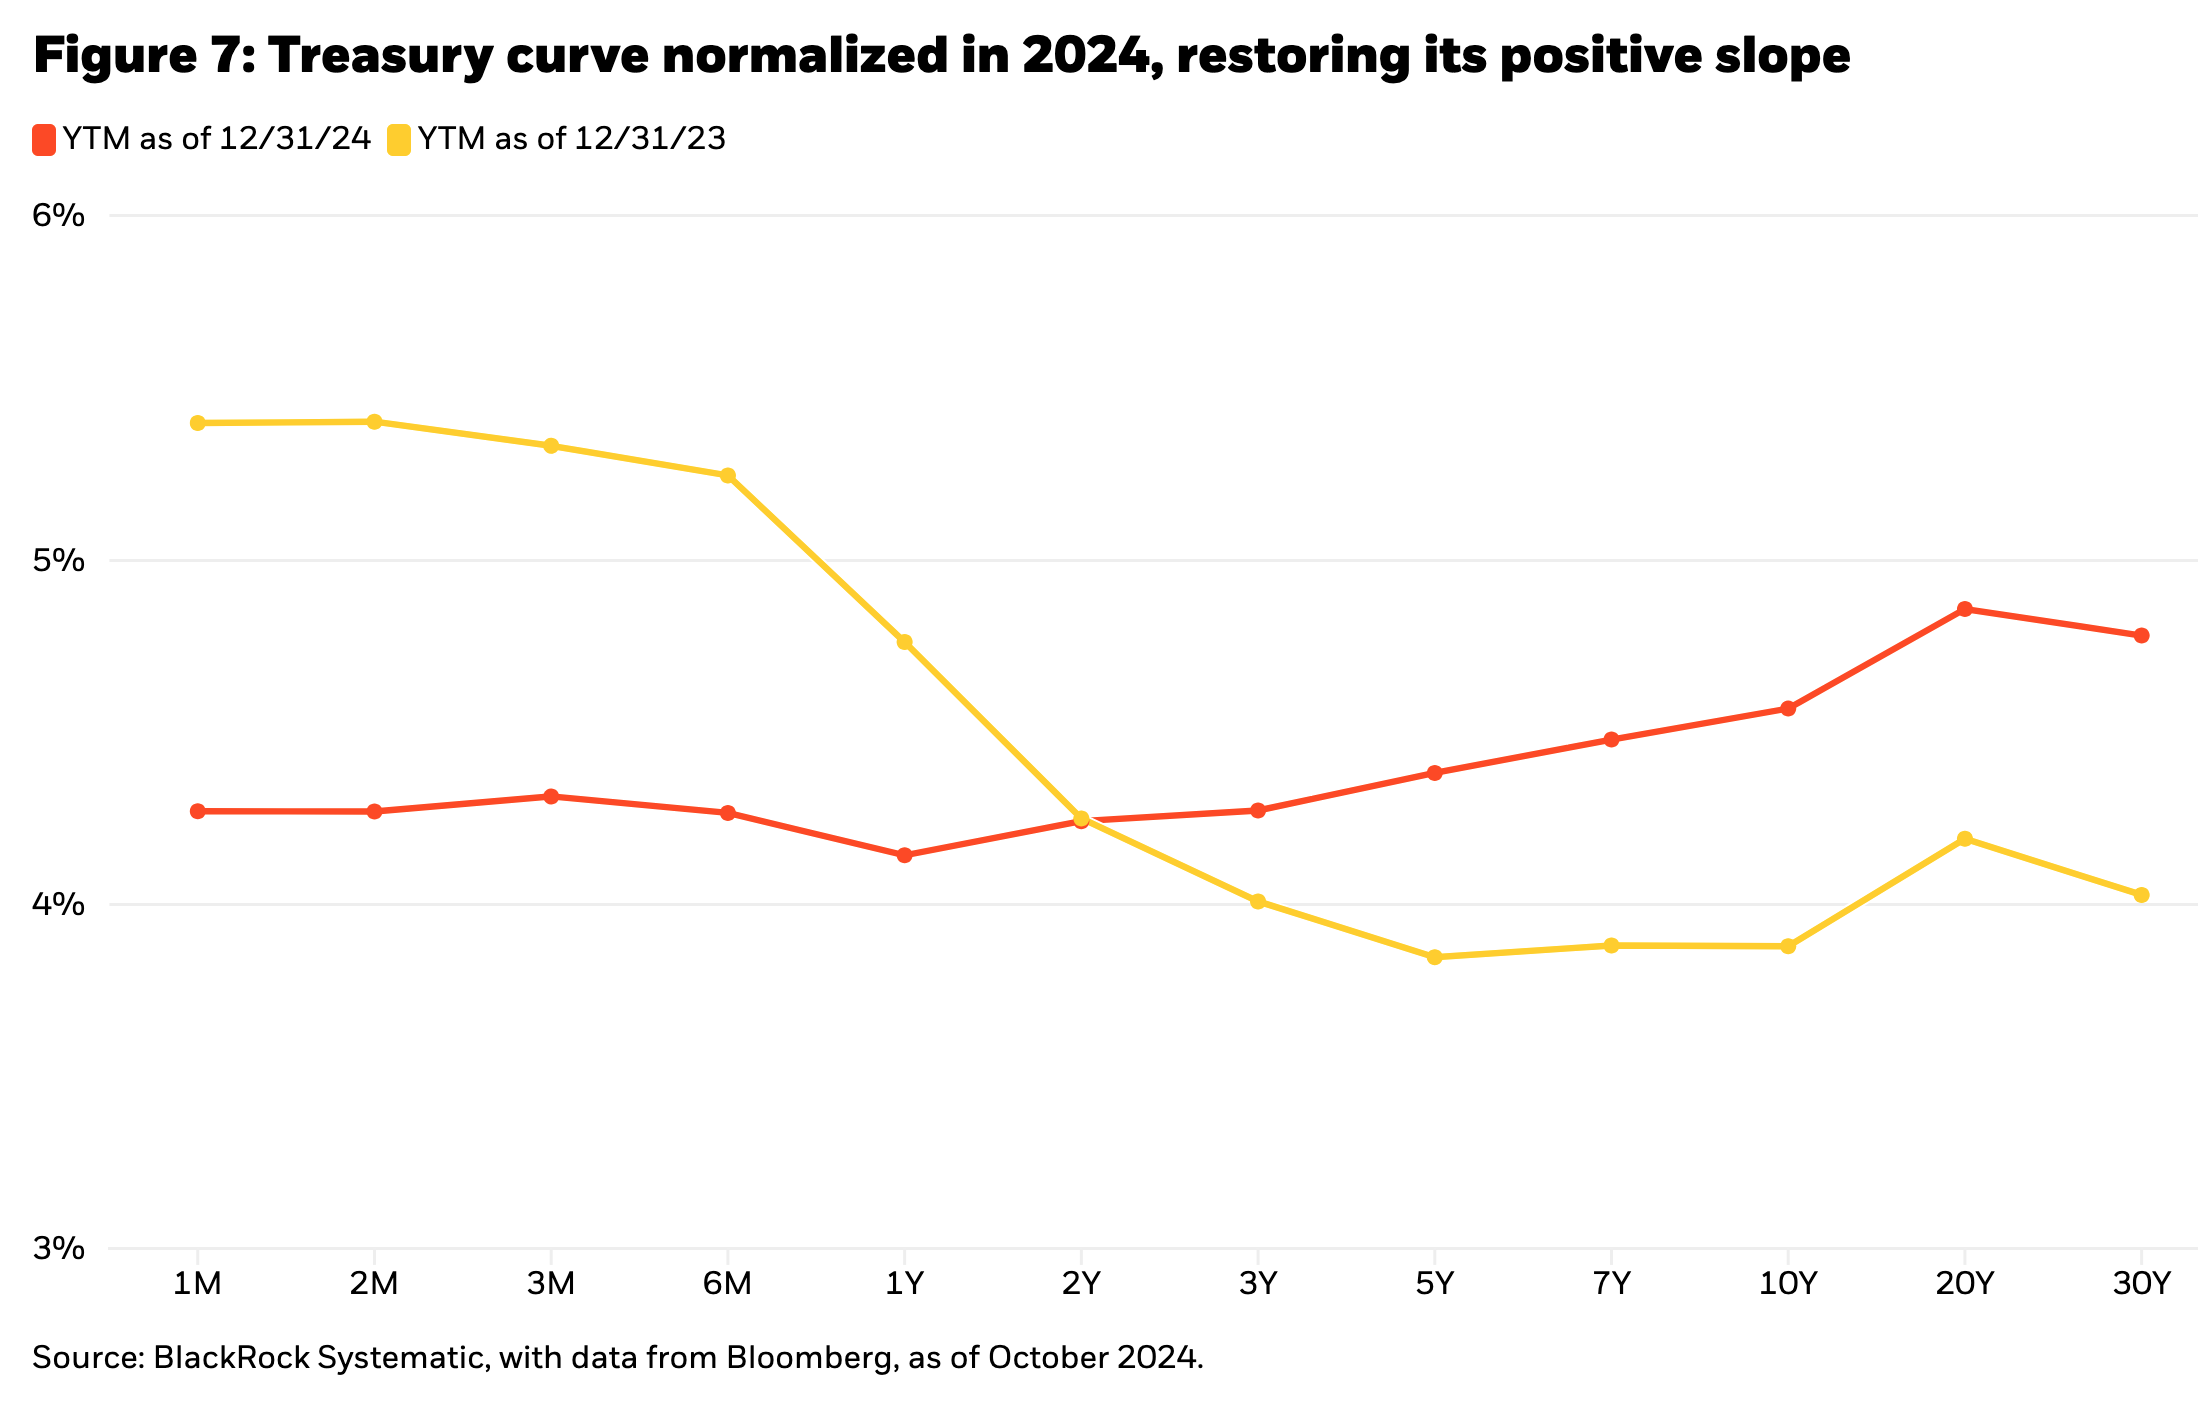
For 2025, the outlook for performance across the curve has evolved from last year as interest rate cuts normalized the curve shape from inverted to slightly upward sloping as shown in Figure 7. That has restored some value to moving out on the curve from cash, as cash yields are no longer the highest yields. It also means that duration equivalent front-end exposures are no longer as prohibitively expensive from an annual income perspective as they were when the curve was inverted. That becomes important when we turn to another key reason to hold treasuries in a portfolio besides income—which is hedge effectiveness.
Not your father’s bond market
Investors hold bonds for income, price appreciation, and ballast. Much of the excitement around “bonds are back” in 2023 stemmed from income being back, and in 2024 from price appreciation being back with anticipated interest rate cuts. The “new conundrum” frustrated that expectation for price appreciation. That leaves ballast—the expectation that bonds will go up when stocks go down—as the final reason for holding bonds in a portfolio. However, the steepening of the yield curve and prospects for more steepening in 2025 reinforces the importance of where you hold duration along the curve.
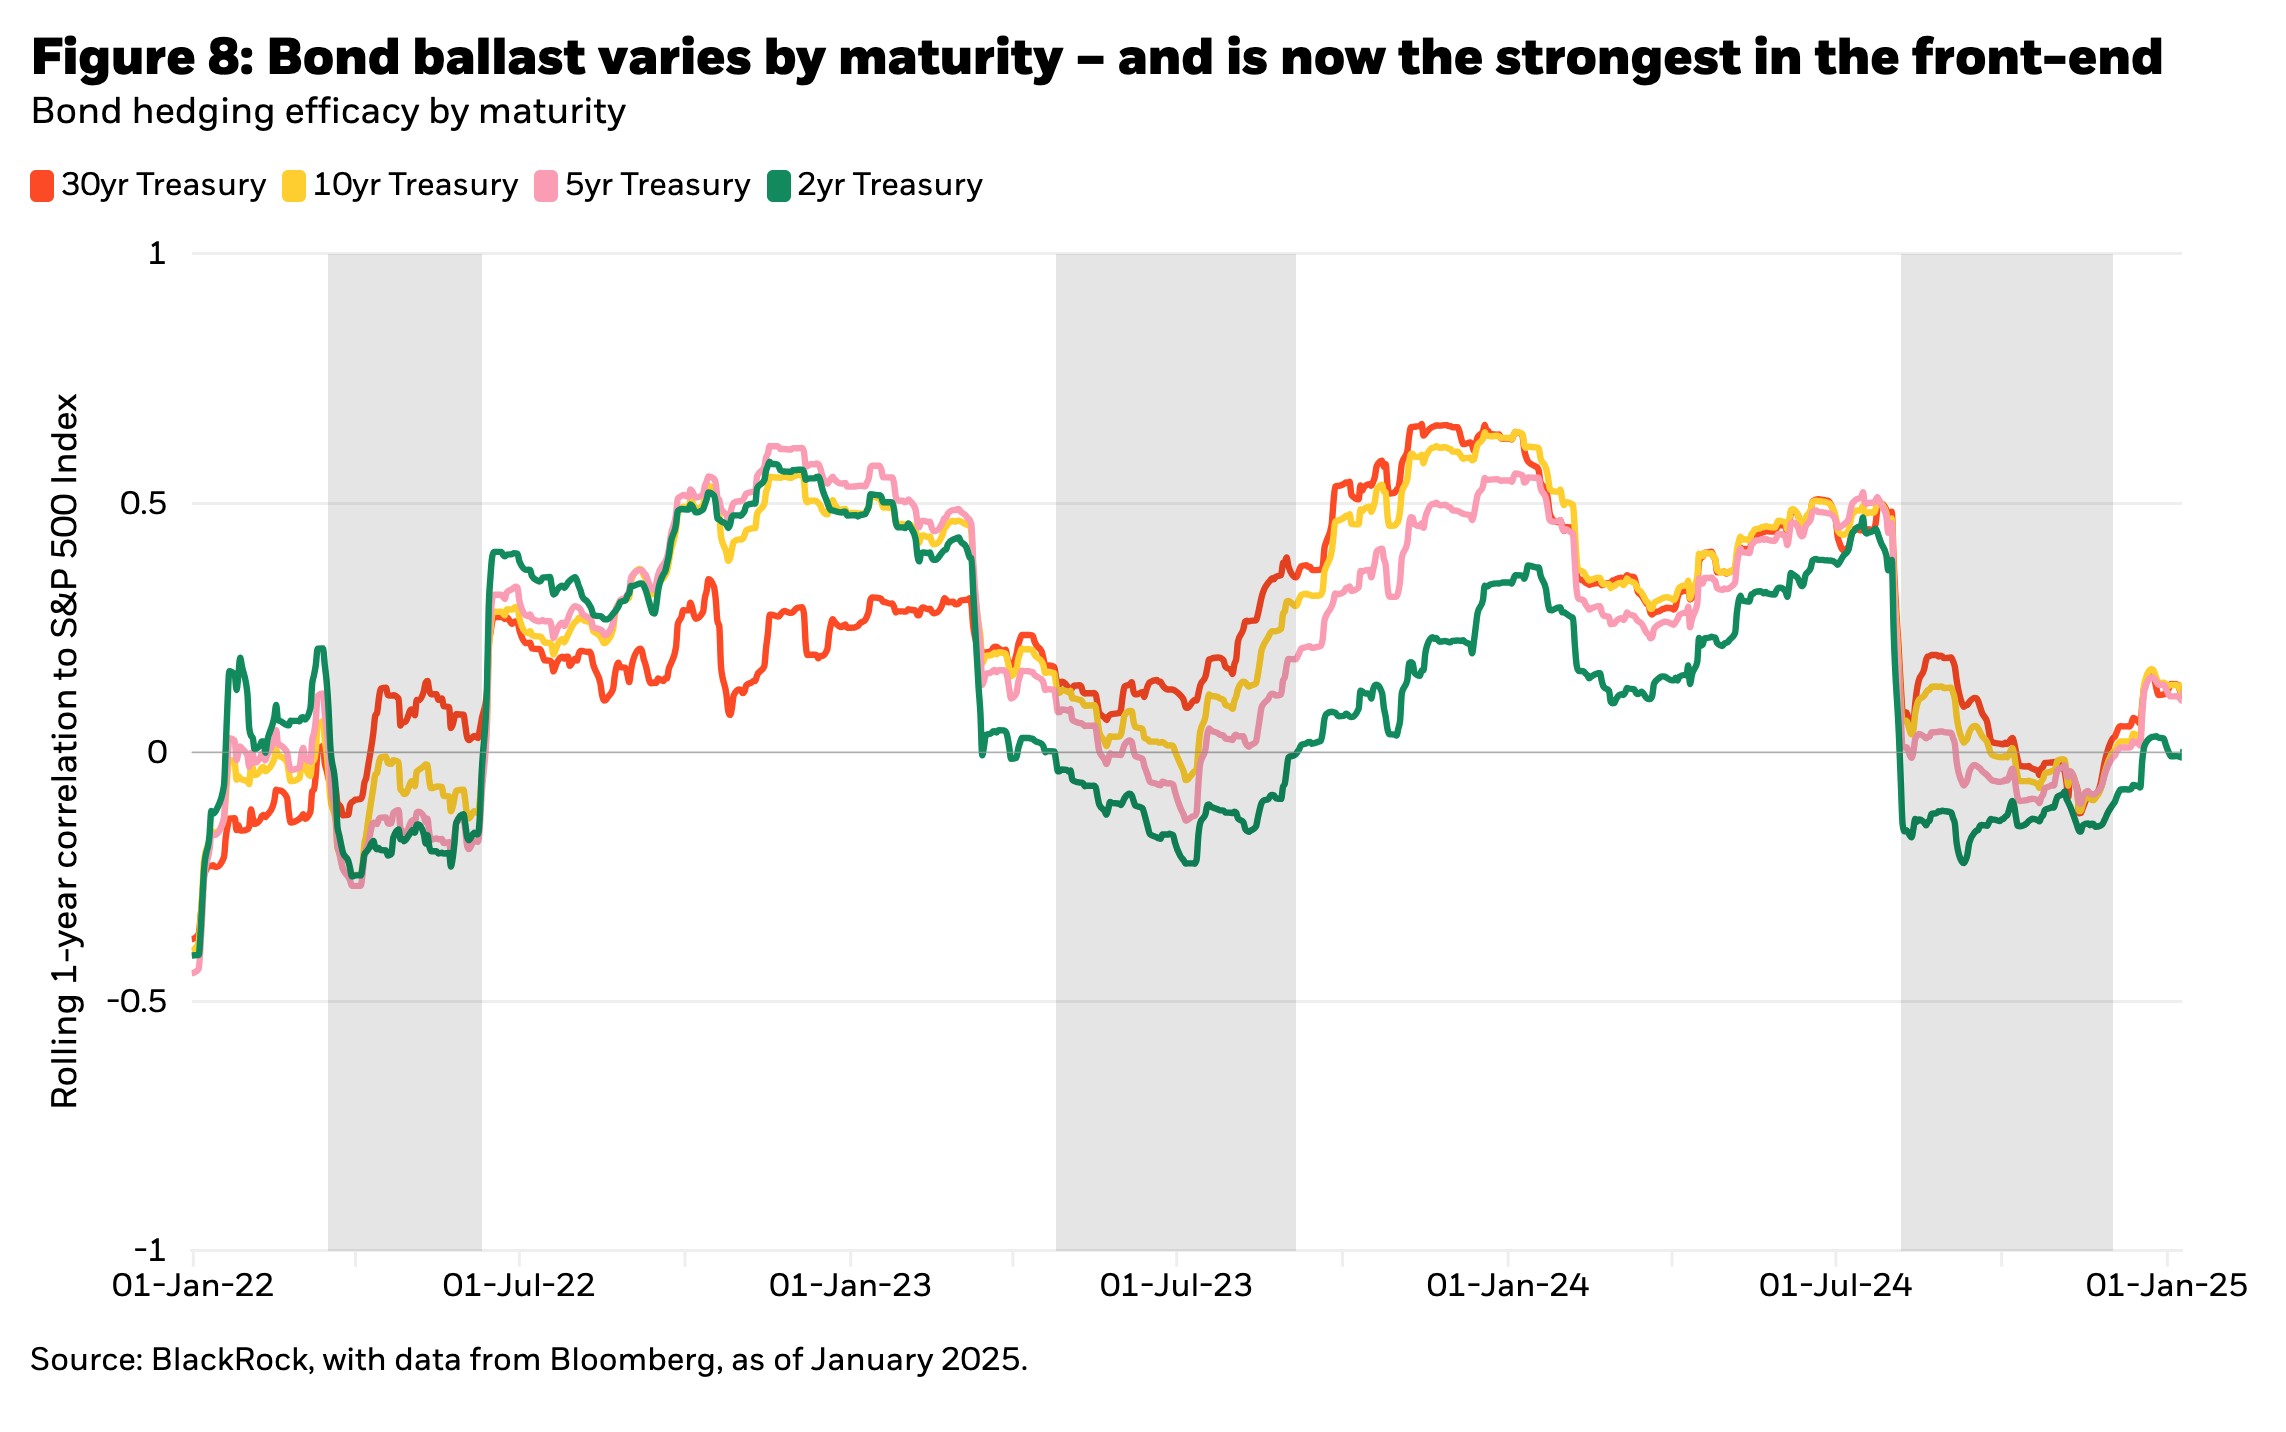
Consider the performance of ballast by bond maturity in Figure 8. We measure the degree of ballast by looking at the stock-bond correlation (“SBC”) at different maturity points along the curve. The more negative the SBC, the more we can expect bonds to respond positively to negative “risk-off” shocks.
Figure 8 highlights that the strongest response in terms of inverse movements in yield relative to stock returns has been at the short-end of the yield curve. This follows the more recent elevated level of Fed policy rates implying a substantial amount of room for short-term yields to decline, coupled with a shift in Fed policy away from the use of the balance sheet for accommodation that was so prevalent during the post-Great Financial Crisis (“GFC”) period. Today, “flight to quality” is led by short rather than the long maturities as was the case during the zero interest-rate policy and quantitative easing period following most of the GFC. An upwardly sloped curve for 2025 additionally means less punitive hedging costs when making a transition away from a long maturity exposure into a short maturity exposure on a duration equivalent basis.
Term premia steepening additionally drove underperformance of longer maturities in 2024. That term premia increase reflects a normalization from post-GFC low levels driven by the proximity to the zero lower bound, the inability of central banks globally to achieve their inflation targets (too little inflation), and an increase in inflation volatility post-COVID increasing inflation term premia.
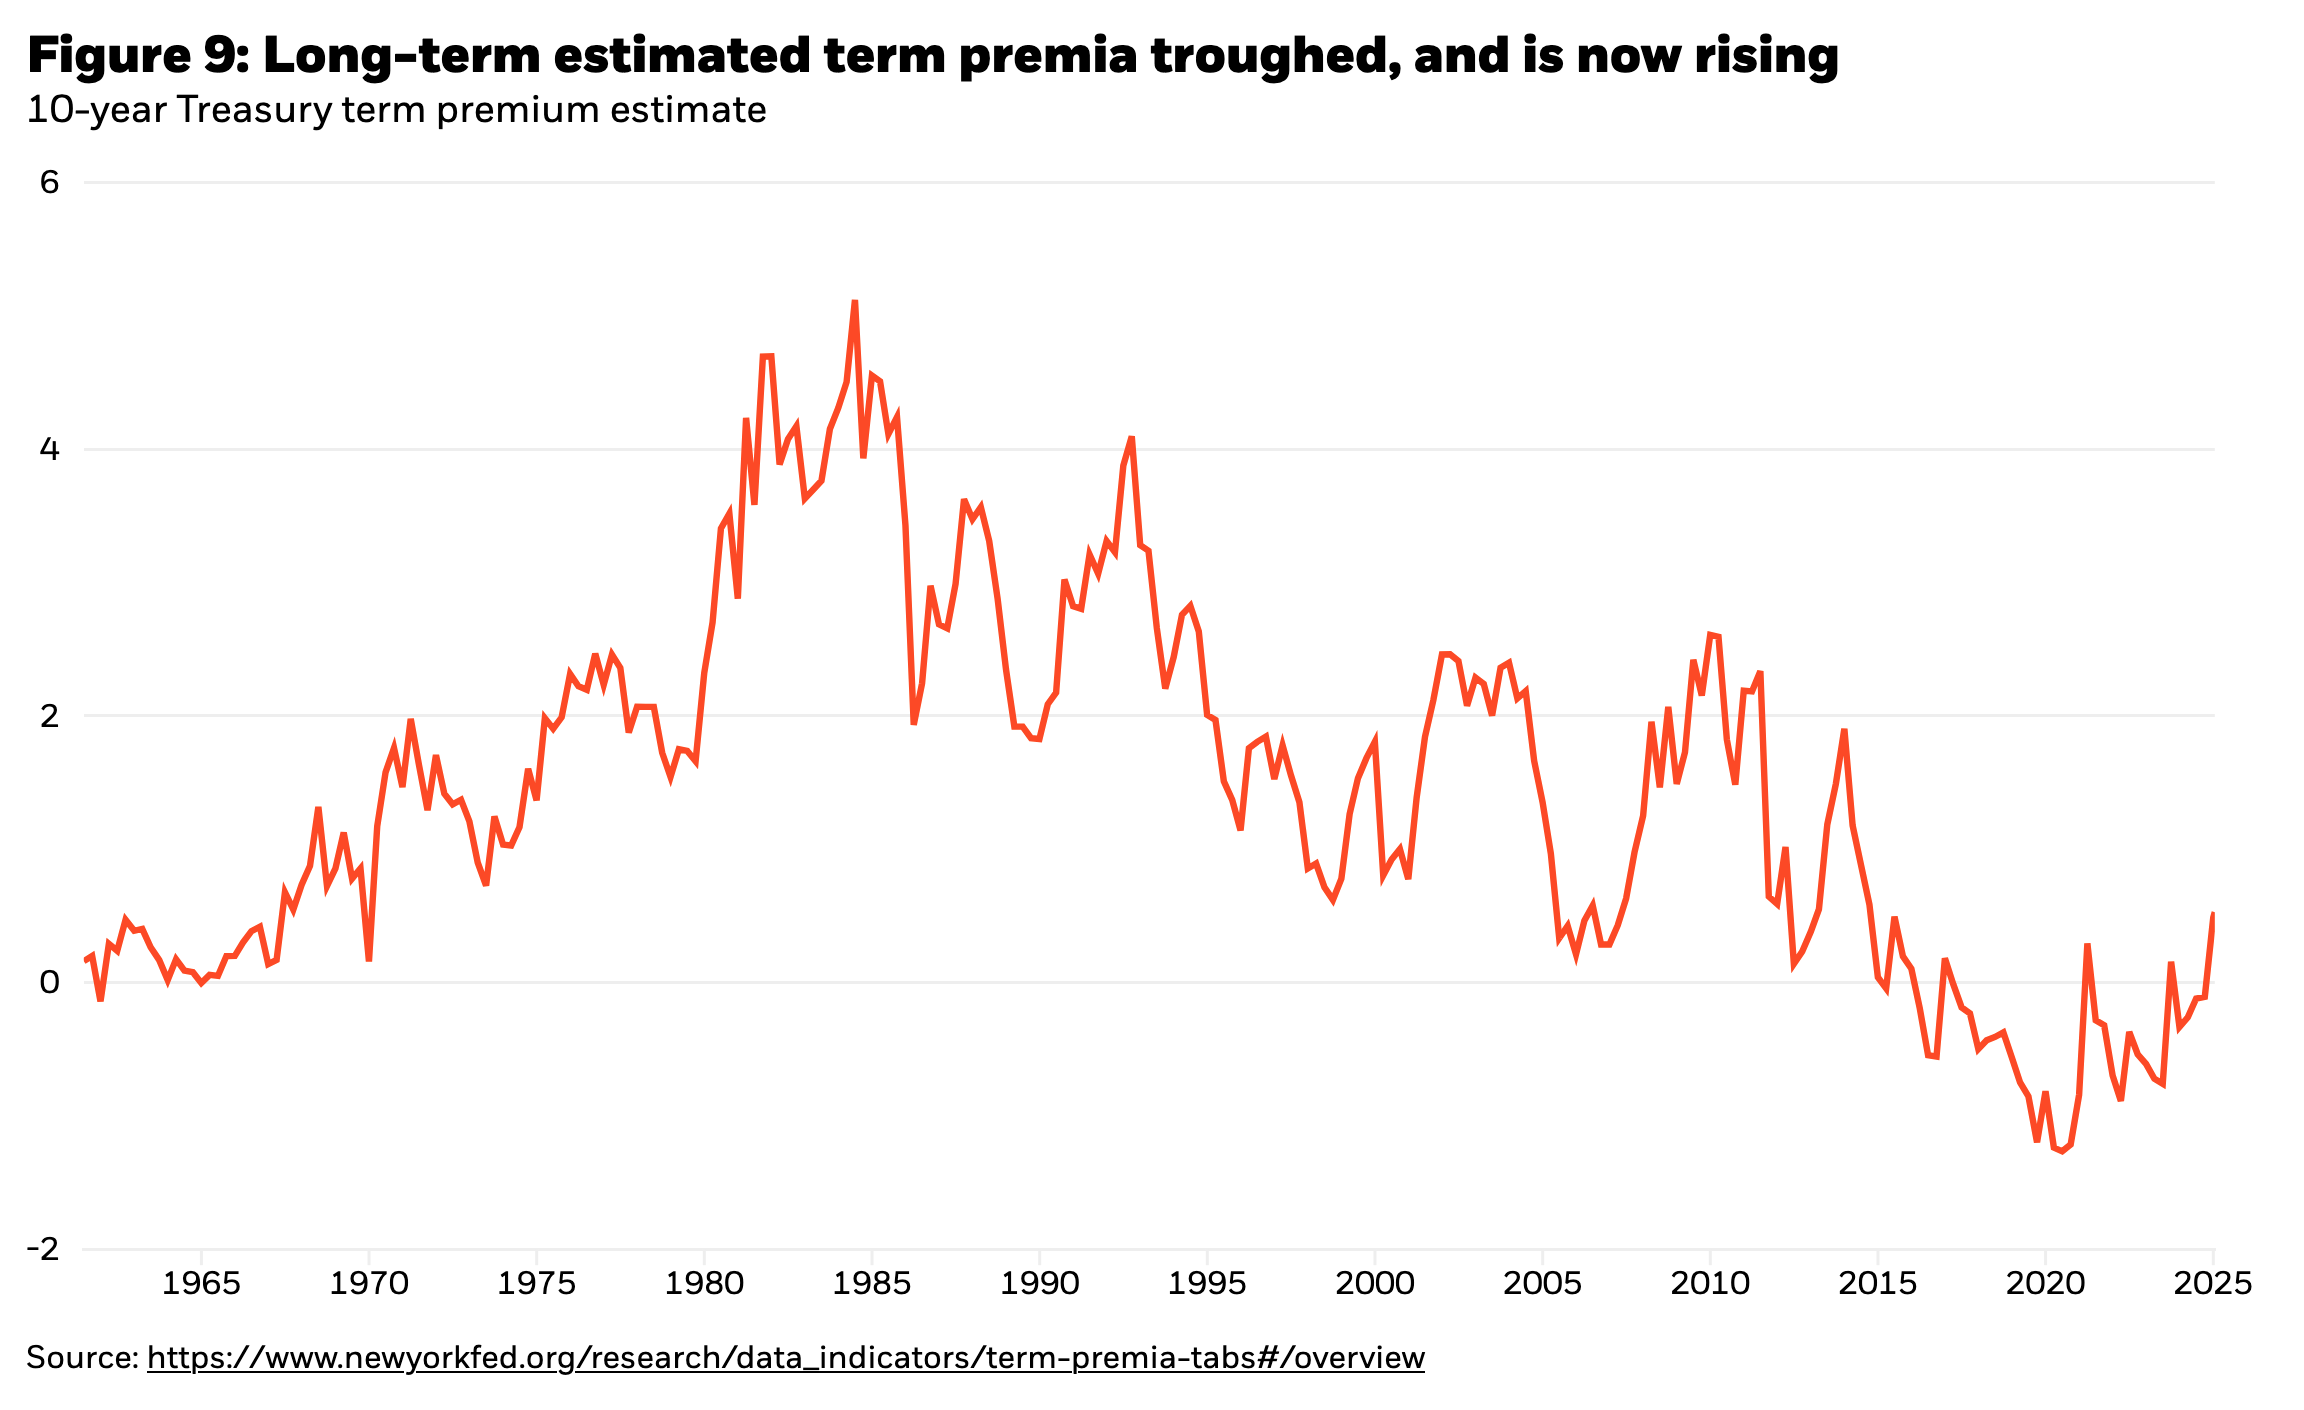
Estimates of term premia, such as the one in Figure 9, highlight increases off the lows but also the potential for further room to expand relative to history.
Treasury issuance will remain in focus as uncertainty surrounding the fiscal outlook likely impacts term premia and yields—the risk being a more permanent increase in deficits requiring greater long-term debt issuance pushing up the term premium. A more significant increase in long-term debt financing costs may eventually prompt a larger policy response in the form of more active Treasury debt management and/or Fed policy actions to restrain the term premium impact on unintended policy tightening.
Alpha sources in credit, equity, and fixed income dispersion
The flip side of the heightened uncertainty around the policy outlook for investors is in the creating of greater winners and losers from these disparate policy outcomes. While impossible to predict the outcomes of these policy debates, the uncertainty created accrues to the benefit of alpha-orientated strategies—long and short investment strategies when those strategies neutralize the directional characteristics of the portfolio through balanced long/short exposures. Market, beta, and factor neutral long/short strategies then stand as the beneficiaries of the increased governmental policy uncertainty.
We quantify and characterize the opportunity set across three of our major market strategies: equity long/short, credit long/short and macro emerging market (“EM”) and developed market (“DM”) long/short.
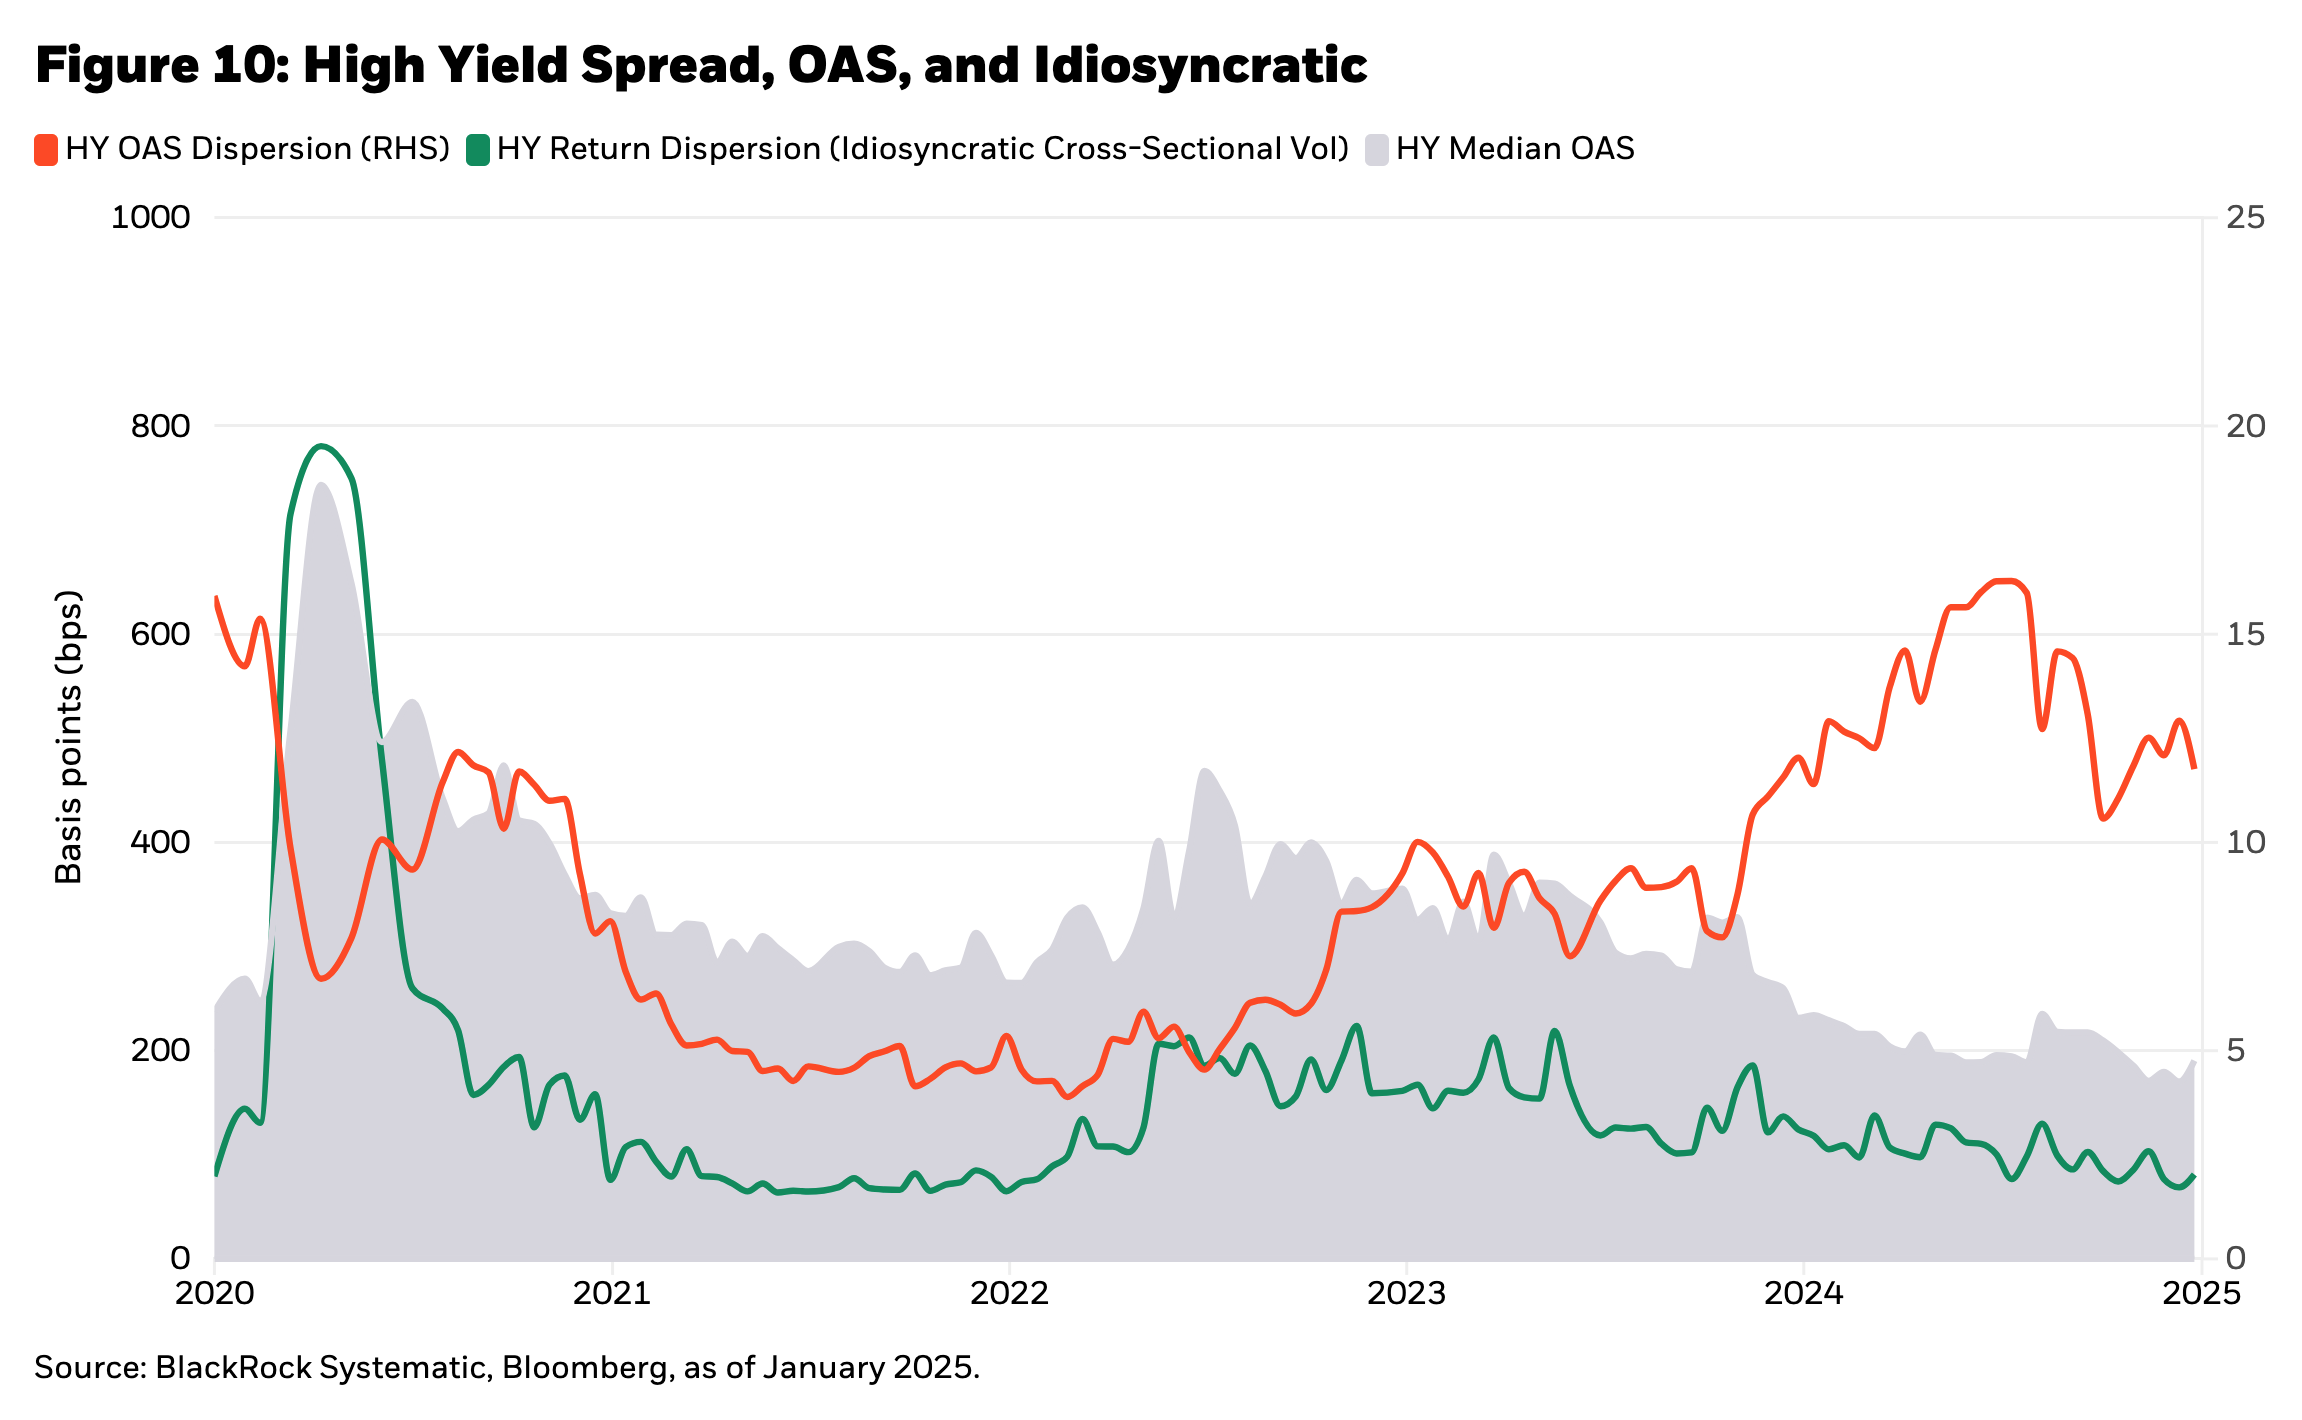
Figure 10 highlights the opportunity in long/short credit investing, focusing on high yield. Overall, high yield credit spreads reflect an environment of low default risk, strong and rising credit quality, and historically tight credit spreads. Dispersion in both spread terms and idiosyncratic terms (taking out common factor exposures) usually appears low at these points in the credit cycle. And while at the idiosyncratic level this cycle shows similar patterns, a rise in CCC credit risk may reflect some of the winners and losers we see between large and small size companies reflected in the broader economic “K” shaped recovery where large, wealthy individuals have fared much better versus lower income cohorts during the post-COVID recovery.
In equities, the trend over the past two years of historically low implied correlations captures the high degree of winners and losers priced into the equity markets. This partly reflects the rise of dominant firms and the impact of large technology winners (and losers). As mentioned previously, this partly reflects the impact of a post-COVID “K” shaped recovery creating a greater bifurcation of (typically) large versus small company winners and losers. Overall, the low level of implied correlation reflects an environment of high return dispersion and high alpha opportunity for neutral long/short equity strategies.
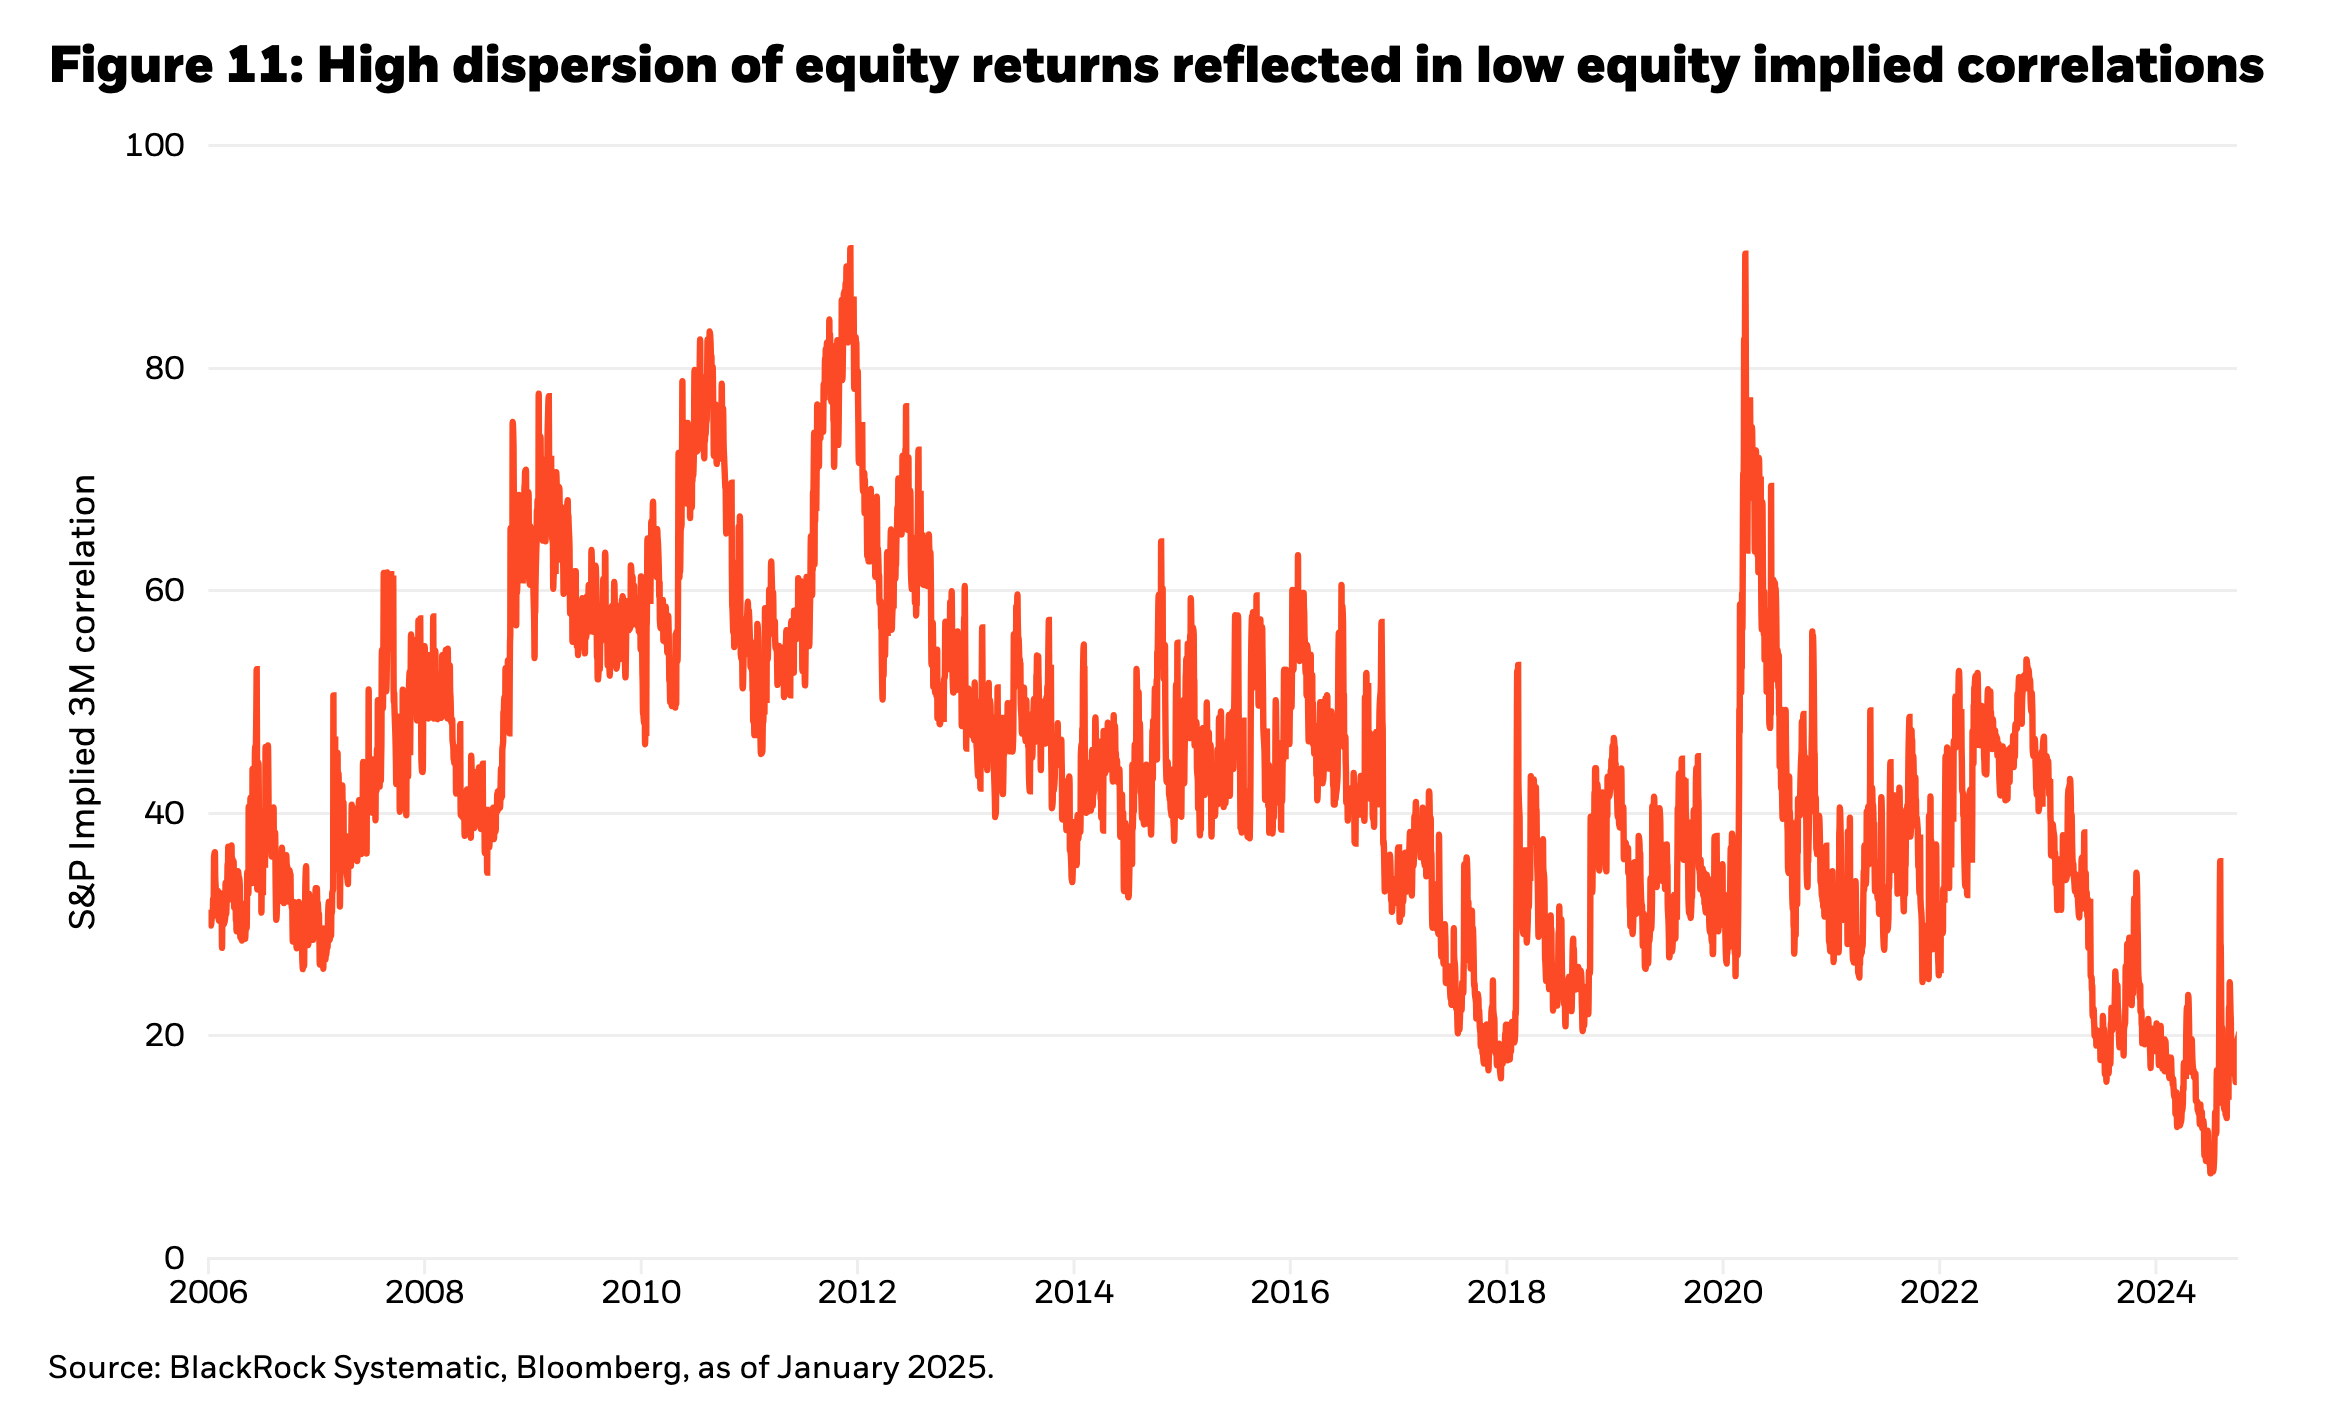
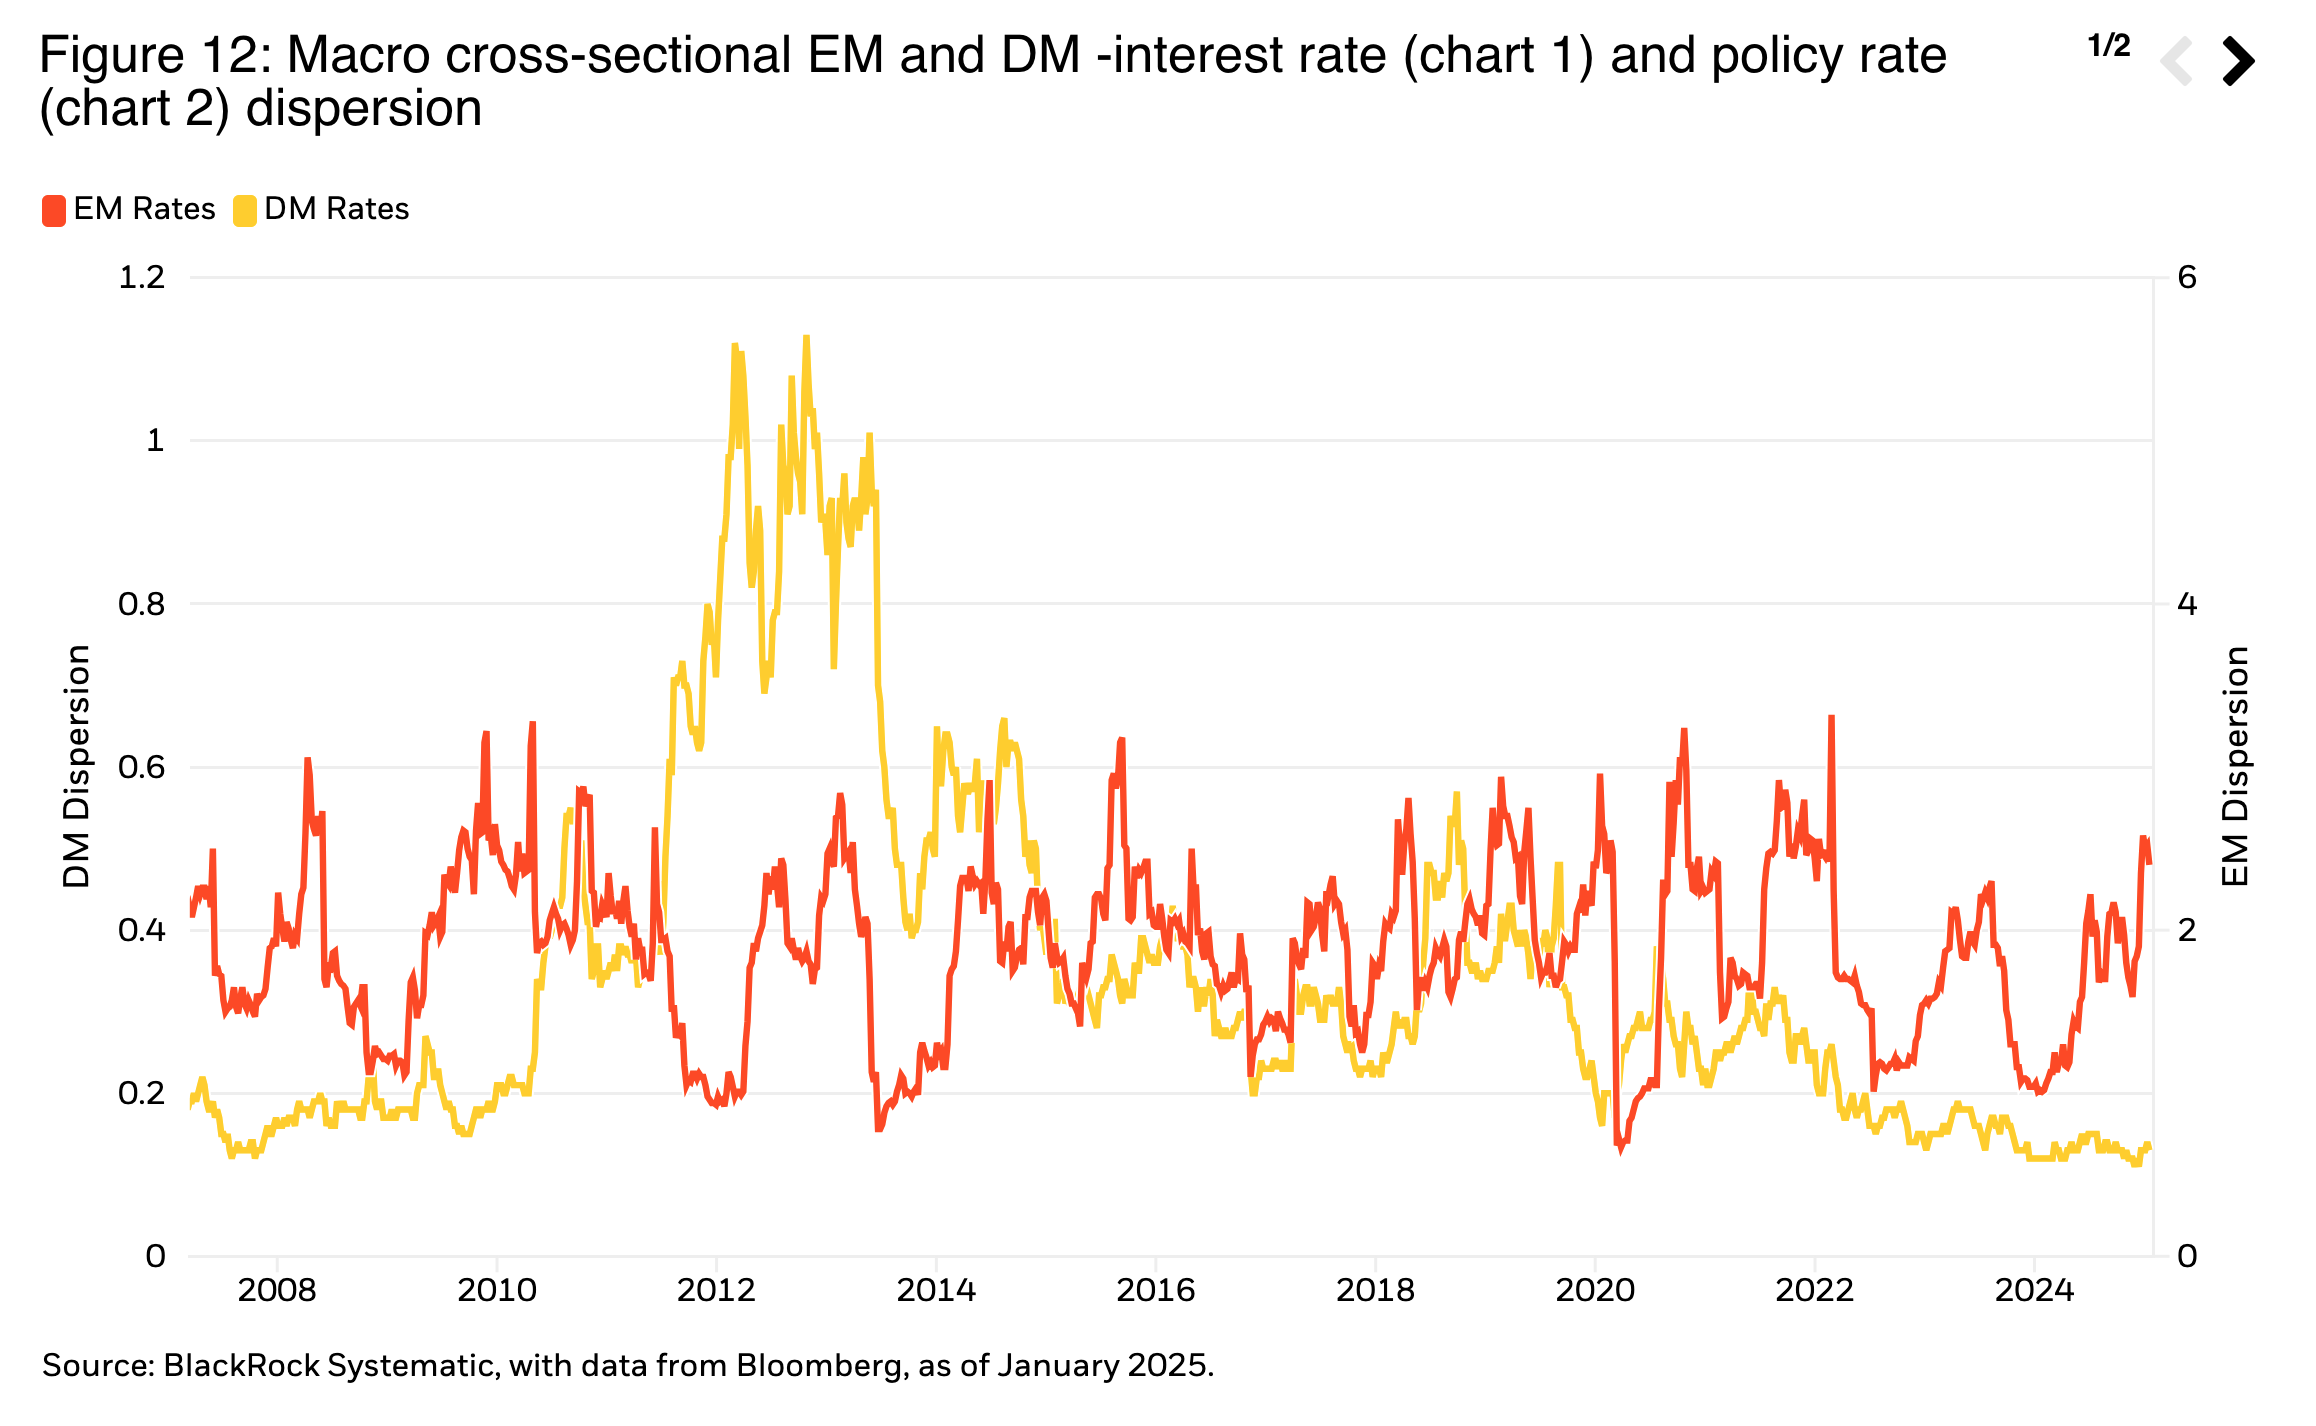
Figure 12 looks at the macro outlook for dispersion across EM and DM rates. Here we see the impact of differential macroeconomic inflation and growth performance post–COVID finally starting to manifest in the form of differential monetary policy. That feeds through into higher EM versus DM dispersion, with more limited but higher DM monetary policy dispersion, as for example European Central Bank versus Fed policy divergence creates some greater alpha opportunities.
Conclusion
The Fed’s pause on interest rate normalization reflects a shift in the market consensus from fears of recession and overtightening to a recognition that “neutral” might be closer than previously believed.
Policy uncertainty supplants economic uncertainty with significant policy changes underway, with both positive and negative potential market and economic consequences. In such an environment, the hedging efficacy of bonds may matter more than income or price appreciation. Term premia have somewhat increased, but we see risks that further steepening may be necessary before the attractiveness of the longest debt maturities is restored.
For now, that leaves the short-end and belly more attractive both for ballast and the improved yield outlook relative to lower cash yields. Credit spreads remain tight, reflecting positive fundamentals and a low default outlook. Income remains the major reason for extending down into credit, but full valuations suggest taking on less than peak cycle allocations.
An increased focus on policy uncertainty makes directional risk strategies difficult but improves the outlook for “alpha” long/short market neutral strategies. Policy outcomes create a widening in perceived winners and losers, increasing the alpha opportunity set. Defensively selected alpha strategies furthermore may provide another source of bond ballast without the bond dependencies.
Copyright © BlackRock