


by Edward D. Perks, CFA, Chief Investment Officer, Franklin Income Investors
US economic resilience should continue to serve as a favorable backdrop for investors in 2025, according to Ed Perks, Chief Investment Officer of Franklin Income Investors. This article explores the implications of this scenario on the equity and fixed income markets, highlighting specific areas that offer promising income opportunities in 2025.
Resilient economy and monetary policy shift
The US economy experienced a Goldilocks scenario in 2024, not too hot and not too cold. The economy remained resilient, and fears of a hard landing—let alone a soft landing—turned out to be a “no landing.” A healthy labor market, wage growth, personal income increases and record-high household net worth drove broad consumer strength during the year.
The US economy experienced significant disinflation from peak levels in 2022 that continued into 2023 and 2024. Although some market participants were concerned about a stall in this disinflation trend, a second wave of inflationary pressures did not materialize in 2024. Additionally, while the unemployment rate rose slightly to 4.1% in December 2024, it remains at a moderately low level based on historical standards.
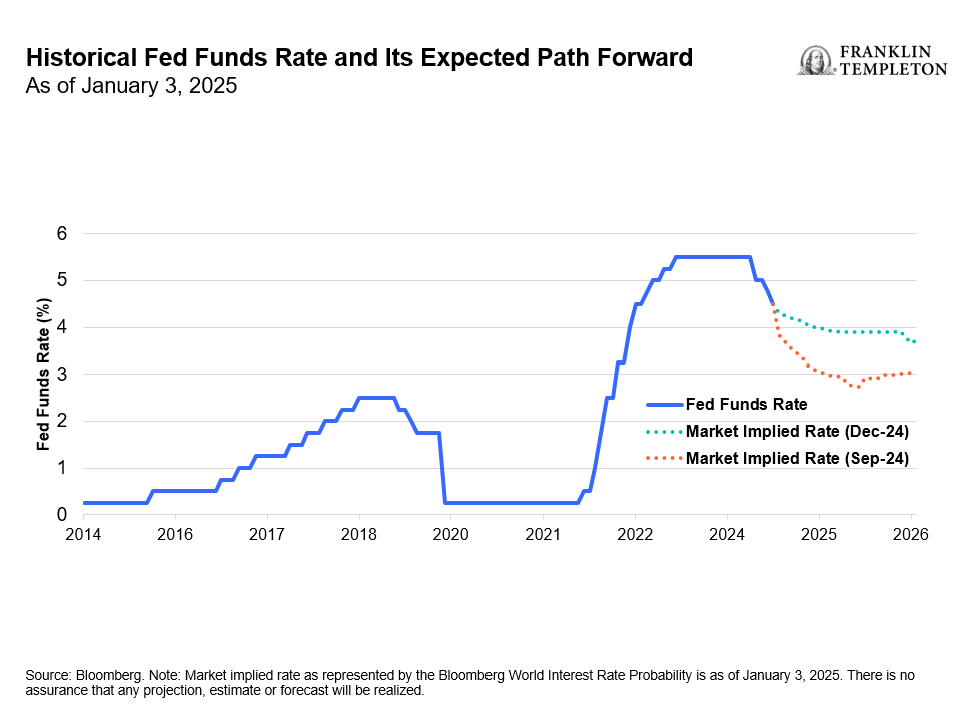
This modest softening in the labor market has allowed the US Federal Reserve (Fed) to shift toward normalizing monetary policy from its restrictive stance. After a prolonged pause, the Fed reduced interest rates by 100 basis points (bps) from September to December 2024. Further rate cuts are expected this year, consistent with the Fed’s message from its January 2025 meeting, when it left rates unchanged. In our opinion, this normalization of monetary policy will drive not just the economy, but it will also impact financial markets.
Exhibit 1: Fewer Rate Cuts Expected in 2025
Interest-rate volatility and opportunities in fixed income
Over the past 6-12 months, the fixed income market experienced significant interest-rate volatility. The benchmark 10-year US Treasury yield fluctuated from a low of 3.6% in September 2024 to a high of 4.8%, settling to around 4.5% at the end of January 2025. This rate is still well above the average of recent years, so fixed income investments remain attractive to us as income investors.
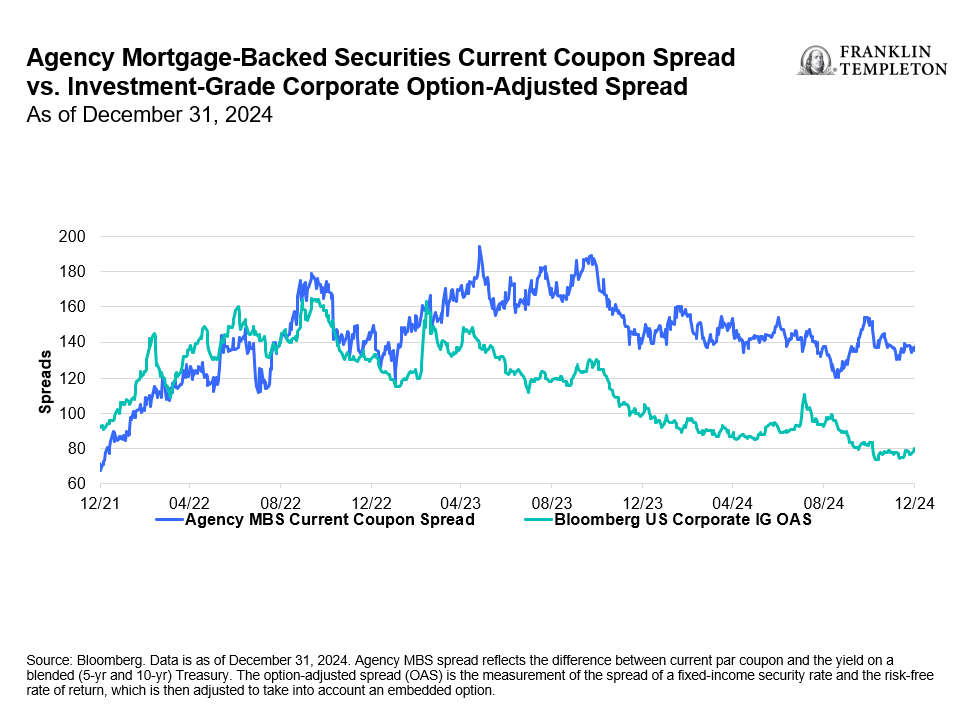
Within fixed income sectors, investment-grade corporate bonds have seen credit spreads decline from about 160 bps 2.5 years ago to around 80 basis points at the end of December 2024.1 This trend has reduced the compensation for credit risk and made this segment less attractive to us. Similarly, high-yield corporate bonds have seen credit spreads drop from more than 500 bps to around 260-270 bps for the same period.2 In contrast, valuations or spreads within agency mortgage-backed securities (MBS) have not seen the same kind of contraction or move lower as corporate bonds. In our analysis, agency MBS is an area where yields look attractive.
Exhibit 2: Sector Diversification Potential Within Fixed Income
Broadening equity markets and opportunities
Meanwhile, the US equity markets have seen historic gains, with the S&P 500 Index up more than 25% per year in 2023 and 2024.3 However, when we look at the S&P 500 on an equal-weighted basis, or focus on high-dividend stocks as measured by the MSCI USA High Dividend Yield Index, the annual returns drop to about 13% and 9%, respectively, over the same two-year period.4 This demonstrates that a narrow set of stocks drove the strong performance, particularly mega-cap-technology growth names. However, toward the end of 2024, the equity market began to broaden, offering more diverse opportunities.
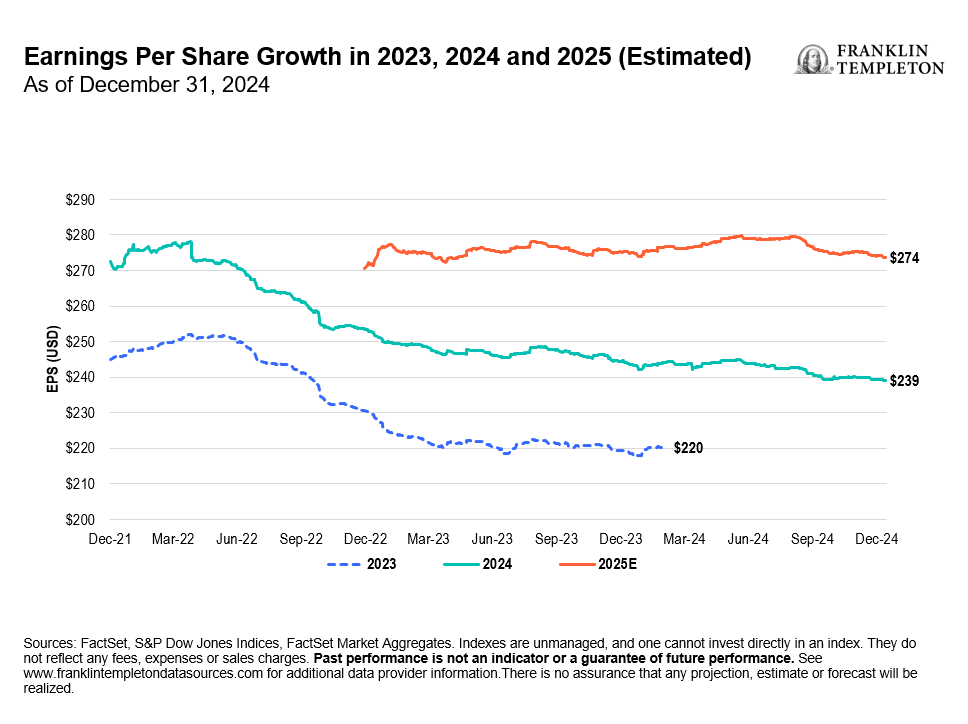
Another thing we focus on is forward valuation levels. Whenever the broader market can deliver strong returns, it is usually due to a combination of factors, such as companies experiencing earnings growth as well as valuation multiple expansion. While this was evident in some areas, particularly with mega-cap-technology companies that drove the S&P market-cap weighted index, the forward price-to-earnings ratios for the equal-weighted index and high-dividend stocks remain more reasonable and less elevated, in our analysis.5
Exhibit 3: Earnings and Dividend Growth Will Be Key Drivers
Thus, as 2024 progressed, we increased our allocation to equities as we decreased our allocation to fixed income. We currently hold a more balanced view between equities and fixed income and see expanded opportunities in both asset classes. Within equities, we favor the following sectors: information technology, health care, energy, consumer staples and industrials.
Positive outlook for 2025
The resilient growth that the US economy experienced in 2024—driven by strong consumer spending, robust corporate profits and a relatively stable labor market—serves as a favorable backdrop as we begin 2025. We expect this momentum to continue even if the economy were to decelerate to more sustainable long-term growth rates. We will remain focused on potential uncertainties, particularly around policies from the new administration. Overall, however, our outlook remains positive.
WHAT ARE THE RISKS?
All investments involve risks, including possible loss of principal.
Fixed income securities involve interest rate, credit, inflation and reinvestment risks, and possible loss of principal. As interest rates rise, the value of fixed income securities falls. Low-rated, high-yield bonds are subject to greater price volatility, illiquidity and possibility of default. Changes in the credit rating of a bond, or in the credit rating or financial strength of a bond’s issuer, insurer or guarantor, may affect the bond’s value. Asset-backed, mortgage-backed or mortgage-related securities are subject to prepayment and extension risks.
Equity securities are subject to price fluctuation and possible loss of principal.
Diversification does not guarantee a profit or protect against a loss.
Options (call writing) may limit the opportunity to participate fully from an increase in the market value of stocks and premiums received from option writing may not protect against market declines.
IMPORTANT LEGAL INFORMATION
This material is intended to be of general interest only and should not be construed as individual investment advice or a recommendation or solicitation to buy, sell or hold any security or to adopt any investment strategy. It does not constitute legal or tax advice. This material may not be reproduced, distributed or published without prior written permission from Franklin Templeton.
The views expressed are those of the investment manager and the comments, opinions and analyses are rendered as at publication date and may change without notice. The underlying assumptions and these views are subject to change based on market and other conditions and may differ from other portfolio managers or of the firm as a whole. The information provided in this material is not intended as a complete analysis of every material fact regarding any country, region or market. There is no assurance that any prediction, projection or forecast on the economy, stock market, bond market or the economic trends of the markets will be realized. The value of investments and the income from them can go down as well as up and you may not get back the full amount that you invested. Past performance is not necessarily indicative nor a guarantee of future performance. All investments involve risks, including possible loss of principal.
Any research and analysis contained in this material has been procured by Franklin Templeton for its own purposes and may be acted upon in that connection and, as such, is provided to you incidentally. Data from third party sources may have been used in the preparation of this material and Franklin Templeton (“FT”) has not independently verified, validated or audited such data. Although information has been obtained from sources that Franklin Templeton believes to be reliable, no guarantee can be given as to its accuracy and such information may be incomplete or condensed and may be subject to change at any time without notice. The mention of any individual securities should neither constitute nor be construed as a recommendation to purchase, hold or sell any securities, and the information provided regarding such individual securities (if any) is not a sufficient basis upon which to make an investment decision. FT accepts no liability whatsoever for any loss arising from use of this information and reliance upon the comments, opinions and analyses in the material is at the sole discretion of the user.
Products, services and information may not be available in all jurisdictions and are offered outside the U.S. by other FT affiliates and/or their distributors as local laws and regulation permits. Please consult your own financial professional or Franklin Templeton institutional contact for further information on availability of products and services in your jurisdiction.
Please visit www.franklinresources.com to be directed to your local Franklin Templeton website.
Copyright © 2024 Franklin Templeton. All rights reserved.
CFA® and Chartered Financial Analyst® are trademarks owned by CFA Institute.
__________
1. Source: Bloomberg.
2. Ibid.
3. Sources: FactSet, S&P Dow Jones Indices. Indexes are unmanaged and one cannot directly invest in them. They do not include fees, expenses or sales charges. Past performance is not an indicator or a guarantee of future performance. See www.franklintempletondatasources.com for additional data provider information.
4. Sources: FastSet, S&P Dow Jones Indices, MSCI. The MSCI USA High Dividend Yield Index is based on the MSCI USA Index, its parent index, and includes large- and mid-cap stocks. The index is designed to reflect the performance of equities in the parent index (excluding REITs) with higher dividend income and quality characteristics than average dividend yields that are both sustainable and persistent. Indexes are unmanaged and one cannot directly invest in them. They do not include fees, expenses or sales charges. Past performance is not an indicator or a guarantee of future performance. See www.franklintempletondatasources.com for additional data provider information.
5. Ibid.