As the dust settles on another rollercoaster year in the markets, the time is ripe to reflect. The following compilation isn’t just a stroll down memory lane — it’s an effort to unpack the lessons and trends that defined 2024. Let’s add a layer of skepticism, a touch of dark humor, and a clear-eyed look at what might come next, with insights from Callum Thomas1.
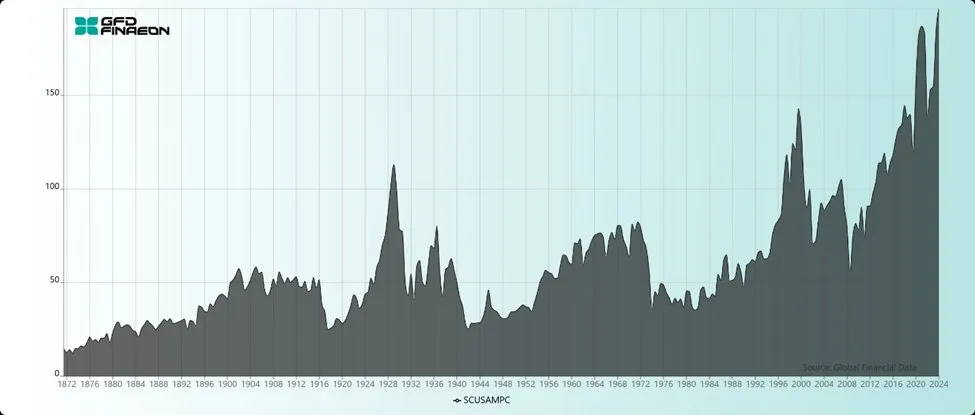
1. Market Cap to GDP Ratio
Ah, the Market Cap to GDP Ratio — or as we might call it, the “Everything’s Fine Until It Isn’t” metric. For the first time in history, this ratio broke through the 200% mark. Callum Thomas notes, “A reflection of the time we live in with regards to US leadership in global markets, but also the stage we are at in the market cycle.” History teaches us one lesson repeatedly: gravity always wins.
Source: Weekly ChartStorm 8 Dec 2024 [@MebFaber]
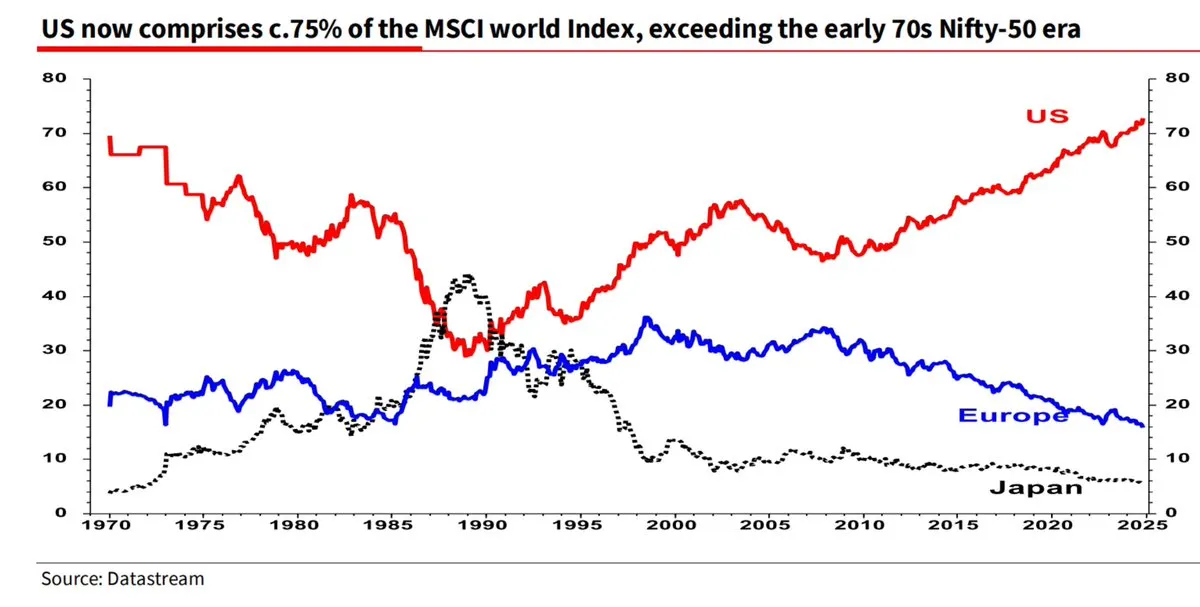
2. US Market Cap vs. the World
In 2024, the U.S. stock market cap hit a new high relative to developed markets worldwide. Callum points out, “It reflects US dominance, but also the subtle nod to future risks vs opportunities… it’s rare to see trends like this go on forever.” Dominance? Sure. Invincibility? Hardly. Trends like these tend to reverse with the inevitability of the seasons.
 Source: Weekly ChartStorm 1 Dec 2024 [@albertedwards99]
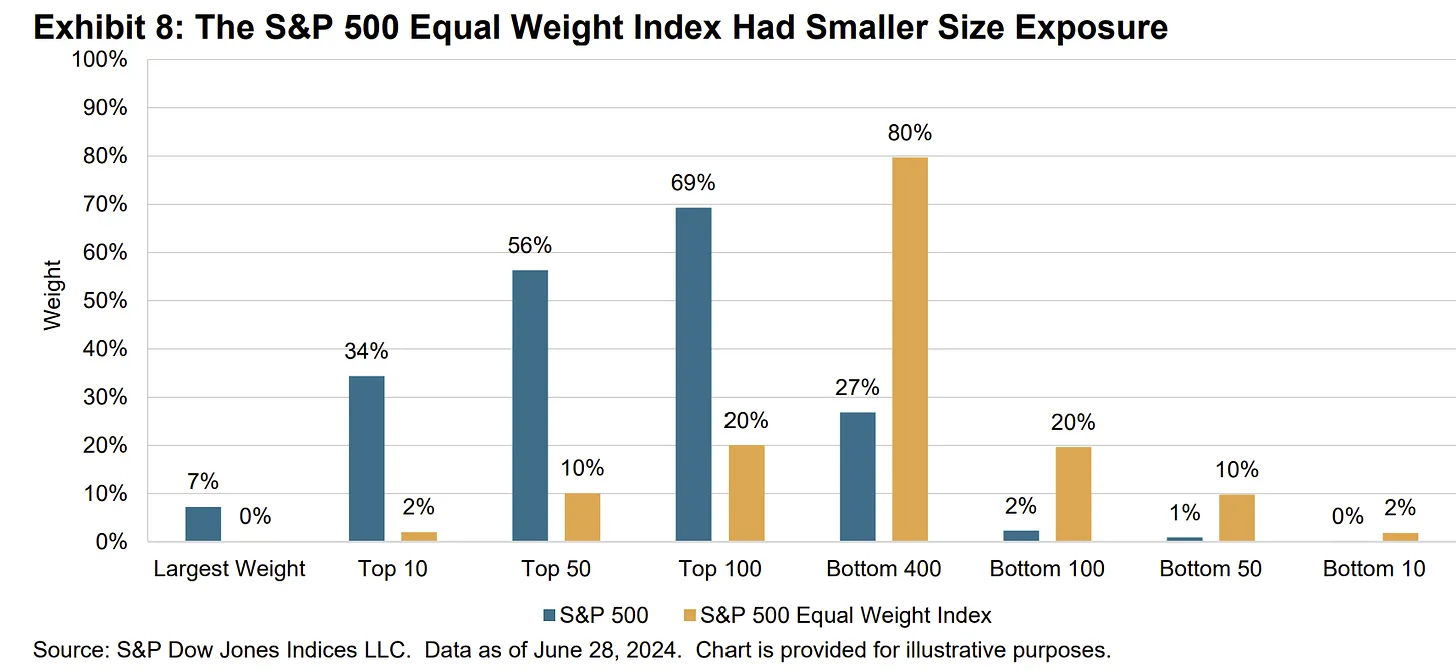
3. Market Cap Weighting vs. Equal Weighting
If you think you’re diversified because you own an S&P 500 index fund, think again. Callum observes, “The largest 10 stocks in the cap-weighted carry a weighting almost 20x (38% vs 2%) that of their equivalent standing in the equal-weighted index.” When index investing turns into a game of mega-cap roulette, you’ve got to ask: is this diversification or concentration masquerading as safety?
Source: Weekly ChartStorm 1 Sep 2024 [S&P Dow Jones Indices report]
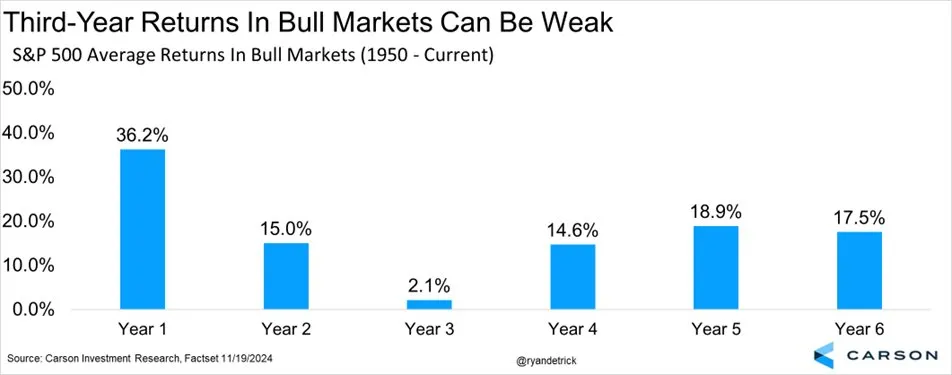
4. Third-Year Bulls
We’ve entered the dreaded third year of the cyclical bull market that began in late 2022. “The 3rd year can be frustrating,” Callum remarks. “The bright side is that if we make it through to October 2025 without the bull market ending, then there could be some good further years to follow.” But remember: markets rarely reward complacency.
Source: Weekly ChartStorm 24 Nov 2024 [@RyanDetrick]
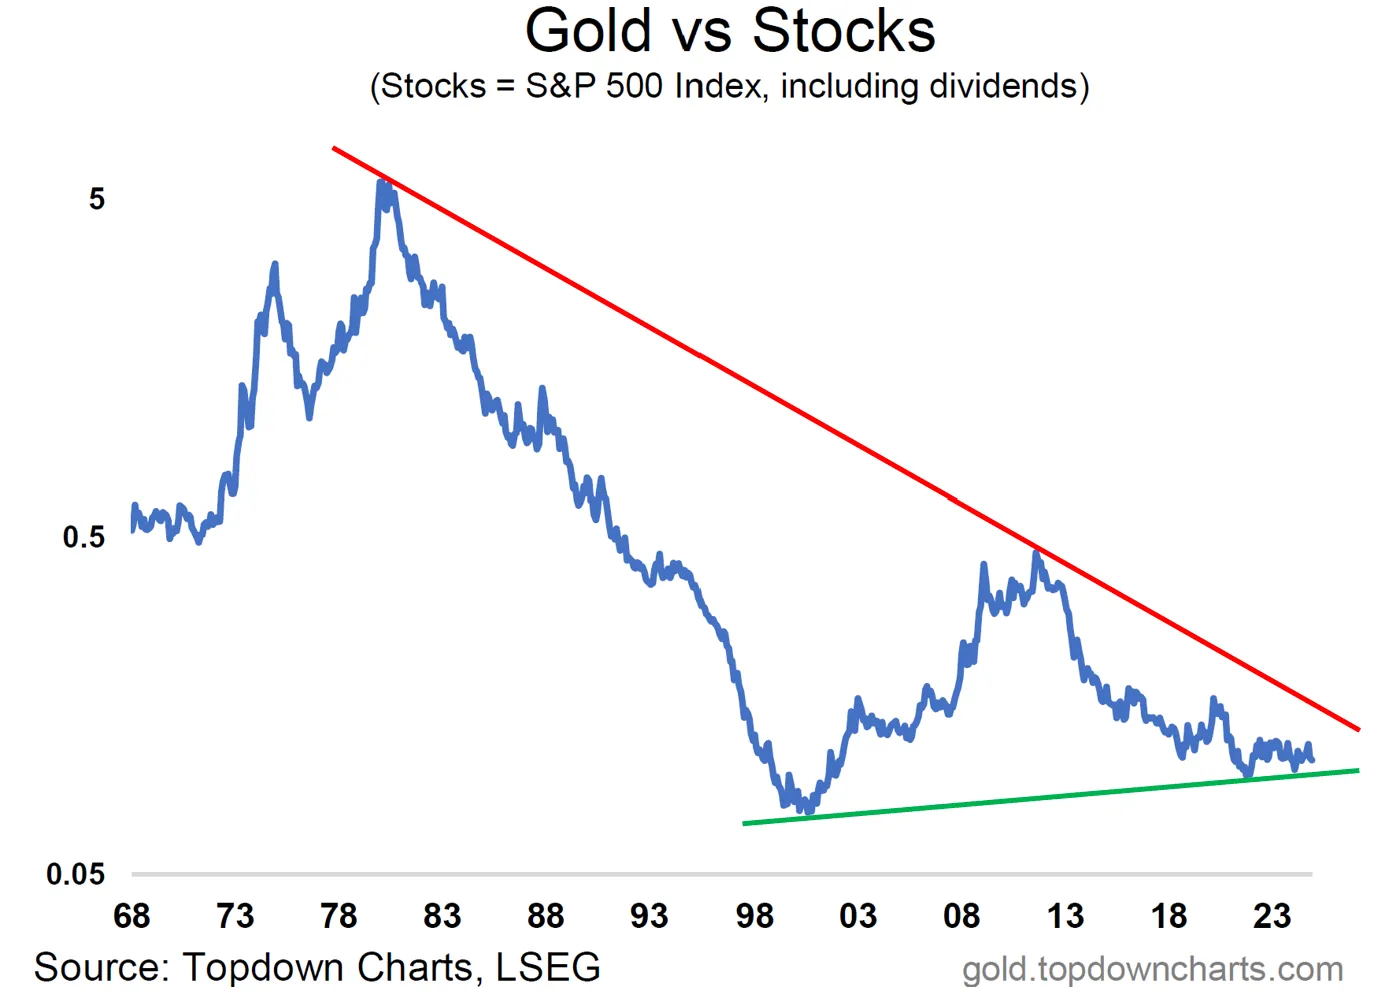
5. Gold vs. Stocks
Gold had a stellar year, rising alongside equities. But despite its glimmering headlines, gold’s relative performance versus stocks has yet to break out decisively. Callum highlights, “The gold vs stocks relative performance ratio has yet to turn the corner… probably the main way that this chart would turn up would be if stocks roll over into correction/bear market.”
Source: Weekly ChartStorm 8 Dec 2024 [Gold Market Chartbook - November 2024]
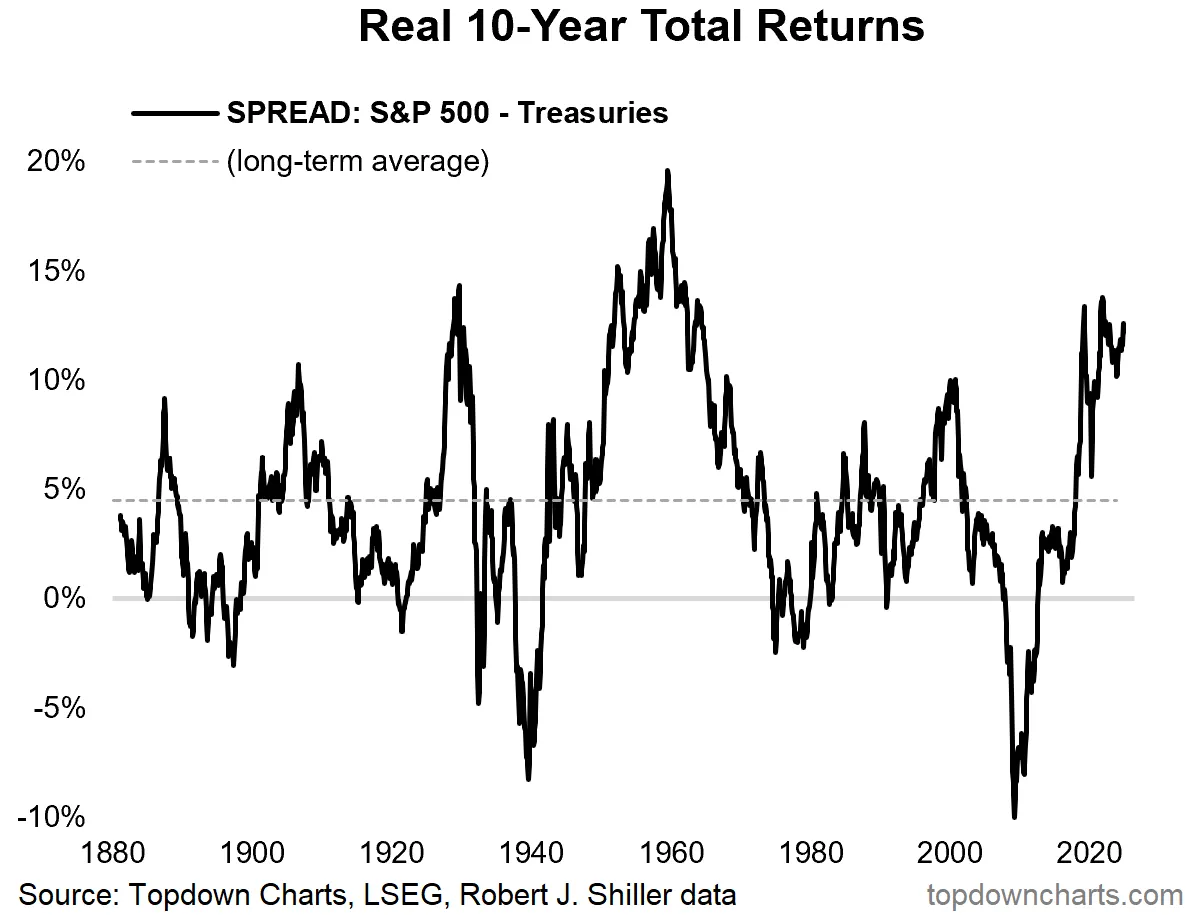
6. Realized Equity Risk Premium
For a decade, investors in equities have been handsomely rewarded compared to bonds. But Callum warns, “Problem is this thing is quite cyclical, and it looks late cycle. The implication being that maybe the subsequent 10-year realized equity risk premium may not be as good.” For those clinging to yesterday’s playbook, prepare for tomorrow’s reality check.
Source: Weekly ChartStorm 15 Dec 2024 [Topdown Charts]
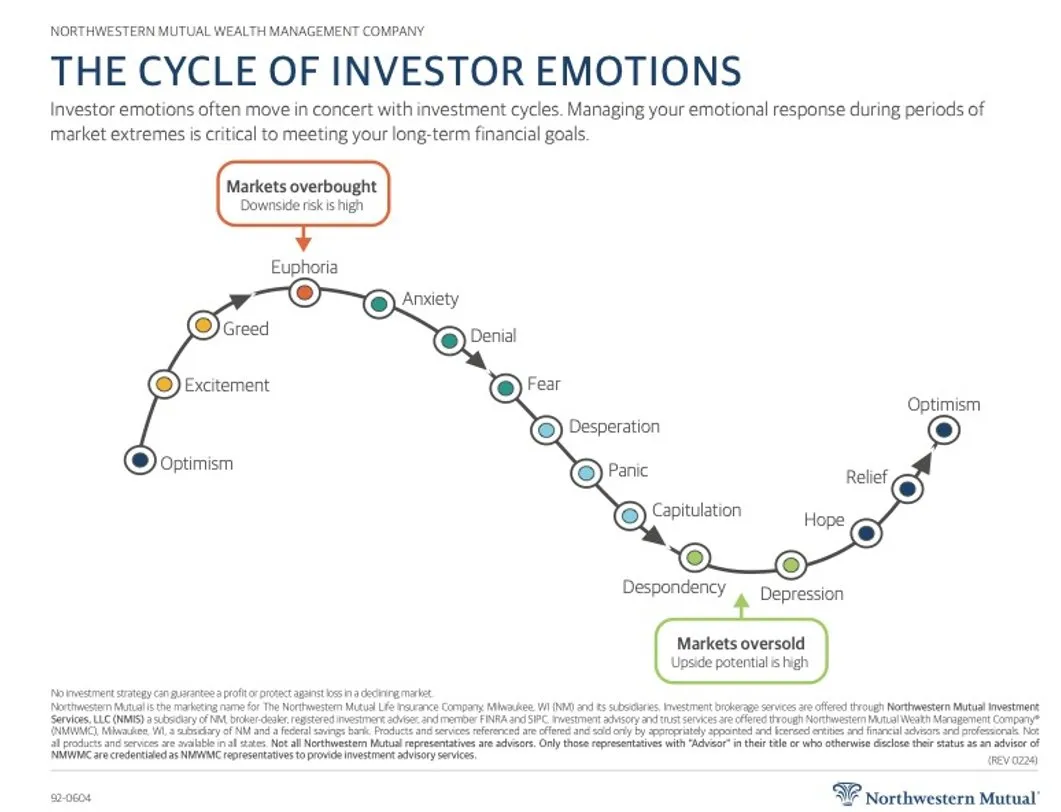
7. The Market Cycle
Investor sentiment ebbs and flows like the tides, yet the market cycle remains devilishly hard to pin down in real time. Callum reminds us, “It’s worth remembering this and also reflecting on how hard it is to detect where we are in the cycle.” The problem isn’t knowing the cycle exists — it’s staying calm when it conspires against you.
Source: Weekly ChartStorm 3 Nov 2024 [@MikeZaccardi]
8. The Hype Cycle
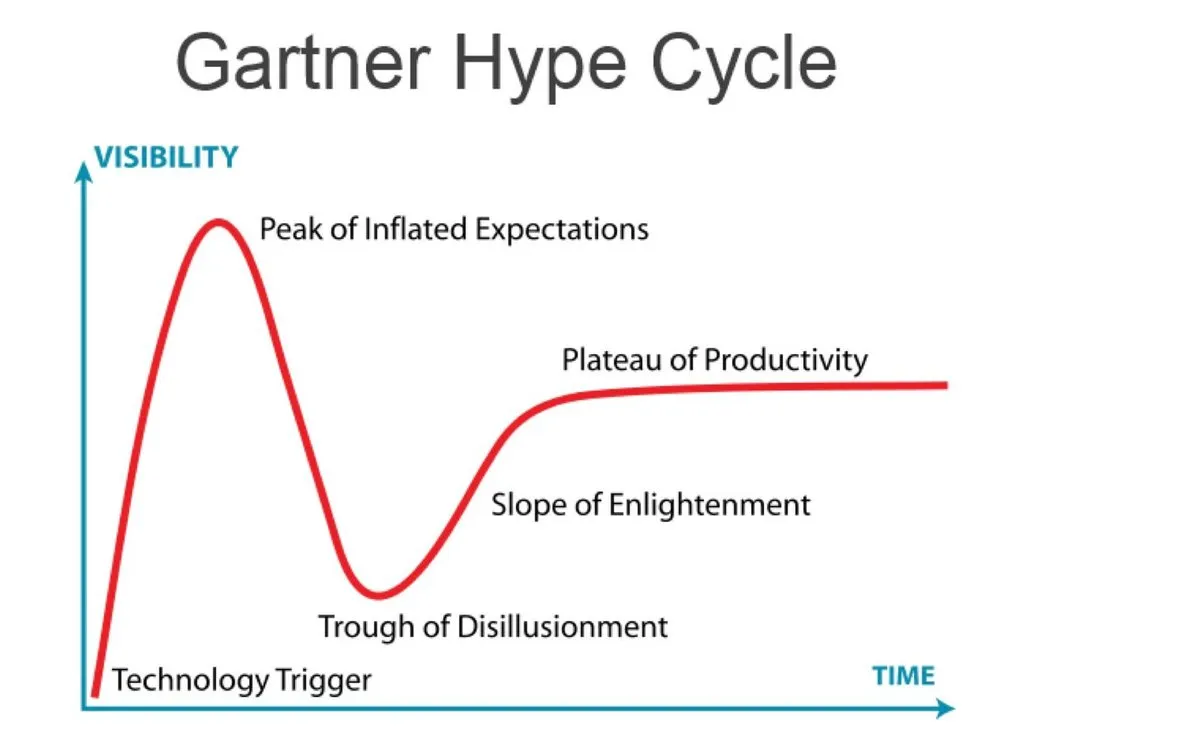
Artificial Intelligence may be the darling of 2024, but if history is any guide, the AI hype train is approaching the “peak of inflated expectations.” Callum adds, “I would estimate we are either at or close to the peak of inflated expectations on Artificial Intelligence, and that means sooner or later we’re going to go down the dip and into the trough of disillusionment.”
 Source: Weekly ChartStorm 3 Nov 2024 [@Mayhem4Markets]
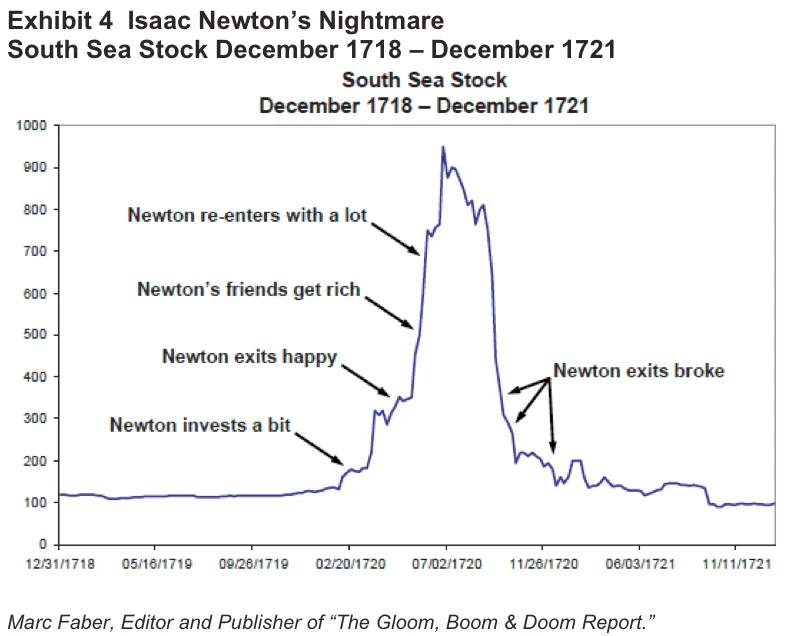
9. The Bubble Cycle
Combine the market cycle with the hype cycle, and you get the bubble cycle. “These things are a constant through history — they repeat and happen over and over again,” says Callum. Even the smartest among us fall prey to the siren song of euphoria.
Source: Weekly ChartStorm 18 Aug 2024 [The Fifth Person]
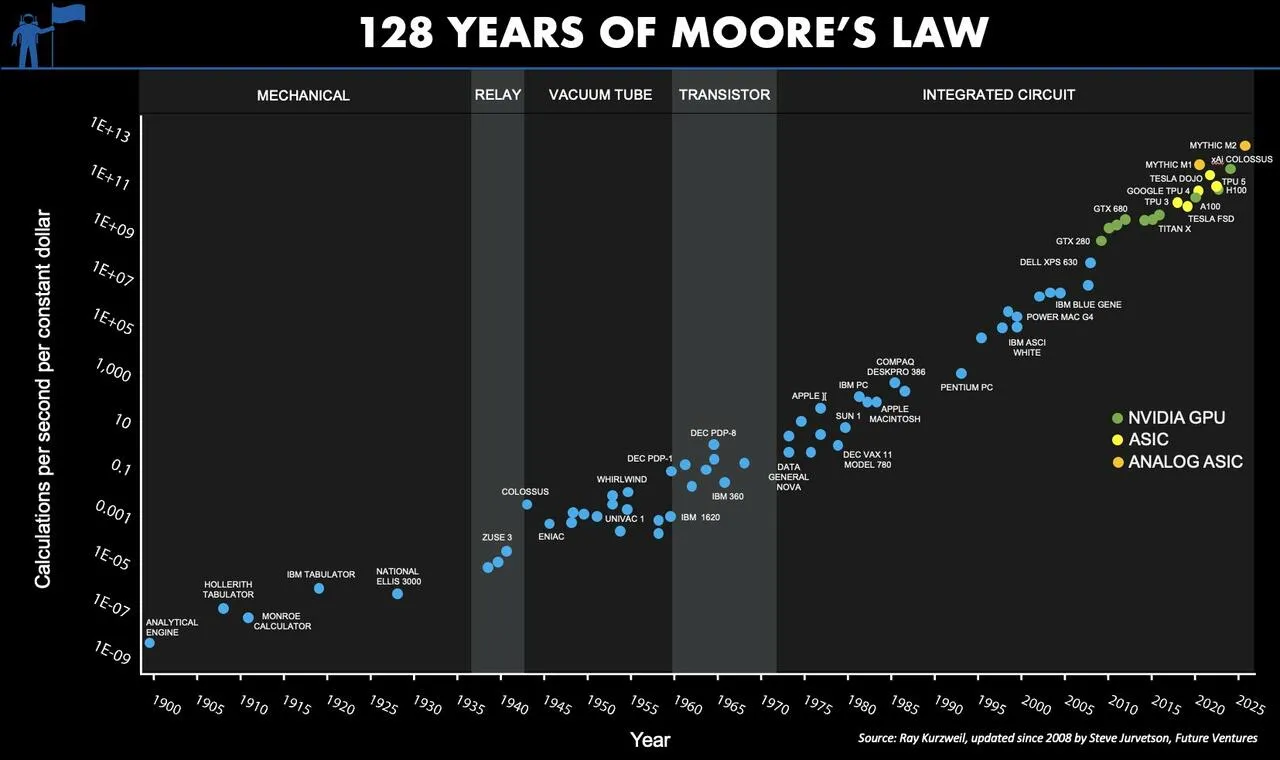
10. Moar Moore’s Law
Technological progress continues its relentless march, offering a tantalizing mix of optimism and chaos. Callum concludes, “Even as humanity as a whole wins from the onward march of technological progress, the individual winners vs losers will be in near-constant flux and probably difficulty to pick with precision.”
Source: Weekly ChartStorm 15 Dec 2024 [@FutureJurvetson]
These charts serve as both a roadmap and a cautionary tale. They are as much about human behavior as they are about markets. And as always, the biggest risks lie not in the charts themselves, but in the stories we choose to tell about them.
Copyright © AdvisorAnalyst, Chartstorm.info
1 Thomas, Callum. "Weekly S&P500 ChartStorm - 29 December 2024." The Weekly S&P500 #ChartStorm, 28 Dec. 2024, www.chartstorm.info/p/weekly-s-and-p500-chartstorm-29-december.


