by Jeff Weniger, CFA, Head of Equity Strategy, WisdomTree
Key Takeaways:
-
Pairing DLN for its downside resilience with QGRW’s growth exposure could provide investors with a diversified mix. This strategy may offer a balance between stability and potential growth in various market conditions.
-
Sector performance after rate cuts has been uneven, with Consumer Discretionary and Health Care historically outperforming while Communication Services and Utilities underperformed.
-
The impact of rate cuts on broader markets is uncertain. While rate cuts sometimes boost returns (e.g., post-1998), the cycles that commenced in 2001, 2007 and 2019 were followed by stock market declines.
This report covers these three major strategies: the WisdomTree U.S. LargeCap Dividend Fund (DLN), the WisdomTree U.S. Quality Dividend Growth Fund (DGRW) and the WisdomTree U.S. Quality Growth Fund (QGRW). For ease in the text, I’ll refer to them by their tickers.
Perhaps the most asked question we are getting is, “How should investors play Fed rate cuts?”
I’ll give some ideas for the grizzly bears, the ebullient bulls, the undecided and everyone in between.
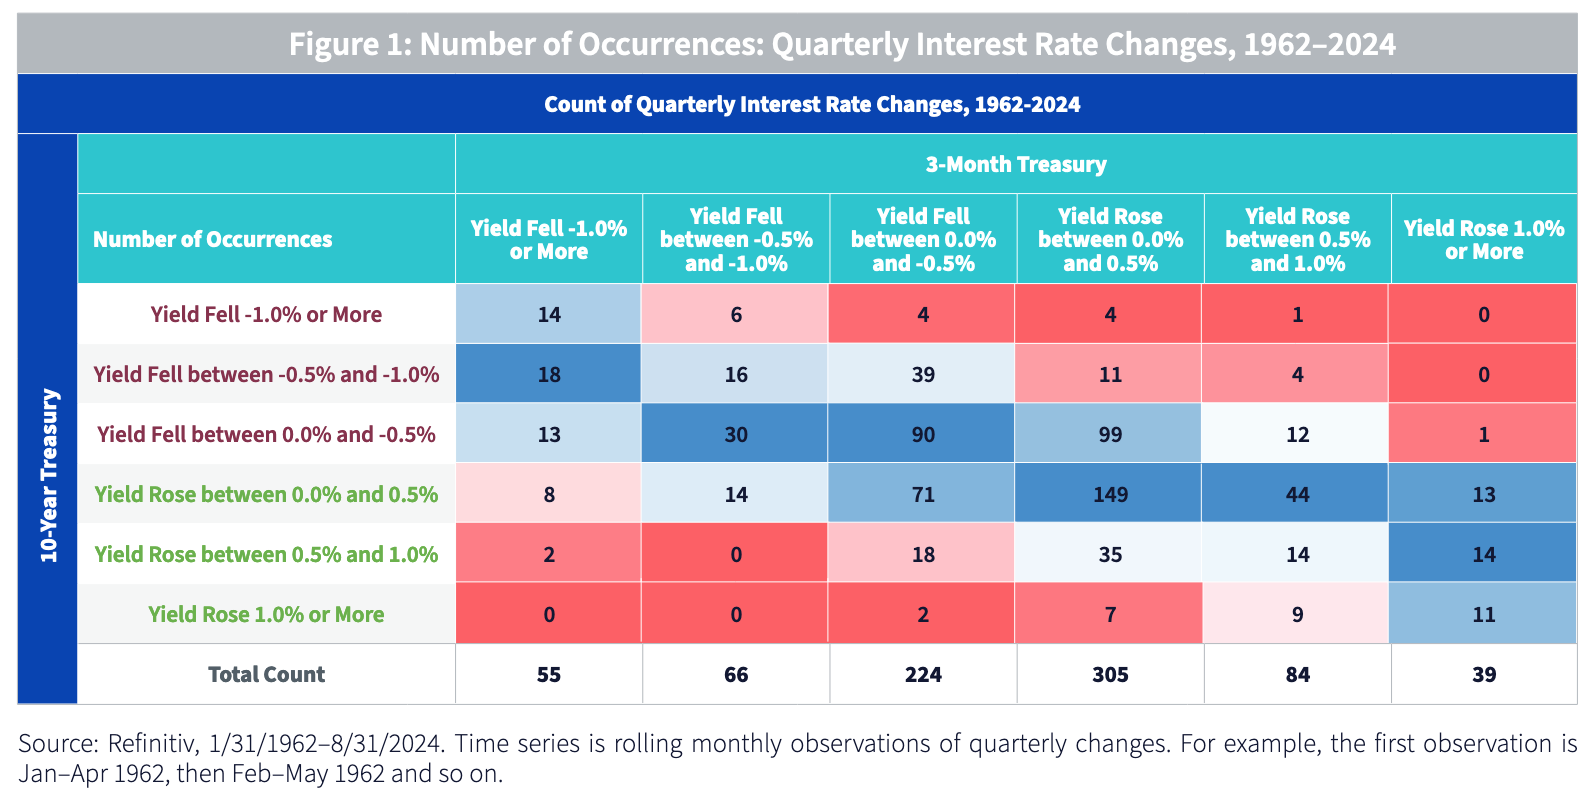
Let’s start with rates themselves. Figure 1 shows the distribution of moves in the 3-month T-Bill against attendant moves in 10-Year T-Note yields, tabulated from 1962 to 2024. As I write, the Street anticipates 110 basis points (bps) of Fed rate cuts between now and the December 18 Federal Open Market Committee (FOMC) meeting. Since 2024’s final Federal Reserve (Fed) gathering is about one quarter from now, the table presents quarterly changes in short-term rates, run monthly.
The far-left column is where to focus if you’re on board with the Street’s Fed Funds consensus. In the past, the market saw 45 scenarios (14+18+13 in the northwest corner of the table) where 10-Year Treasury rates fell during quarters when short-term rates dropped precipitously. In only 10 instances (8+2 in the table) did T-Note yields rise amid tumbling short rates.
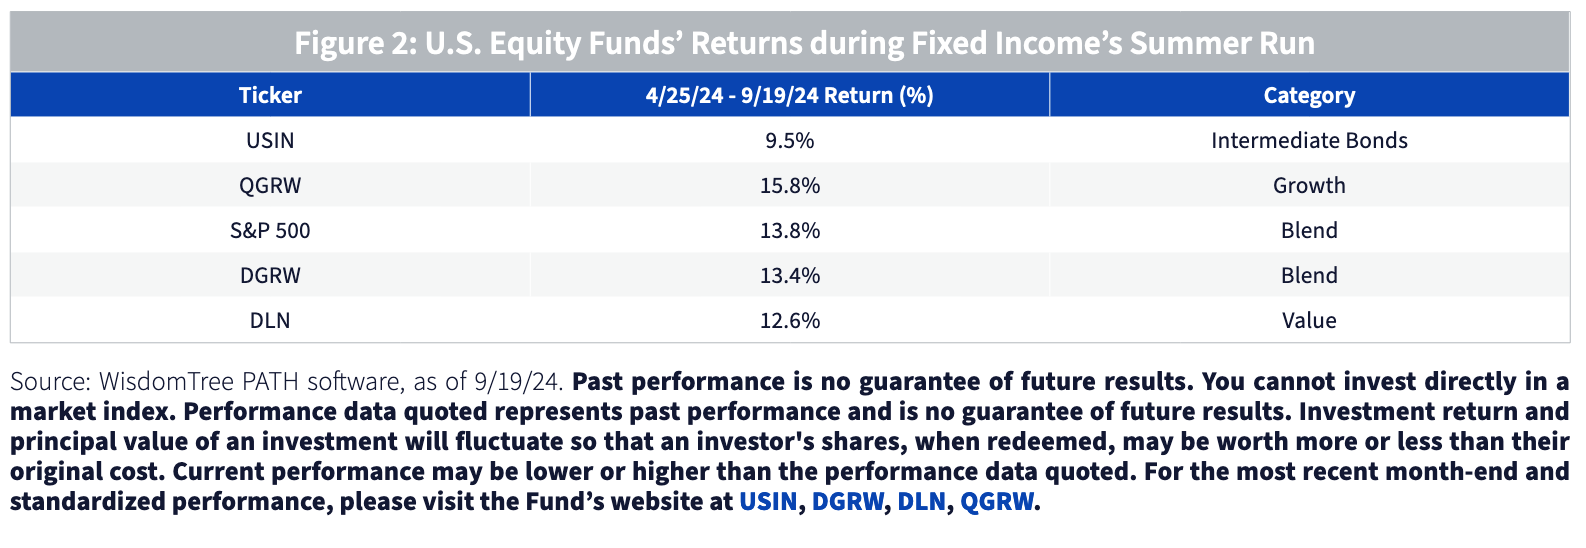
For readers who believe the bond market will abide, I consulted the 2024 action since bonds turned the April 25, 2024, low in USIN, the WisdomTree 7-10 Year Laddered Treasury Fund.
As bond yields fell, we saw a generalized melt-up across strategies, with the market paying little attention to the Growth-Blend-Value spectrum.
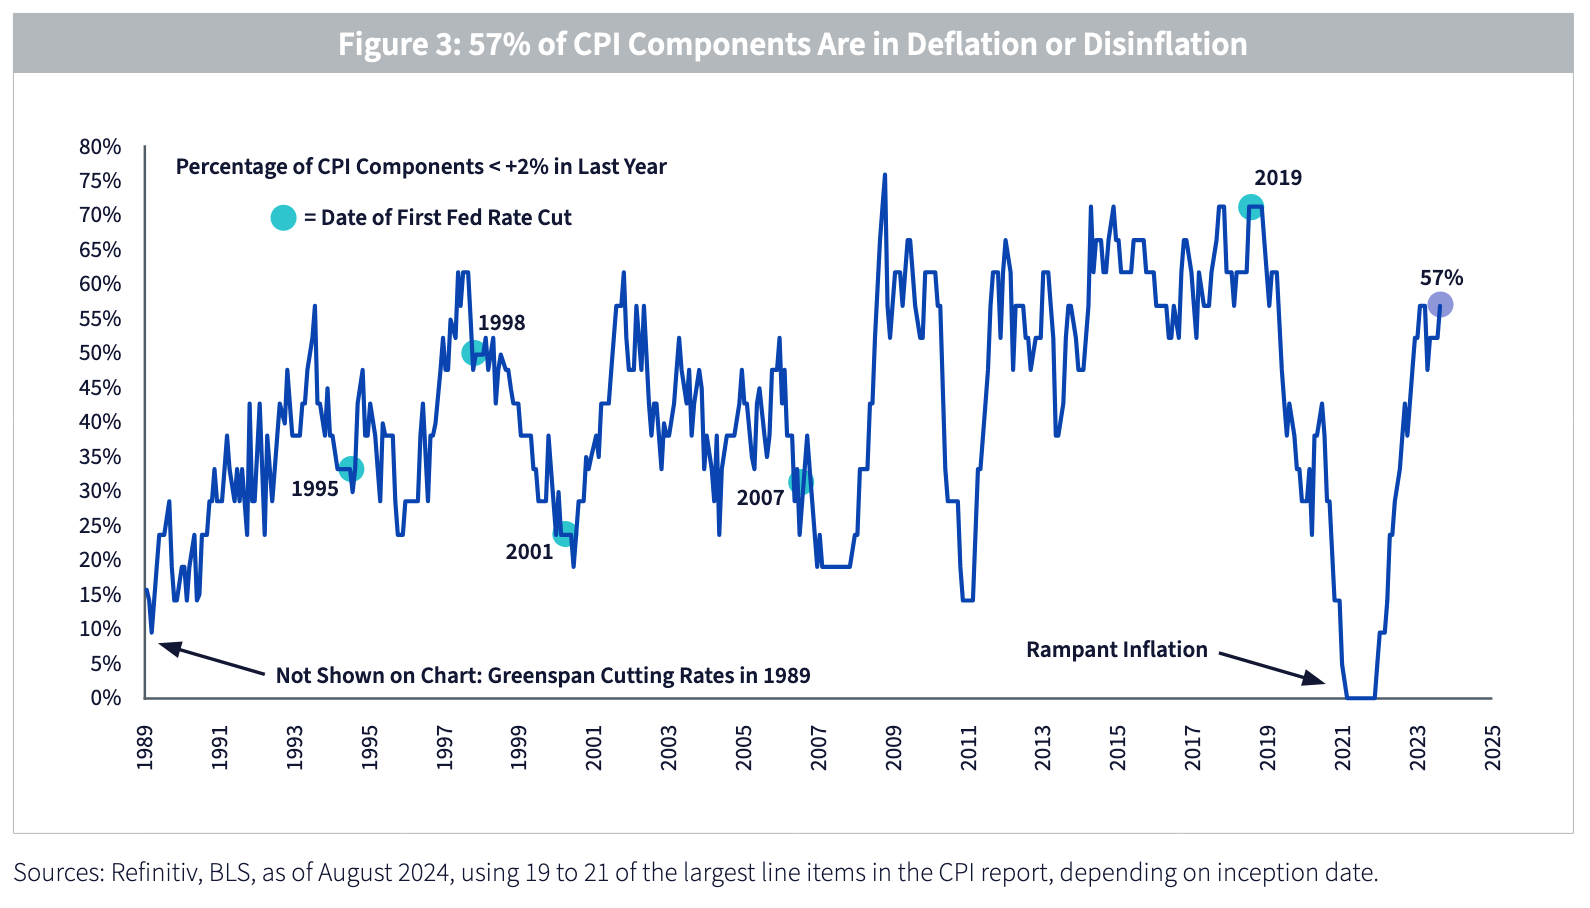
As to whether the Fed follows through and meets the consensus, I suppose we should ask if inflation is benign enough to justify slashing rates as aggressively as the Street anticipates. Looking into the bowels of the Consumer Price Index (CPI) report, 57% of the subcomponents were at or below the Fed’s 2% inflation bogey in both July and August (figure 3). That is higher than when the Fed began cutting rates in 1995, 1998, 2001 and 2007, but not as high as when Powell engaged his first set of rate cuts in 2019.
For the pessimistically inclined reader, here is a grizzly chart. With manufacturing struggling, the market’s economic soft landing thesis rests on the ISM Services PMI keeping its head above water. Historically, Fed rate cuts have given no such assurance, at least as far as the three 21st century cycles are concerned (figure 4).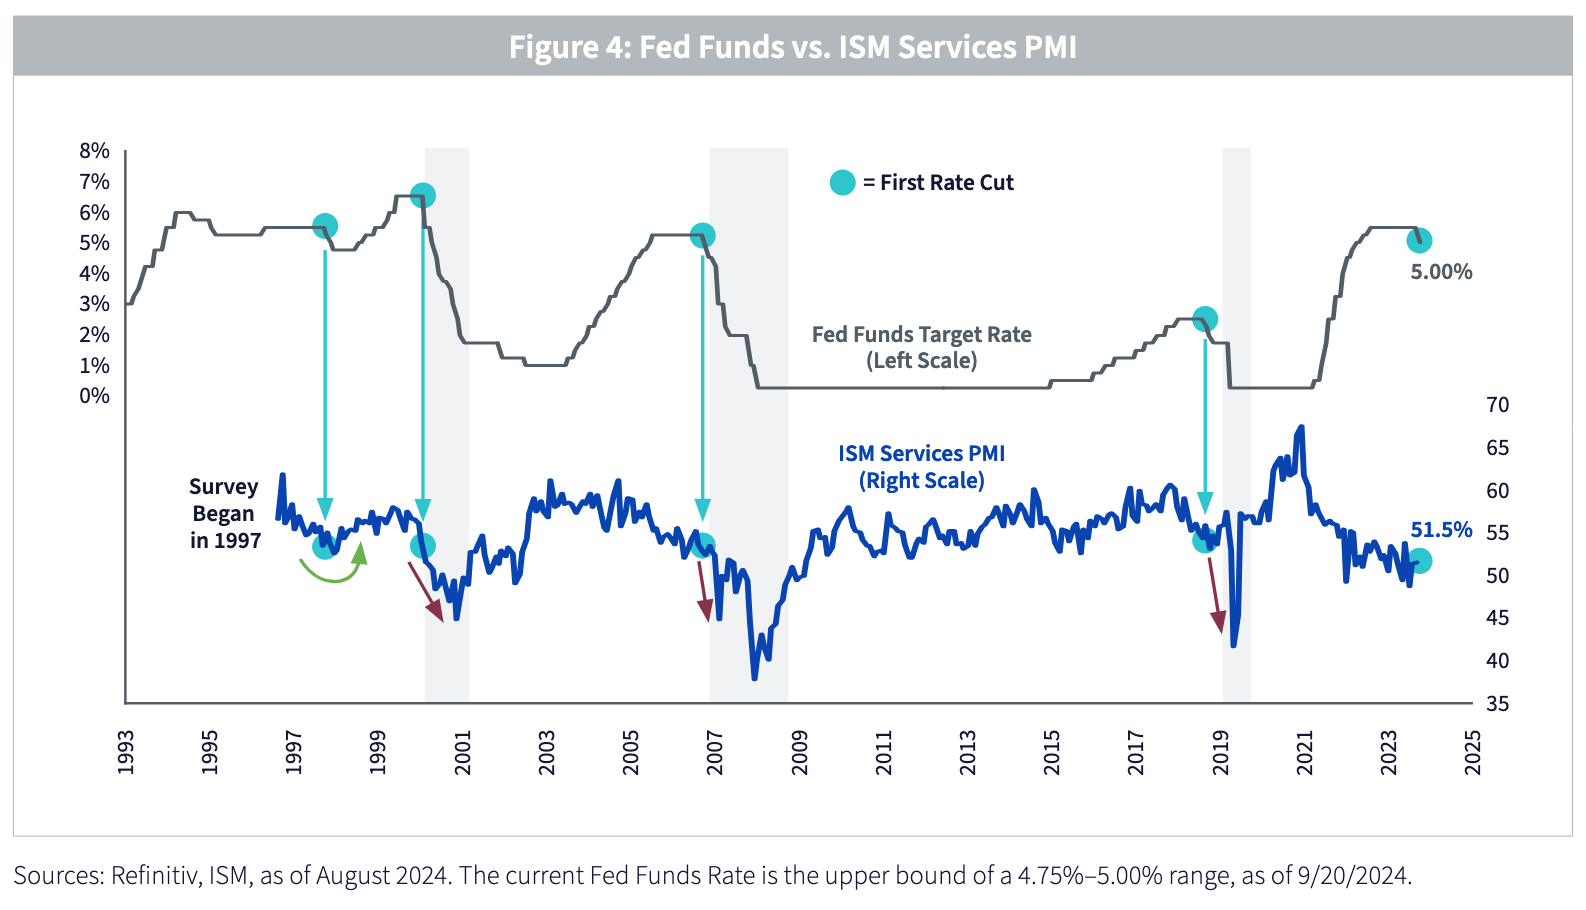
For the cautious, bearish or concerned reader (I’ll discuss the optimistically inclined Funds later), it may be of interest to see which mandates held up during the ugly 2022 action, when the market declined 24.5% from January 3 to October 12 (figure 5). DLN, the value fund, really shined in that period. That is because it watched in futility in 2021 as its dividend screens largely ignored stay-at-home stocks, COVID-19 themes and the like. When the floor dropped out from underneath that stuff in 2022, DLN outperformed the S&P 500 by about 1,000 bps. Our blend Fund, DGRW, saved nearly nine percentage points relative to the S&P in that down market.
THE FED’S QUESTIONABLE IMAGE
Though rate cuts ease the cost of capital on business ventures, the Fed has a reputation for arriving too late to alleviate the pain from each cycle’s systemic bust-up, be it Dot-Com, Lehman, etc.
Four policy easing cycles ago, former Fed Chair Alan Greenspan managed to avoid a potential cataclysm when he started cutting rates in 1998. The hedge fund Long Term Capital Management was blowing up, threatening systemic risk due to its severe leverage. Rate cuts lubricated the system’s gears, perpetuating the market’s bull run, which had been in fast and furious mode since the end of the Gulf War at the beginning of that decade. The S&P 500 made its peak in August 2000. Figure 6 shows the S&P 500 trouncing long-term bonds after Greenspan’s 1998 rate cuts.
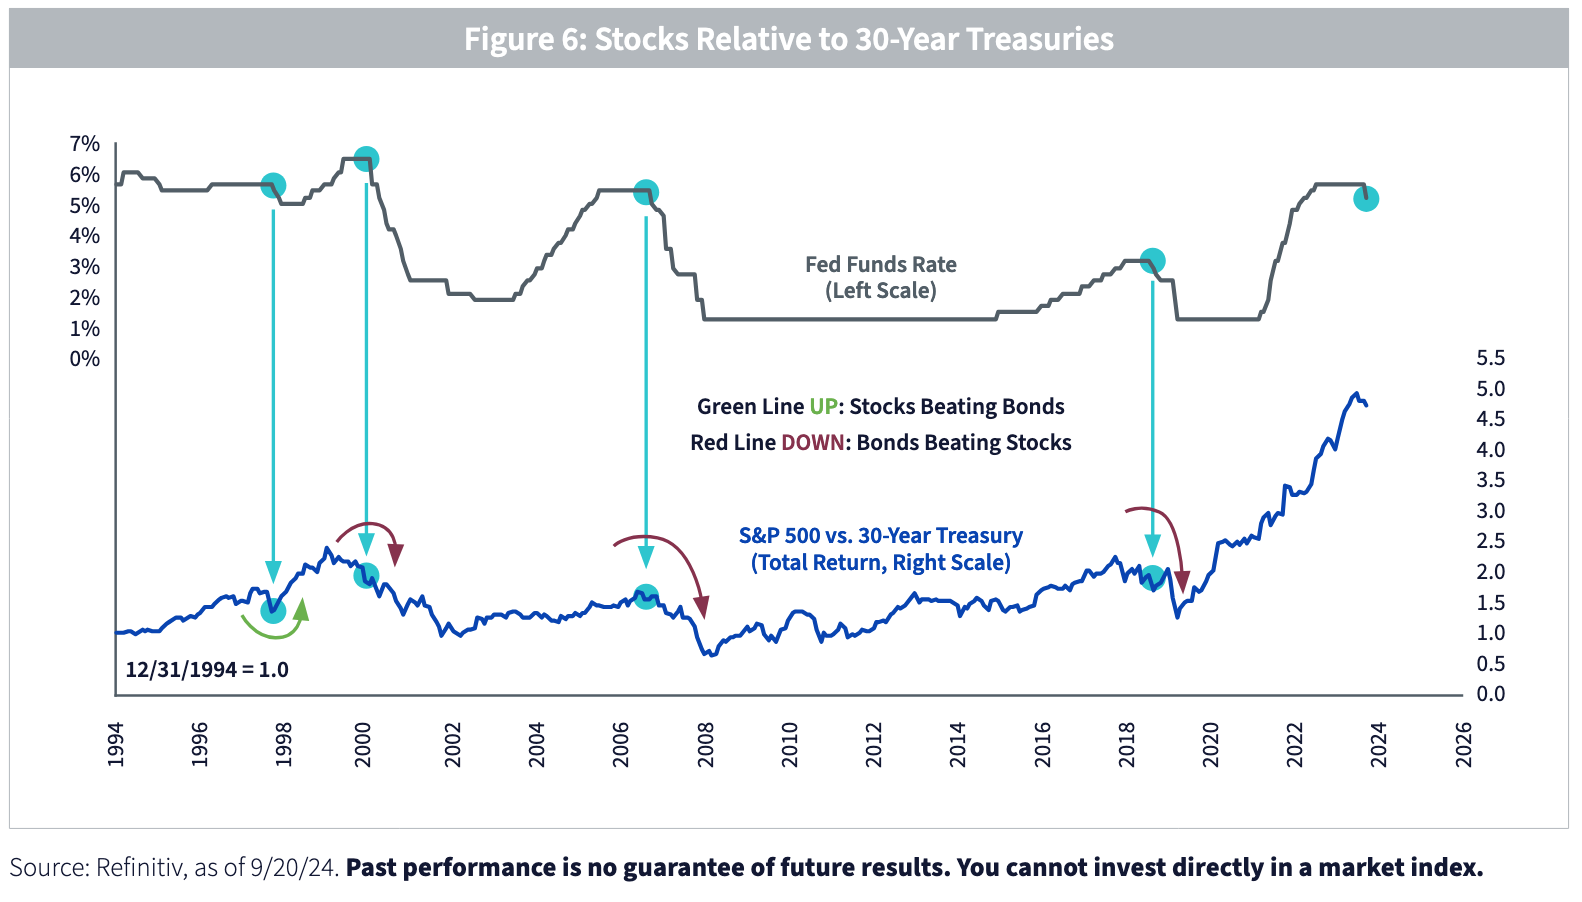 However, the three cycles after that one had no such luck. Greenspan’s next attempt at a magic trick commenced in the opening days of January 2001. It didn’t work. The bear market that had started in 2000 would ultimately persist to October 2002.
The next policy easing was former Fed Chair Ben Bernanke’s attempt to stem severe losses in the 2007–2009 panic. That didn’t work either.
Finally, we will never know the alternate history of 2019–2020, where lockdowns never happened. The market tanked from February to March 2020, just months after Jay Powell’s 2019 rate cuts.
I’ve never been sure how to treat 2020 in the context of Powell’s 2019 actions, but the fact is the Fed did cut rates and the stock market did tank a little while afterward. We have to mark it as three in a row.
SECTORS
The historic record for sector rotation is a mixed bag.
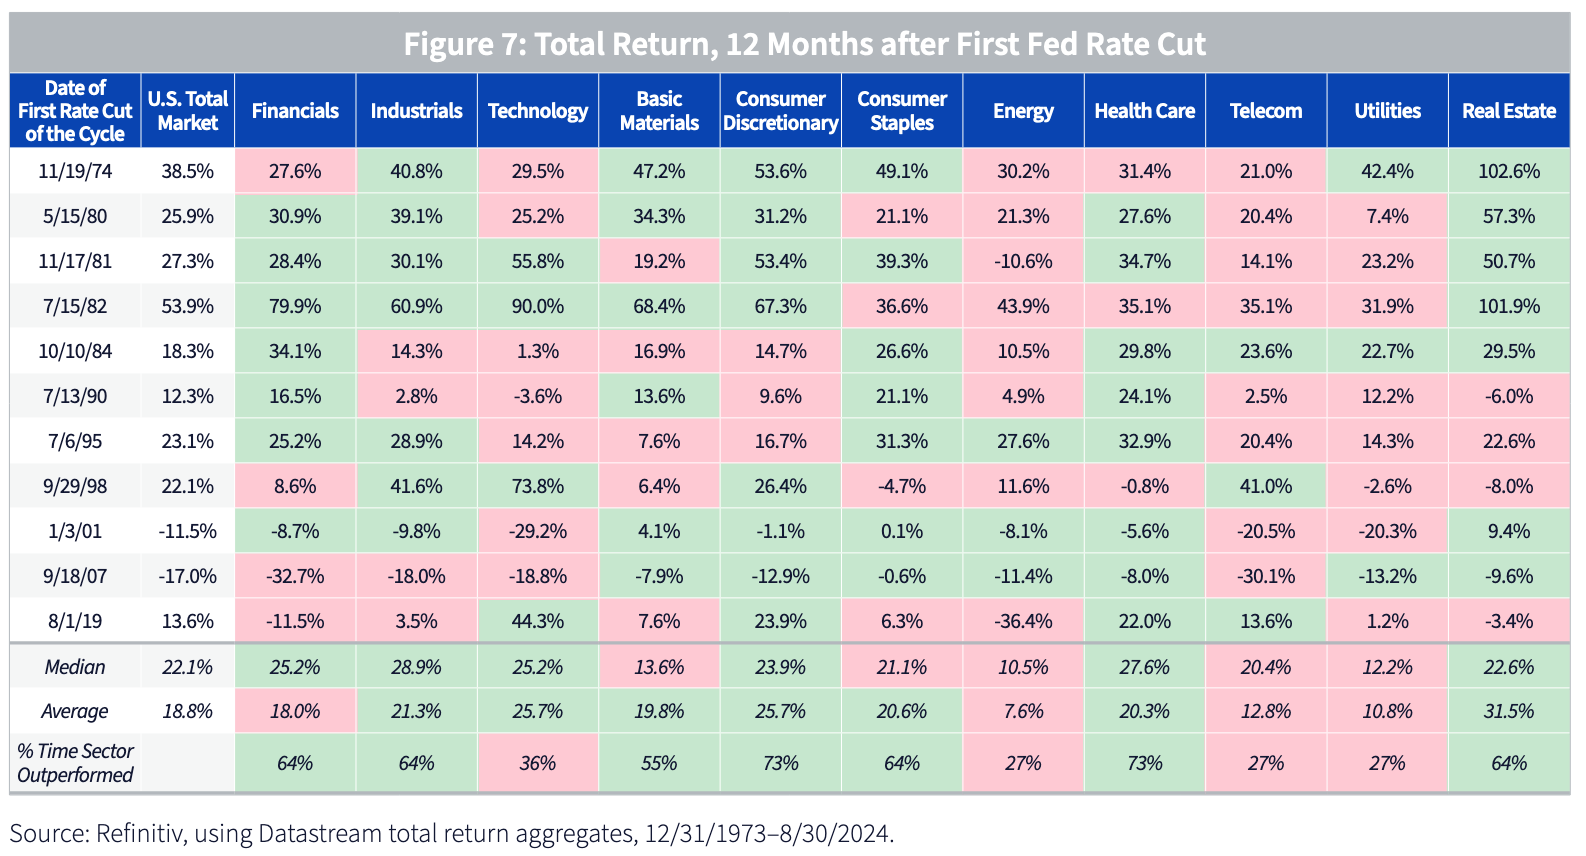
There have been eleven clearly identifiable “first rate cut” dates since the Ford administration (figure 7). In eight of those, Consumer Discretionary and Health Care beat the broad market over the subsequent 12 months.
Of the poor performers, Telecom shows up as having a notoriously awful track record after the Fed’s first cut. However, that sector deserves two asterisks. Firstly, it was part of the notorious “TMT” bubble—Tech, Media and Telecom—at the turn of the century, so maybe we should draw a line through both the post-1998 mania and also the 2001 collapse.
The second asterisk is the evolution of that sector itself. In 2018, Standard & Poor’s added social media and gaming companies to the old Telecom basket, renaming it Communication Services. Now the sector is a hodgepodge of phone companies, video games and dopamine spikes. Keep that in mind as you review the historic record.
The other poorly performing sector is Utilities, which only outperformed in the 12 months after the first cut in three of the 11 cycles.
Of note for this cycle: many investors are treating Utilities as a backdoor play on artificial intelligence (AI) due to the gobbling of electricity by data centers. That makes it a bit of a special situation in this cycle.
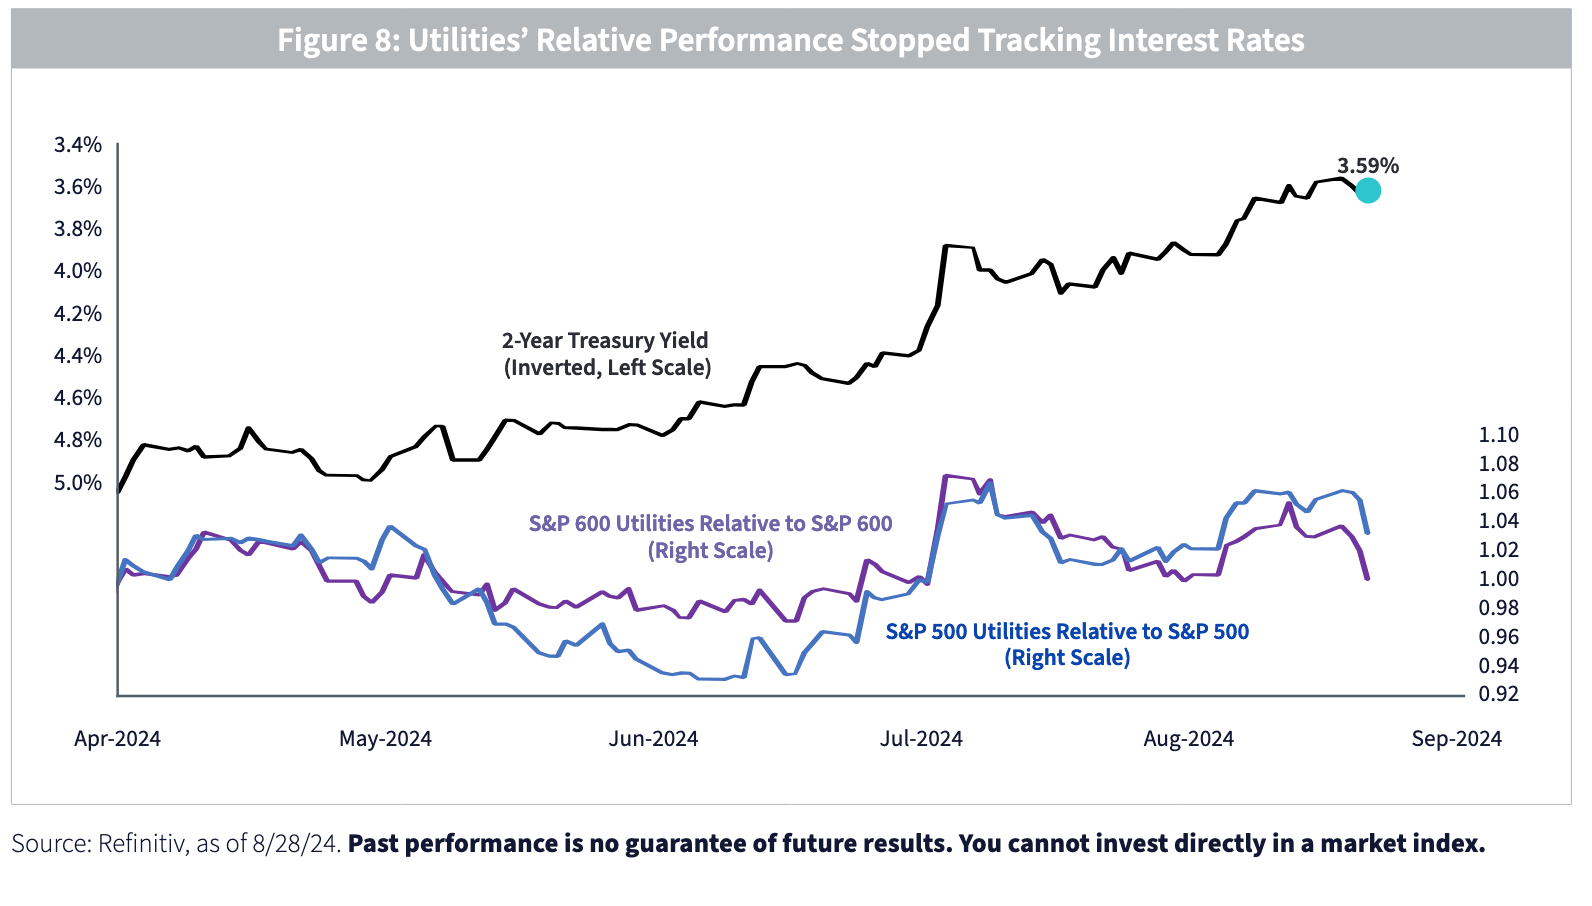
Earlier this summer, Utilities’ relative performance appeared tied at the hip with interest rates. That was especially true after the release of the June CPI report in mid-July, an event that catalyzed a major dump in 2-Year Treasury rates and a furious rally by “utes.” However, recent action has witnessed the sector underperforming. For investors who are looking for a relationship between interest rates and this historically rate-sensitive sector, it’s simply not there at the moment.
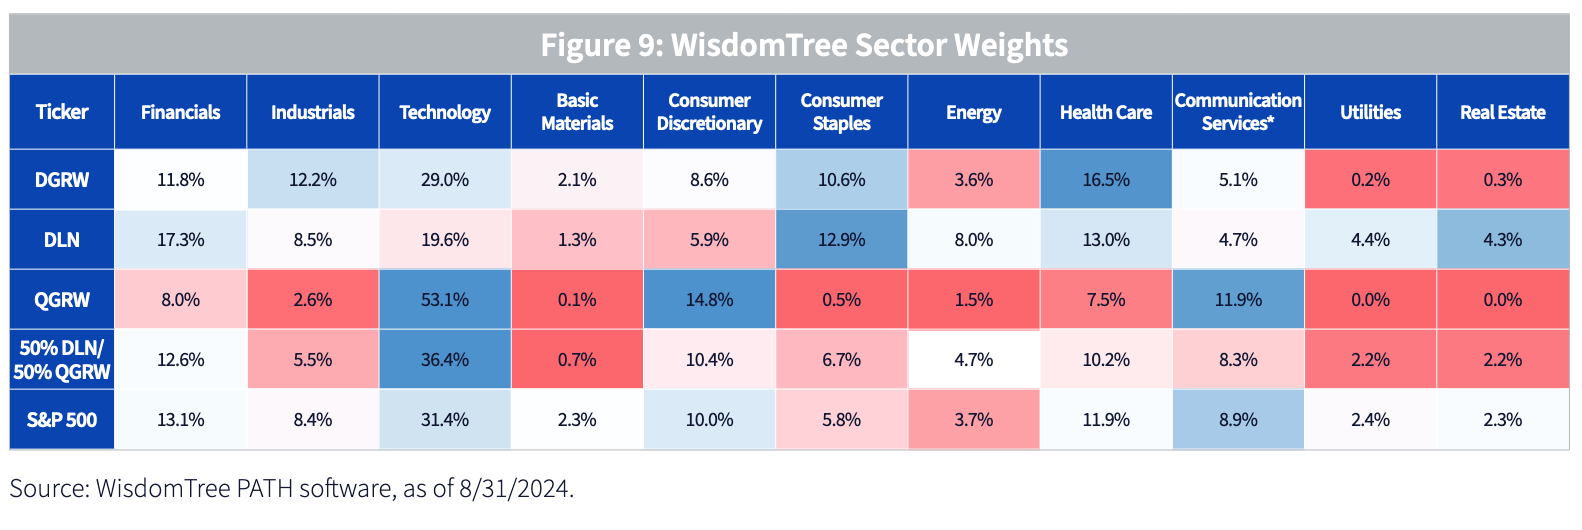
 For readers who have strong sector views, figure 9 can serve as a guide. I added an extra line in the table for the value-and-growth combo that we have seen a bunch of registered investment advisors (RIAs) put on: 50% DLN with 50% QGRW. Call it a DLN-QGRW barbell, which creates a mix that makes sense for investors who do not want to have huge sector biases.
Finally, I spilled a lot of ink talking about downside risks. I want to make sure there is a pure play for the reader who is “on” the Magnificent 7 and who is long and strong the AI theme. Of the three funds in this report, QGRW is clearly the most “NASDAQ-y” of the lot (Figure 10).
In summary, it looks like the market wants to reward stocks of all stripes, as was the case in a couple of the 1990s rate cutting cycles. However, the cycles of this century have a poor track record for stock market performance in the months (and sometimes years) after the Fed’s first set of cuts. In other words, the Fed waited too long in 2001, 2007 and 2019, so we respect the argument that maybe they made the same mistake this time around too.
A DLN-QGRW barbell may be an opportune approach, as the former has developed a reputation for downside resilience. That could pay off if it turns out the Fed has in fact goofed things up. The latter, QGRW, has been our big winner in the post-2022 bull market, stacked as it is with Magnificent 7 members. Combining the two makes for a mix that scores highly on profitability metrics, which I suspect will be of utmost importance if the market catches an adverse economic surprise.
*****
Please see the WisdomTree Glossary for definitions of terms.
IMPORTANT INFORMATION
Investors should carefully consider the investment objectives, risks, charges and expenses of the Fund before investing. For a prospectus or, if available, the summary prospectus containing this and other important information about the Fund, call 866.909.9473 or visit WisdomTree.com/investments. Read the prospectus or, if available, the summary prospectus carefully before investing.
There are risks associated with investing, including the possible loss of principal.
DLN, DGRW: Funds focusing their investments on certain sectors increase their vulnerability to any single economic or regulatory development. This may result in greater share price volatility. Dividends are not guaranteed, and a company currently paying dividends may cease paying dividends at any time.
QGRW: Growth stocks, as a group, may be out of favor with the market and underperform value stocks or the overall equity market. Growth stocks are generally more sensitive to market movements than other types of stocks. The Fund is non-diversified, as a result, changes in the market value of a single security could cause greater fluctuations in the value of Fund shares than would occur in a diversified fund. The Fund invests in the securities included in, or representative of, its Index regardless of their investment merit. The Fund does not attempt to outperform its Index or take defensive positions in declining markets and the Index may not perform as intended.
USIN: Because the Fund is new, it has limited performance history. U.S. Treasury obligations may provide relatively lower returns than those of other securities. Changes to the financial condition or credit rating of the U.S. government may cause the value to decline. Fixed income securities are subject to interest rate, credit, inflation, and reinvestment risks. Generally, as interest rates rise, the value of fixed income securities falls.
Please read each Fund’s prospectus for specific details regarding each Fund’s risk profile.
Diversification does not ensure gains or guarantee protection against losses.
You cannot invest directly in an index.
The Global Industry Classification Standard (“GICS”) was developed by and is the exclusive property and a service mark of MSCI Inc. (“MSCI”) and Standard & Poor’s (“S&P”), a division of The McGraw-Hill Companies, Inc., and is licensed for use by WisdomTree, Inc. Neither MSCI, S&P nor any other party involved in making or compiling the GICS or any GICS classifications makes any express or implied warranties or representations with respect to such standard or classification (or the results to be obtained by the use thereof), and all such parties hereby expressly disclaim all warranties of originality, accuracy, completeness, merchantability and fitness for a particular purpose with respect to any such standard or classification. Without limiting any of the foregoing, in no event shall MSCI, S&P, any of their affiliates or any third party involved in making or compiling the GICS or any GICS classifications have any liability for any direct, indirect, special, punitive, consequential or any other damages (including lost profits), even if notified of the possibility of such damages.
Neither MSCI nor any other party involved in or related to compiling, computing or creating the MSCI data makes any express or implied warranties or representations with respect to such data (or the results to be obtained by the use thereof), and all such parties hereby expressly disclaim all warranties of originality, accuracy, completeness, merchantability or fitness for a particular purpose with respect to any such data. Without limiting any of the foregoing, in no event shall MSCI, any of its affiliates or any third party involved in or related to compiling, computing or creating the data have any liability for any direct, indirect, special, punitive, consequential or any other damages (including lost profits), even if notified of the possibility of such.
WisdomTree Funds are distributed by Foreside Fund Services, LLC.


