by Denise Chisholm, Director of Quantitative Market Strategy, Fidelity Investments
These indicators have historically been bullish for equities.
Key takeaways
- The stock market has often seen double-digit returns when the Fed is cutting interest rates, but it depends on what is motivating the Fed's moves.
- Today, we know earnings have been positive and accelerating, and that has historically been very positive for stocks.
- We also know that both leading economic indicators and bank willingness to lend have been picking up, and this, too, historically bodes well for the stock market.
As much as investors would like a playbook for rate cuts, there just isn’t one. Historically, the year following a first rate cut has sometimes been rocky for markets, but about half the time, it has resulted in double-digit returns.
The difference between the positive years and the rocky ones isn’t a function of what the Fed does, but rather why it’s doing it.
When the Fed cuts its benchmark interest rate, it’s usually for one of two reasons:
- Because economic growth is faltering, and lower rates may help support it. This is what happened during the financial crisis in 2008 and the pandemic in 2020.
- Because higher rates have done their job of bringing down inflation, so the Fed can recalibrate its policy.
When the Fed cuts rates because it can—to recalibrate policy—rather than because it has to—to support the economy—this has been historically bullish for stocks. Fortunately for investors, I believe that’s exactly the scenario we may be in currently—despite recent market pullbacks fueled by fears of slowing growth.
While the labor market has shown signs of softening, unemployment is still low. Despite lower-than-expected jobs growth in August, unemployment fell to 4.2%. Meanwhile, inflation fell to 2.9% in July, down from a recent high of 9.1% in 2022.
Here are a few more indicators that are bullish for equities.
1. Earnings growth
Historically, falling interest rates have provided a slight boost to the market, but it’s earnings growth that really matters. When earnings are positive and growing, that’s bullish for stocks. Although data can always change, that’s where we are now.
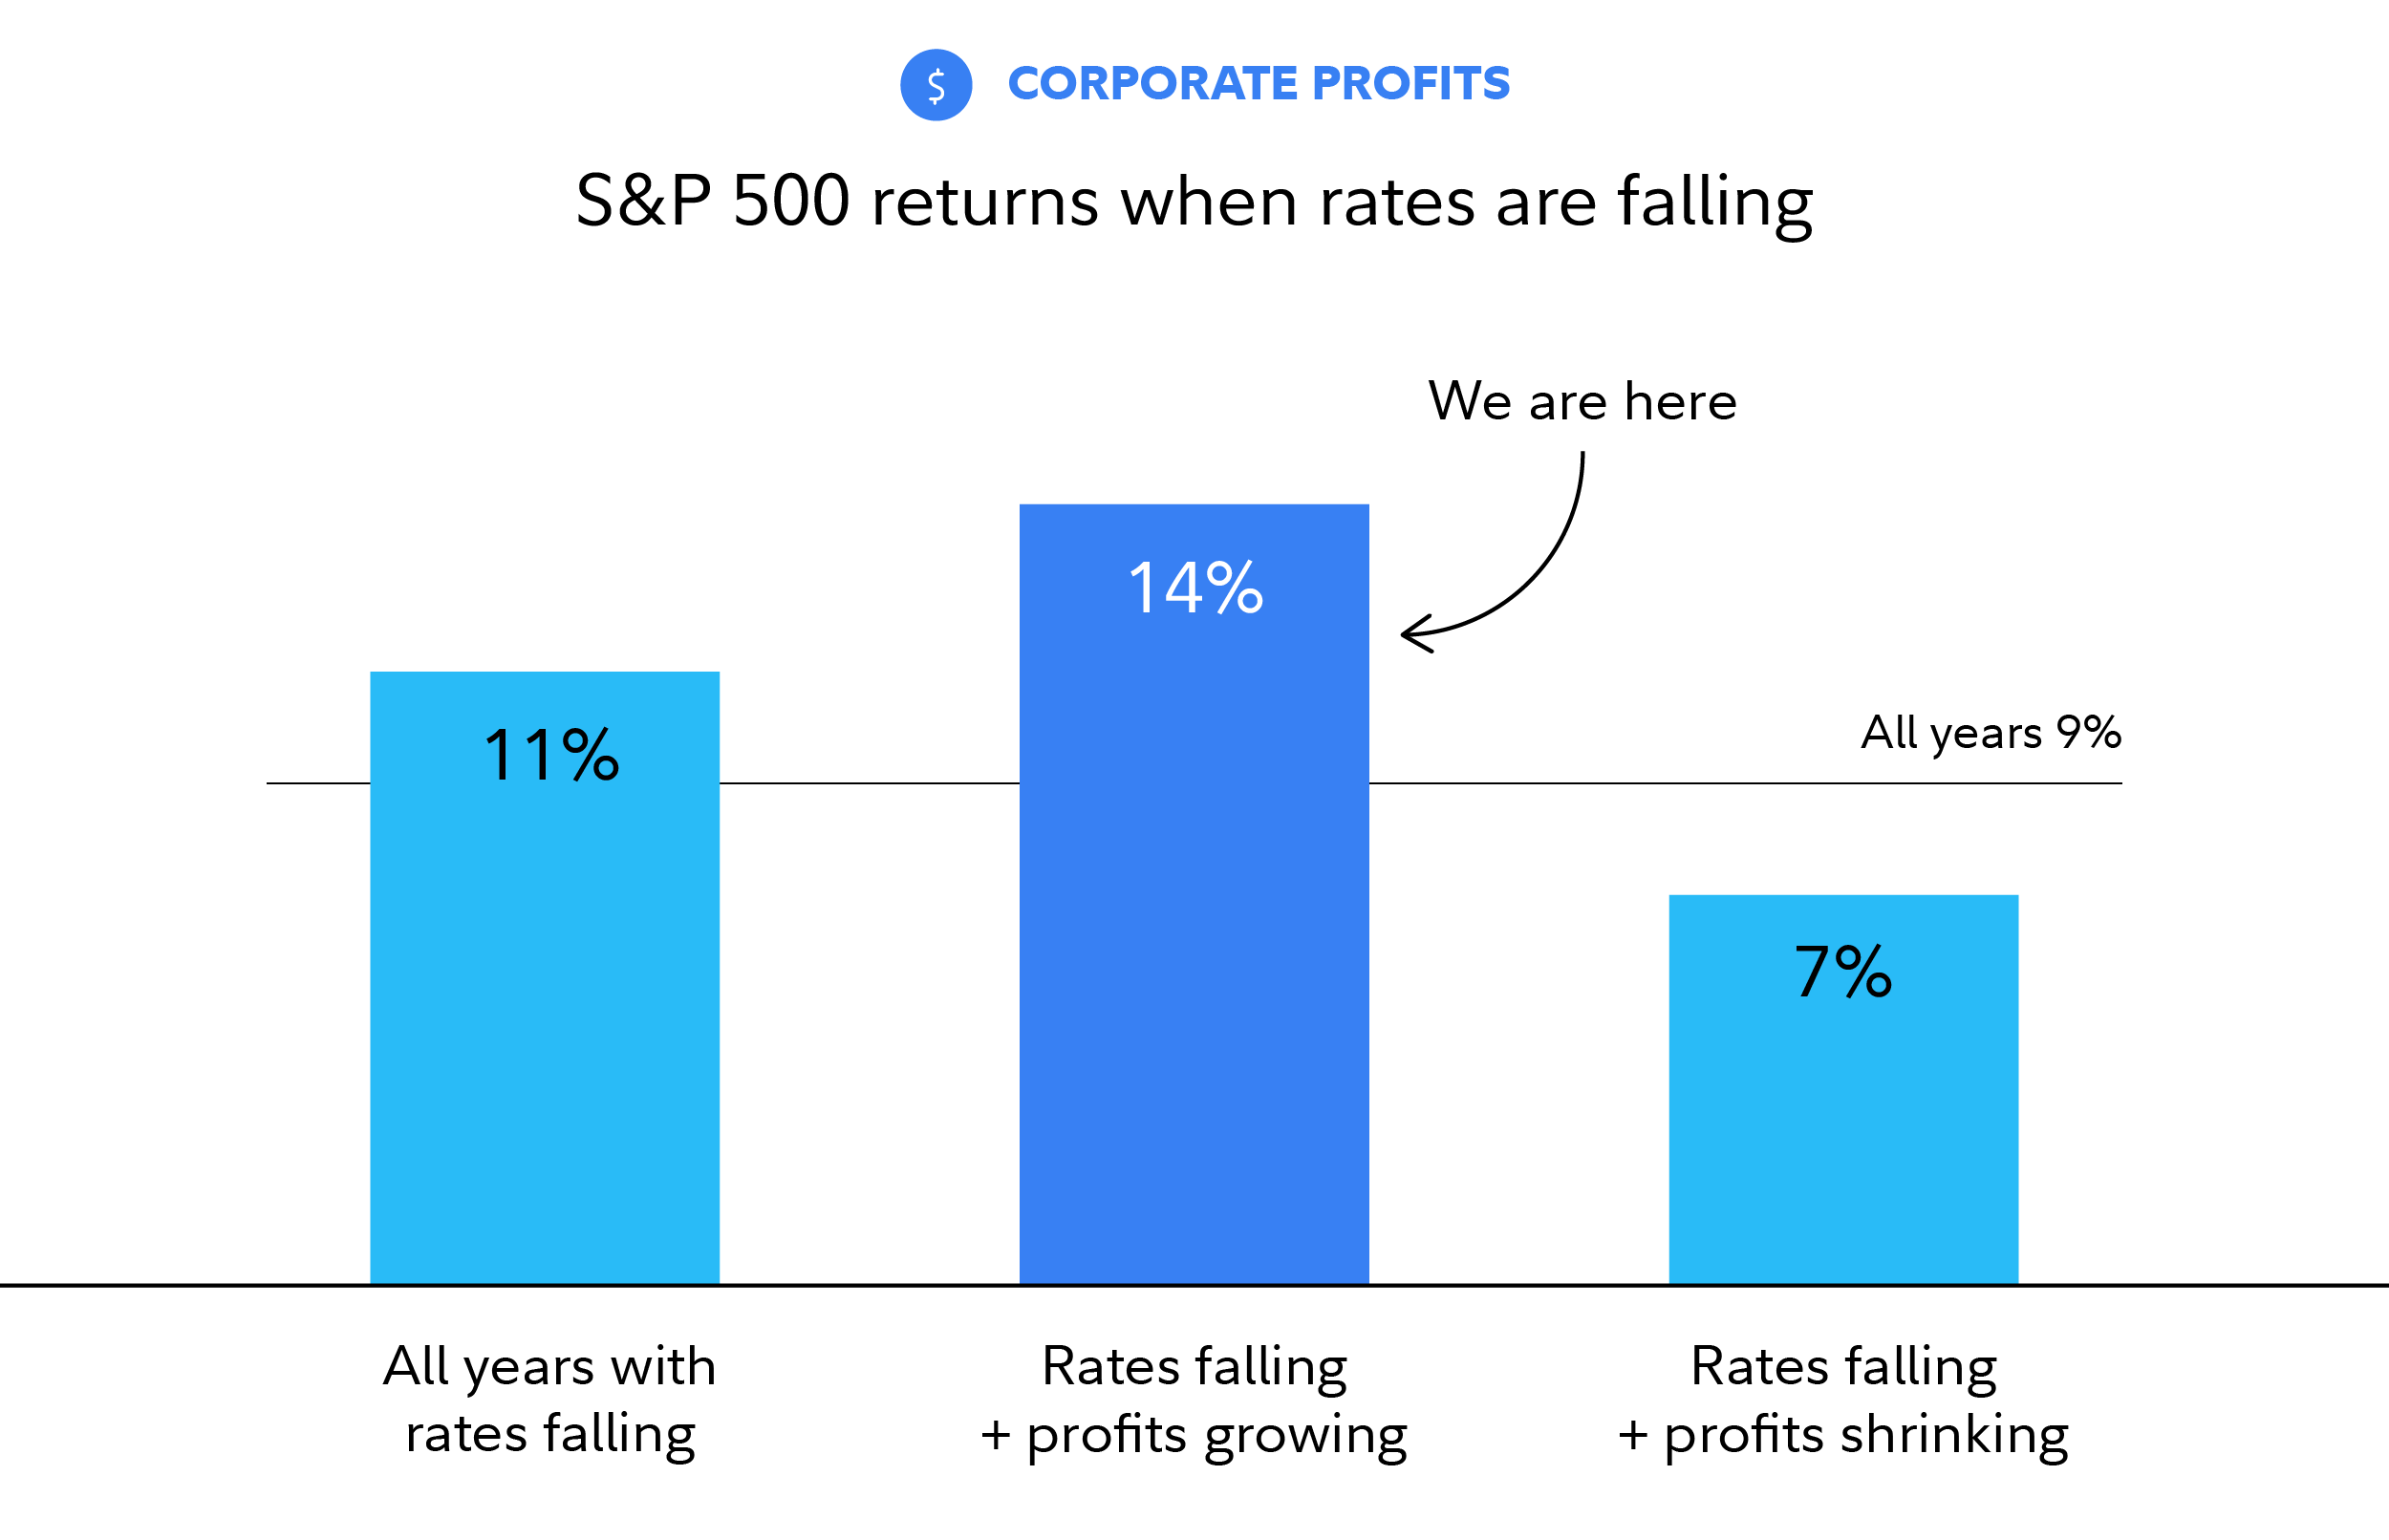 Past performance is no guarantee of future results. Analysis based on the S&P 500. Sources: Haver Analytics and Fidelity Investments, as of Aug. 30, 2024. Falling rates refers to 1-year Treasury yields, analyzed on a rolling 12-month basis since January 1962.
2. The level of interest rates vs. inflation
Strong earnings growth isn’t the only differentiator this cycle; the level of rates compared with inflation is another. The higher the starting point of short-term interest rates versus inflation, the bigger the market return has been the following year.
This metric offers a way of capturing the potential firepower of Fed policy—in other words, if the Fed needed to cut rates further, would it be able to? The current starting point—with a fed funds target rate of 5.25%–5.50% but inflation lower than 3%—has historically been a positive mix for the stock market.
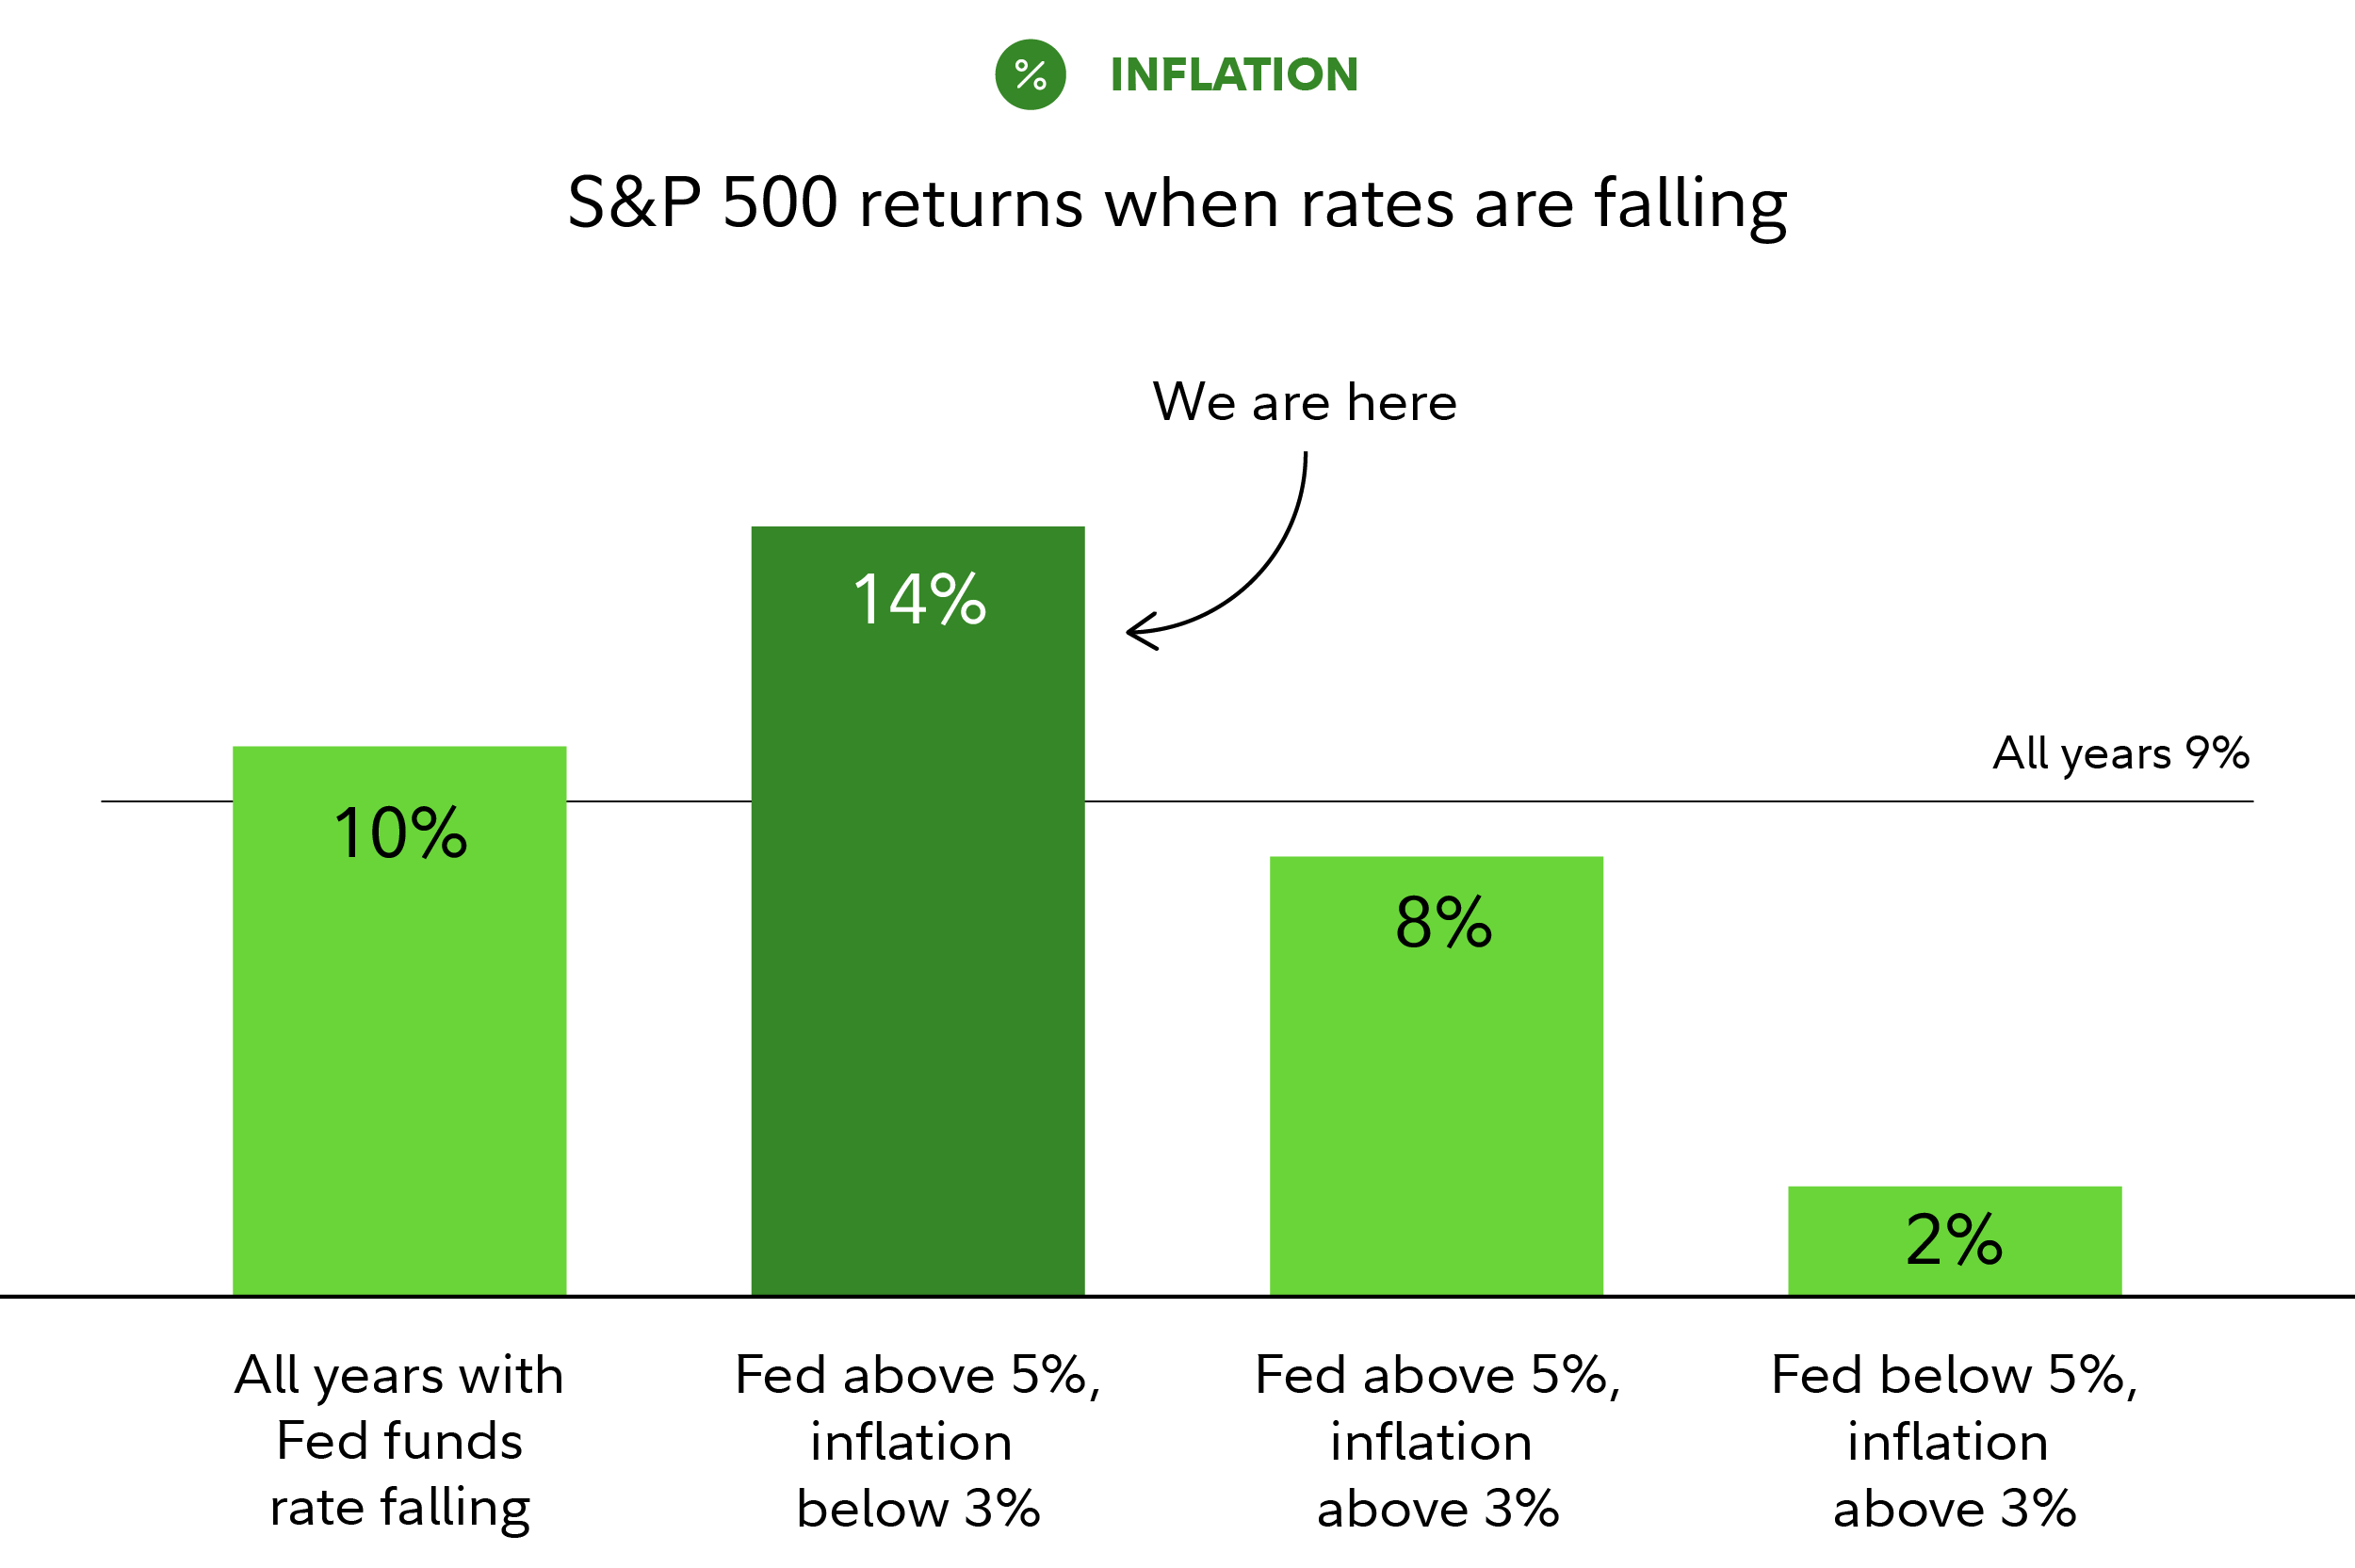 Past performance is no guarantee of future results. Analysis based on the S&P 500. Sources: Haver Analytics and Fidelity Investments, as of Aug. 30, 2024. Fed funds rate refers to the effective fed funds rate, analyzed on a rolling 12-month basis since January 1962.
3. Leading economic indicators and bank lending standards
Is earnings growth going to continue? There are a couple of statistical tailwinds that might not be good, but may be “good enough.”
Two critical factors—leading economic indicators (LEIs) and bank willingness to lend—fit the bill. Both of these indicators give clues about what's coming down the pipeline for the economy. While neither is currently strong, both are improving. Right now, they also help make this impending rate cut cycle look different, and that difference has mattered historically to equity markets when the Fed is cutting rates.
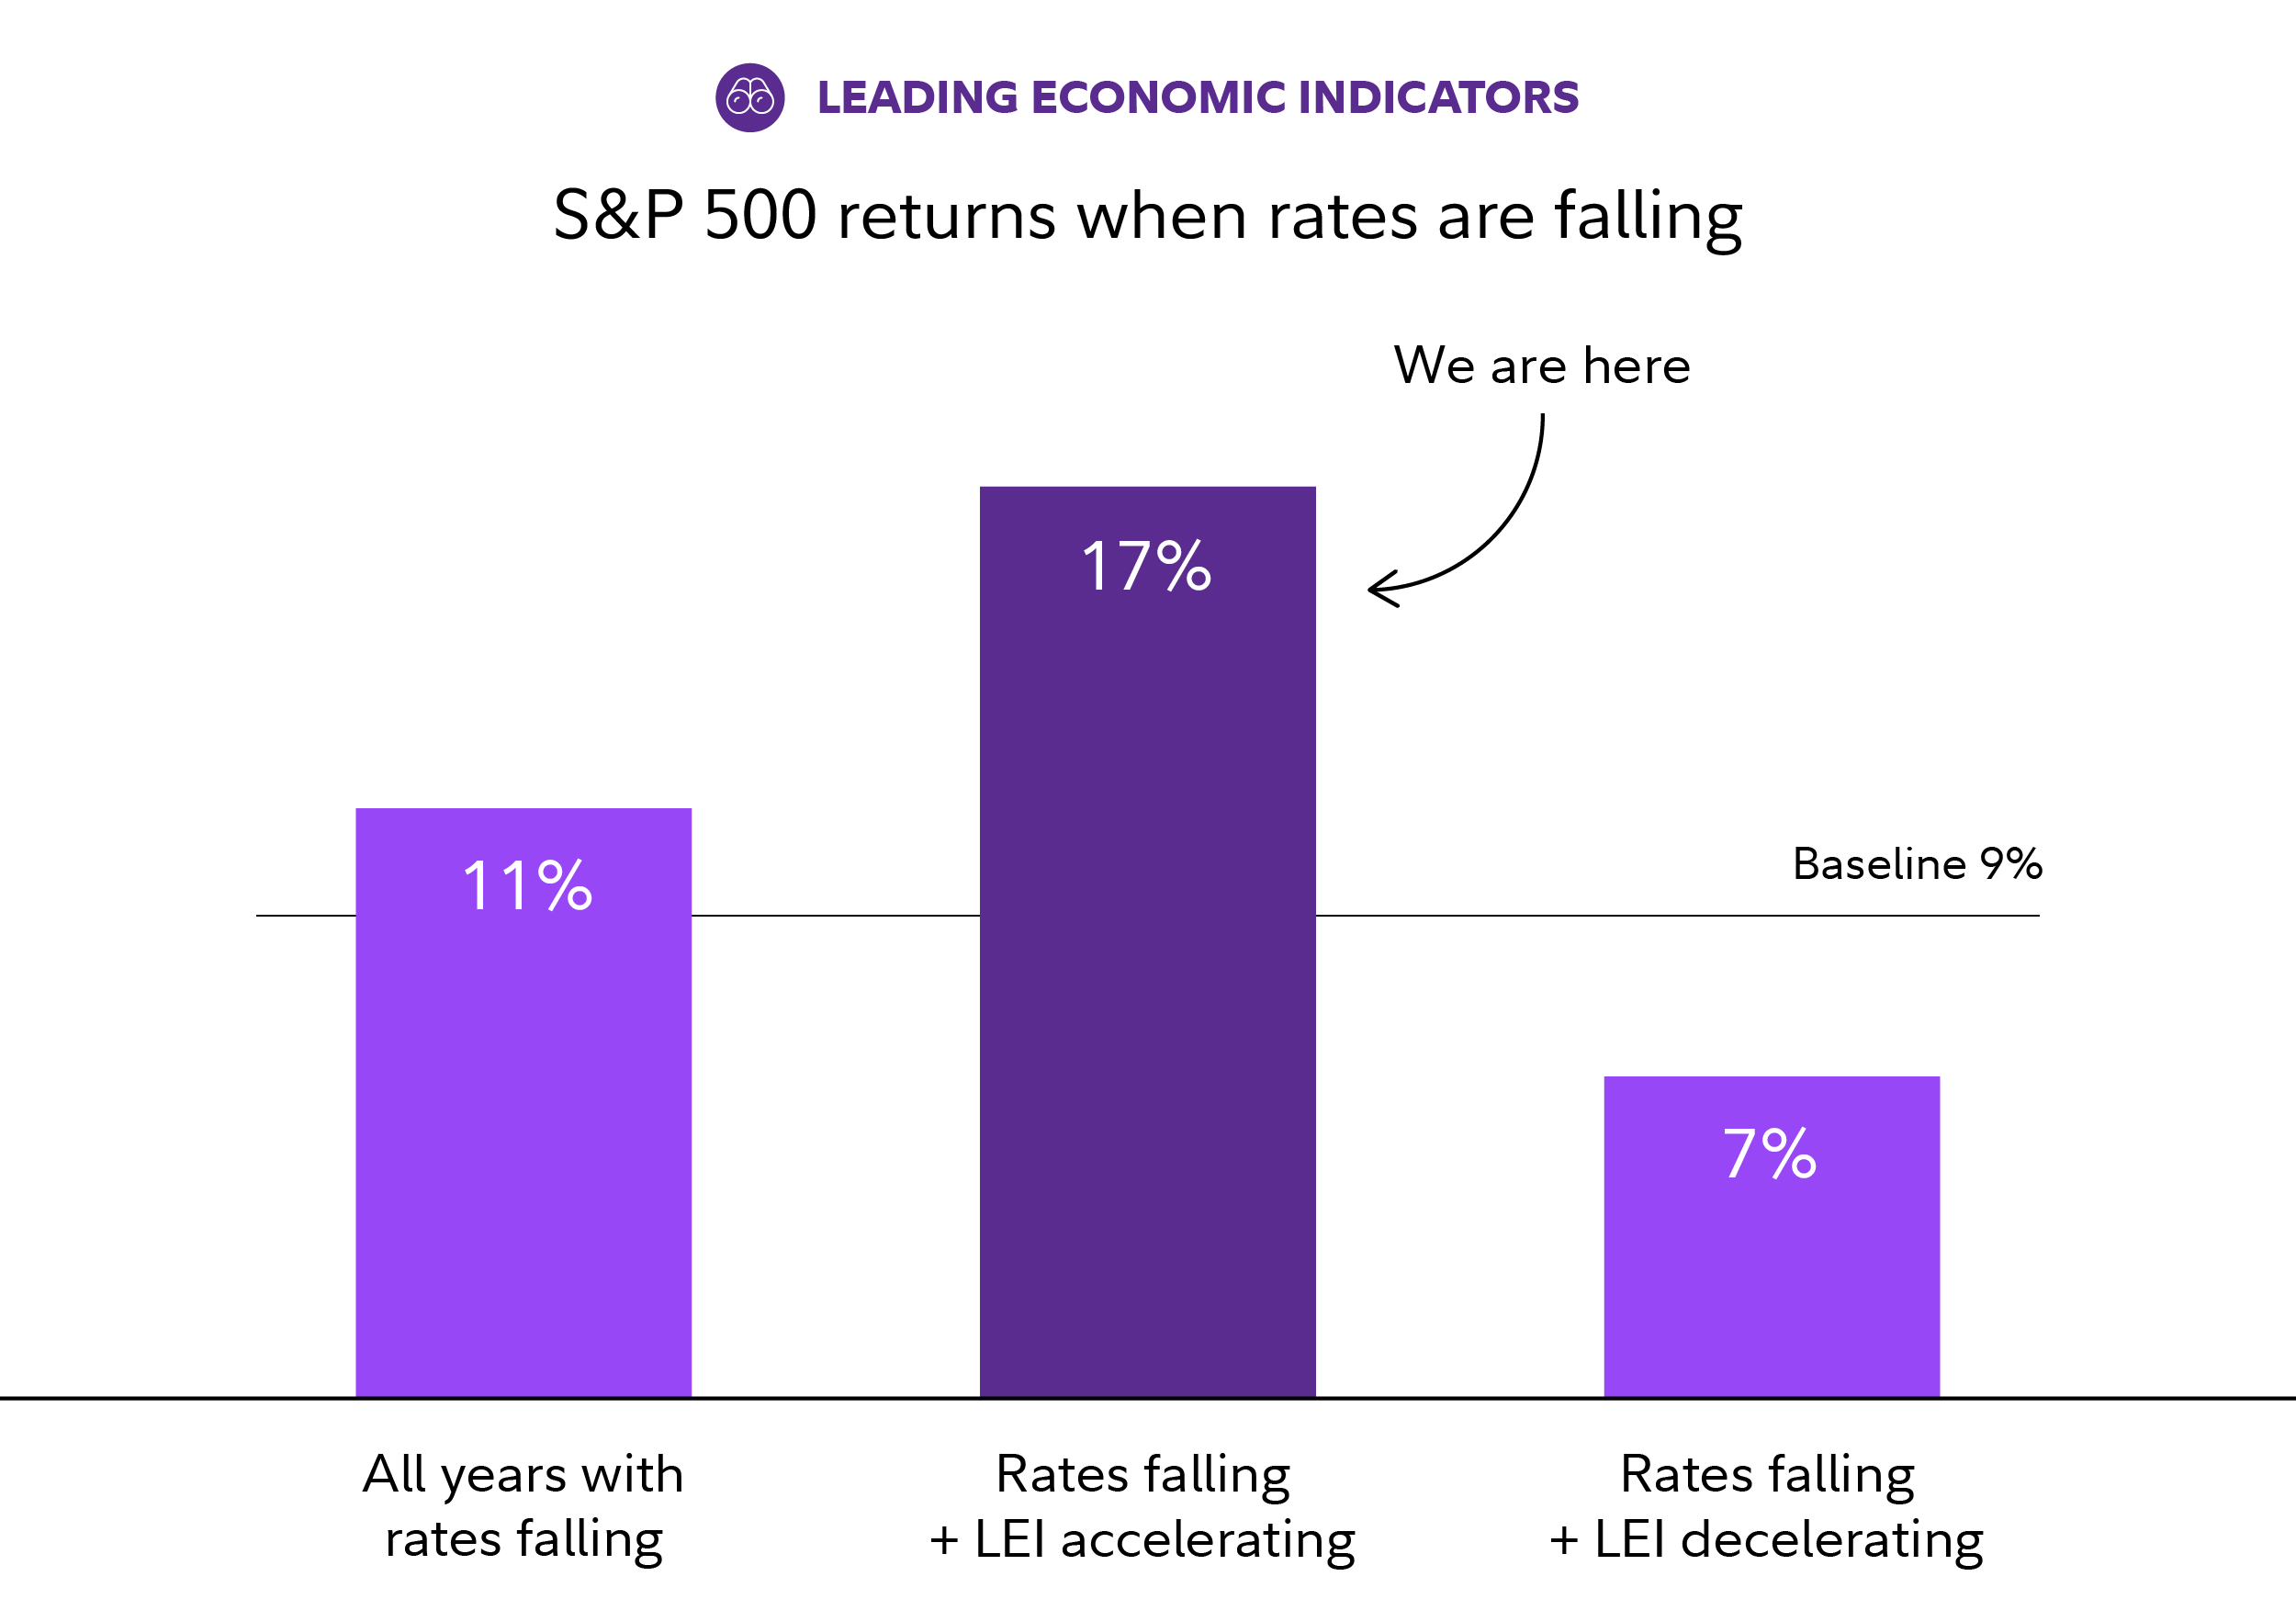
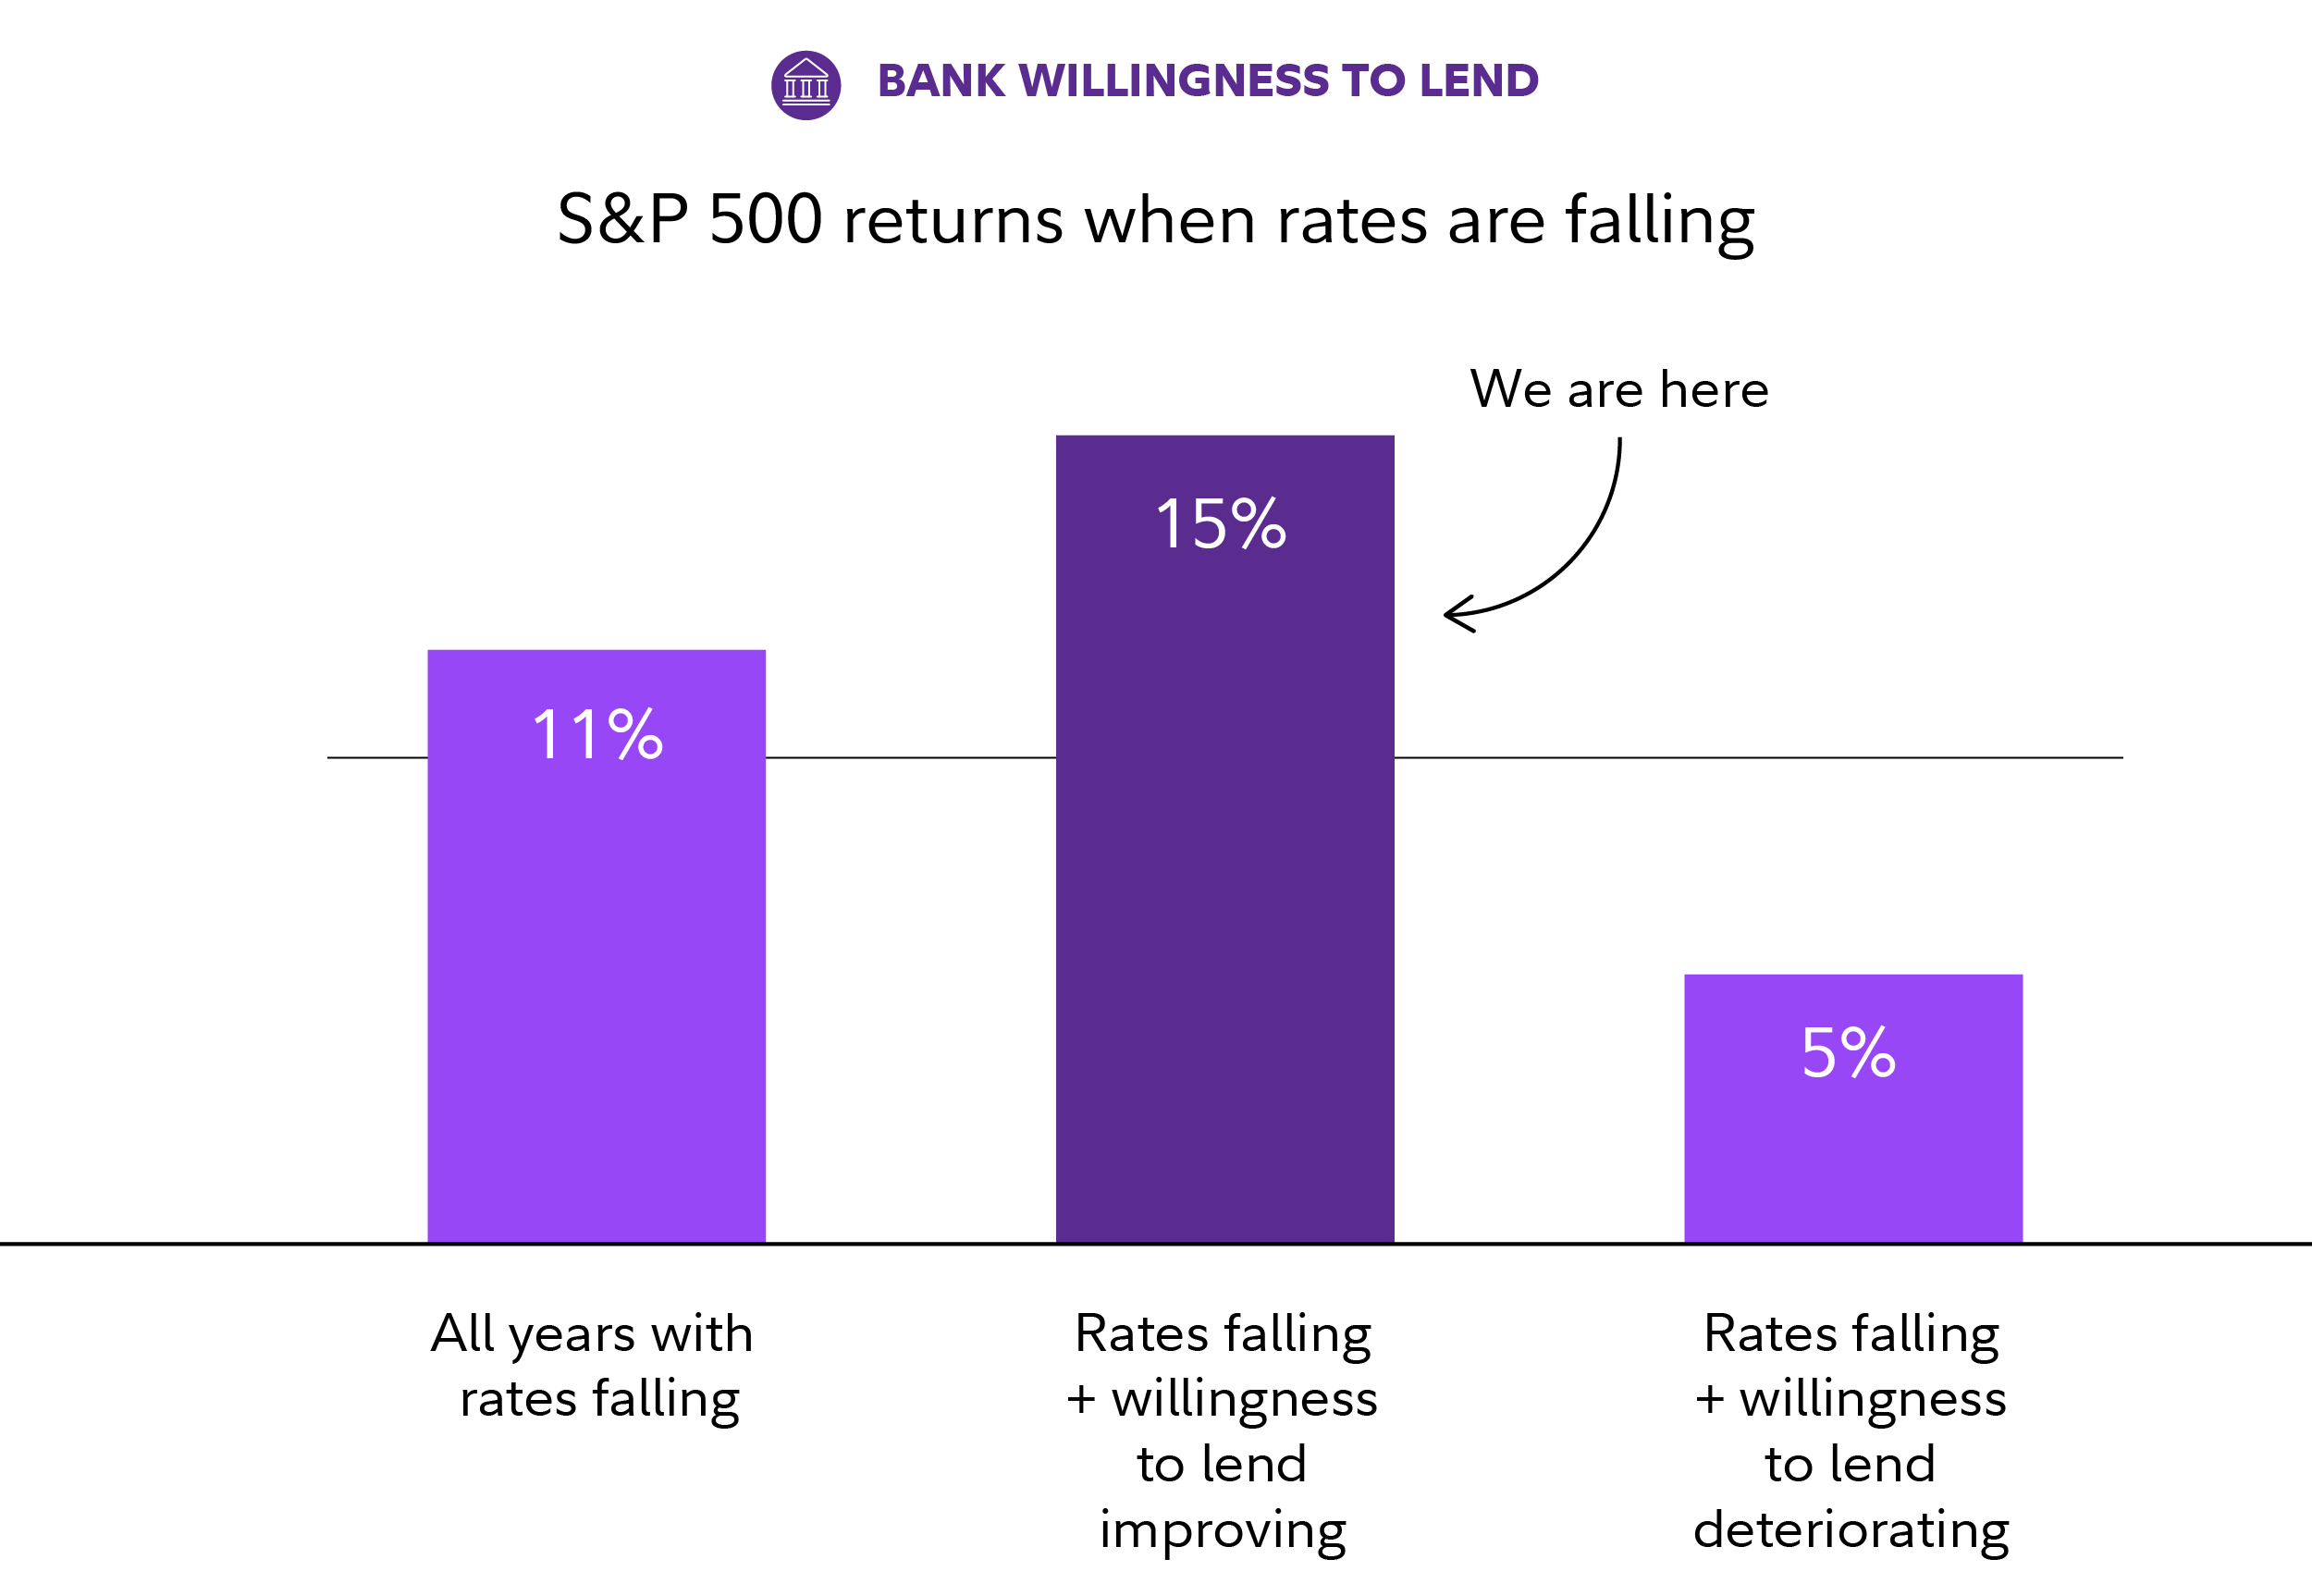 Past performance is no guarantee of future results. Analysis based on the S&P 500. Sources: Haver Analytics and Fidelity Investments, as of Aug. 30, 2024. Falling rates refers to 1-year Treasury yields, analyzed on a rolling 12-month basis since January 1962.
Bottom line: The Fed’s first rate cut isn’t what should drive the market going forward. But if you put rate cuts into context with other economic indicators that have mattered historically, I believe it starts to look like a positive environment for stock returns over the next year.
Copyright © Fidelity Investments


