by Wylie Tollette, CIO, and Team, Franklin Templeton Investment Solutions
Franklin Templeton Investment Solutions examines whether equity market concentration is a signal to reduce portfolio risk and if it makes sense to rotate within equities.
The market backdrop
As equities continue to march higher, market concentration has been the source of investor anxiety. This follows a first half of the year in which just two sectors (information technology and communication services) outperformed the market-cap weighted S&P 500, while the Index returned over 15%.1 This unusual market backdrop has been driven by the soaring performance and profitability of the Magnificent Seven2—about 2/3 of the S&P 500’s first-half returns are due solely to this group.
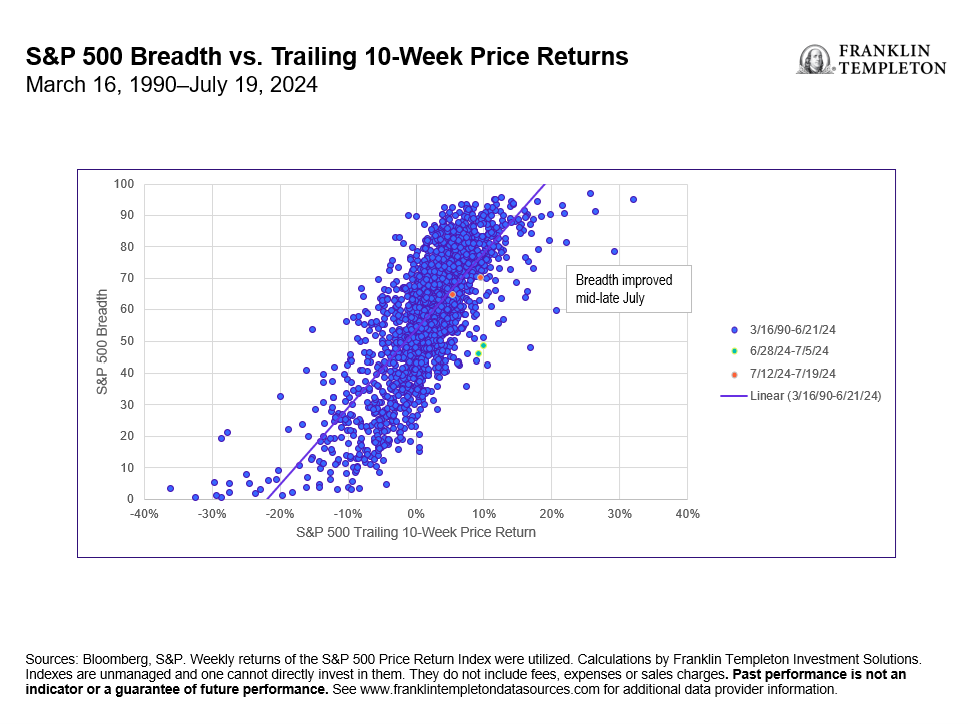
As depicted in Exhibit 1 below, there is typically a positive correlation between market breadth and returns, although this has been challenged as relatively low breadth has characterized the most recent market rally from mid-June to early July. Lately, breadth has improved dramatically as another weak US inflation print and dovish Fedspeak caused a strong internal equity rotation. For instance, small cap stocks outperformed the S&P 500 by 10.9% over the trailing two-week period (as of July 23, 2024), the highest two-week outperformance since December 1978.3
Exhibit 1: Market Breadth Sees a Return to Normal in Mid-July

Asset allocation strategy considerations
Although trailing performance and breadth measures have normalized, a few important questions arise: first, is the equity-market concentration a signal to de-risk portfolios? We find little evidence that heightened equity-market concentration is associated with weaker future market returns. There have been a handful of corollaries over the last 60 years in which bull markets have likewise been led by a handful of names (recently in 2011, 2015, 2020 and 2023). On average, returns in the year following have been little changed from long-run average equity returns.
Likewise, average, or even outright weak, S&P 500 breadth hasn’t historically portended subsequent weak returns, so long as equity momentum remains positive. We have also recently seen breadth improving across the US equity market—over the last few weeks, the percentage of S&P 500 constituents trading above the 50-day moving average has spiked from 47% on July 8, 2024, to 70% on July 22, 2024. Historically, strong upticks in market breadth have shown to be positive catalysts for equity outperformance.
Another important question that has arisen is whether this an opportune time to rotate out of this year’s leaders and into its laggards. Given our constructive macro view, we believe that there is room for some of the first half’s laggards to post better performance over the next six months. Macroeconomic growth remains at trend and we see little risk of recession in the near term. This setting is also accompanied by a normalization in inflation and policy, which should help insulate the economy. For a year-to-date laggard like the small-cap segment, high interest rates have been a problem given their debt exposure dynamics—namely, lower credit quality and higher exposure to floating/short-term fixed rate financing. In our analysis, the interest-rate outlook is more constructive, for now, which has acted as a tailwind over the last week.
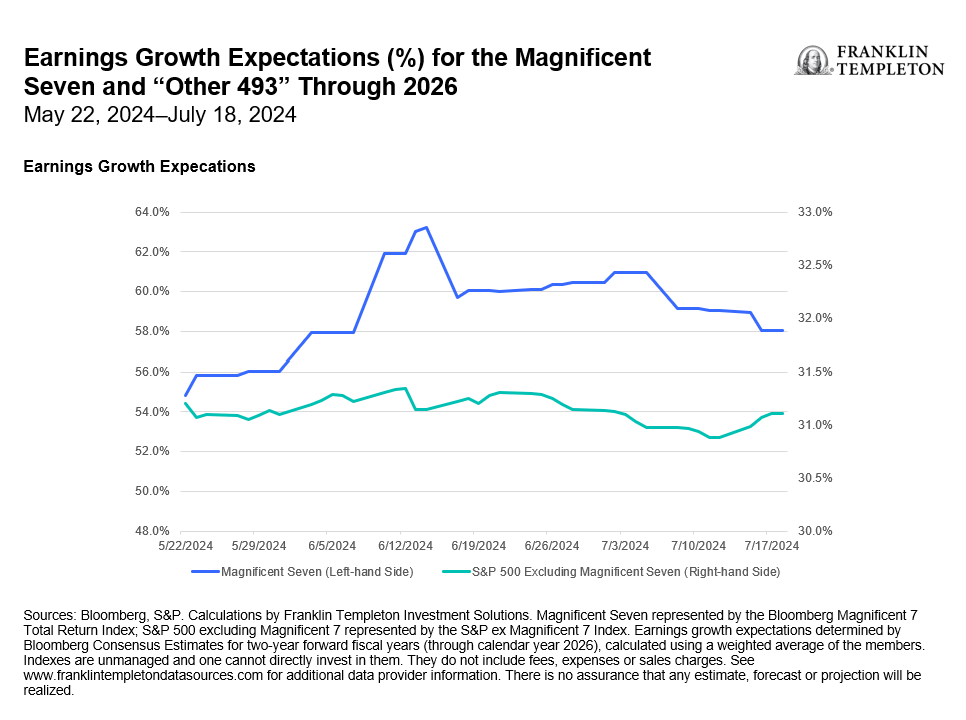
Conversely, we believe it has been nothing short of a fool’s errand to try to call a peak for the Magnificent Seven. There are good reasons for their resilience—many of the business models have high barriers to entry. Booming sales growth and/or profits aren’t leading to new market entrants competing away profits. However, one area that is catching our attention is the rising earnings expectations relative to the rest of the market. As evidenced by Exhibit 2 below, investors continue to price in a hefty return on investment for their artificial intelligence (AI)-related capital expenditures. Two years from now, investors expect 60% earnings growth from the Magnificent Seven vs. 31% growth from the rest of the market. It remains to be seen whether these lofty expectations are attainable.
Exhibit 2: Expectations Are High for the Magnificent Seven

Putting it all together
The market setup in the first half of the year was unique given a high index concentration, all-time-high stock prices and weakening breadth. Importantly, breadth has surged recently and is now in-line with equity-market performance. In our opinion, the market backdrop is no longer “out of whack.”
We do not view the current setup as a time to get more defensive. We find limited evidence that market concentration is a bearish signal. Instead, we see greater evidence that improving breadth and strong price momentum suggests portfolios should not become too defensive. Our outlook remains neutral.
Some of this year’s laggards, such as small caps, have a positive skew given that the growth environment remains firm and inflation and interest rates are declining. We hold a neutral view toward this year’s leaders, such as the Magnificent Seven, while acknowledging the risk of high earnings expectations for the group and the market more broadly.
Footnotes:
1 Source: Bloomberg, S&P. Indexes are unmanaged and one cannot directly invest in them. They do not include fees, expenses or sales charges. Past performance is not an indicator or a guarantee of future performance. See www.franklintempletondatasources.com for additional data provider information.
2. Alphabet (parent company of Google), Amazon, Apple, Meta (formerly Facebook), Microsoft, Nvidia and Tesla. These stocks were dubbed the Magnificent Seven in 2023 for their strong performance and resulting increased index concentration in recent years.
3. Sources: Bloomberg, S&P, Russell. Small cap stocks are defined by the Russell 2000 Index. The Russell 2000 Index is a small-cap US stock market index that makes up the smallest 2,000 stocks in the Russell Index. Indexes are unmanaged and one cannot directly invest in them. They do not include fees, expenses or sales charges. Past performance is not an indicator or a guarantee of future performance. See www.franklintempletondatasources.com for additional data provider information.
Copyright © Franklin Templeton Investment Solutions


