by John Lynch, CIO, & Team, Comerica Wealth Management
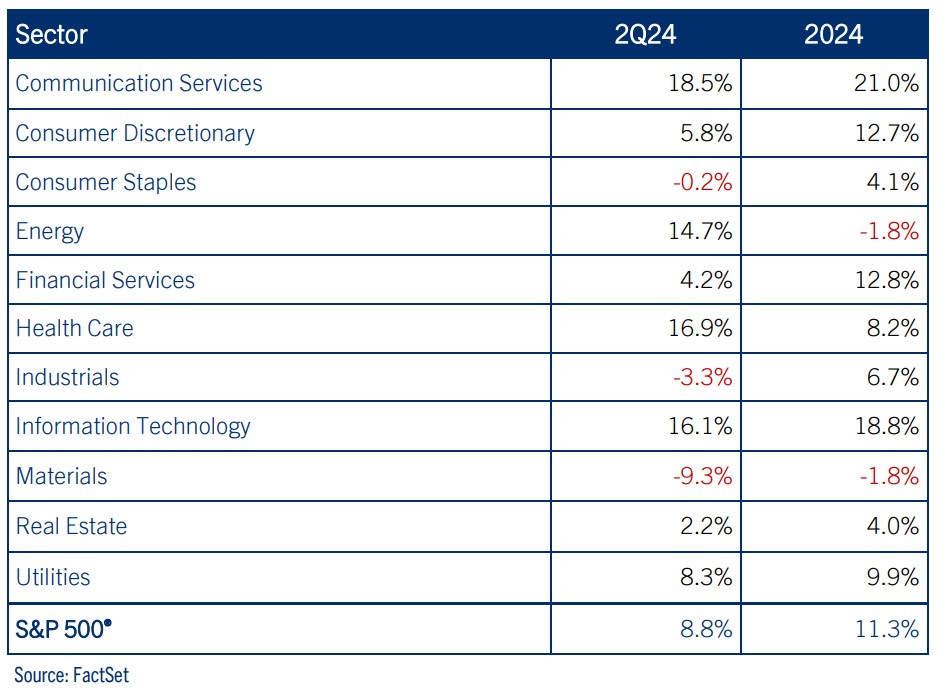
Companies in the S&P 500® are projected to deliver second quarter earnings per share (EPS) growth of 8.8% year-over-year (YOY) according to data from FactSet.
Annual sales growth is estimated to climb by 4.6% for the period ending June 30th, with net profit margins continuing to hover in the 12.0% range for the Index.
Executive Summary
- S&P 500® profit growth appears solid, with eight of the 11 sectors expected to grow EPS YOY. A deeper look into profitability reveals the rather weighty impact that the Magnificent Seven is having on profitability, too.
- The leading sectors contributing to 2Q24 Index profitability include Communications Services, Health Care and Technology. Removing 1-2 leading companies in EPS calculations results in a significant decline in each sector’s YOY profit growth.
- We continue to look for companies in the S&P 500® Index to deliver profit growth in the 8.0% range this year, despite the consensus projection for 11.3%.
We remain concerned that the fourth quarter projection of ~+17.0% EPS YOY remains too lofty, though we’re hopeful to hear strong guidance during second quarter earnings calls next month. If that’s the case, we’ll review our call for the S&P 500® to generate $237.50 in Index EPS for 2024.
Download the Weekly Market Update
Earnings Preview
Companies in the S&P 500® are projected to deliver second quarter earnings per share (EPS) growth of 8.8% year-over-year (YOY) according to data from FactSet.
This compares favorably to the +5.9% YOY pace achieved during the first quarter, which came in above consensus expectations of 3.4% at the end of March. In addition, profit momentum continues to gain traction after the ~1.0% YOY gain for all of 2023.
Annual sales growth is estimated to climb by 4.6% for the period ending June 30th, with net profit margins continuing to hover in the 12.0% range for the Index. To be sure, companies continue to manage costs efficiently, despite the increase in interest rates.
Sectors
S&P 500® profit growth appears solid, with eight of the 11 sectors expected to grow EPS YOY. A deeper look into profitability reveals the rather weighty impact that the Magnificent Seven is having on profitability, too.

Consistent with its sector-leading year-to-date (YTD) market performance, the Communications Services sector is positioned for the highest profit gain of 18.5% YOY for the second quarter, driven higher by industries including Entertainment, Interactive Media and Wireless Telecom.
Similar to the outsized effect that “Big Tech” has had on market returns, specific large cap companies are impacting profit growth as well. Indeed, FactSet reports that if the EPS growth from Meta Platforms and Alphabet were excluded from the calculation, the Communication Services sector’s YOY profit growth would decline from +18.5% to just 3.3% YOY.
Health Care is projected to deliver the second highest EPS growth of 16.9% YOY, driven higher by the pharmaceuticals industry (+70.0%). In this instance, if Merck’s profit recovery from last year’s loss were excluded, the sector would post a YOY EPS decline of -1.3% in the second quarter.
The Technology sector also shows an imbalance in profitability. While the sector is estimated to grow EPS by 16.1%, excluding Nvidia’s contribution, the tech sector profit growth would drop to +6.6% YOY.
On the other side of the ledger, the three sectors poised for quarterly YOY EPS declines are Materials, Industrials and Consumer Staples.
Looking Ahead
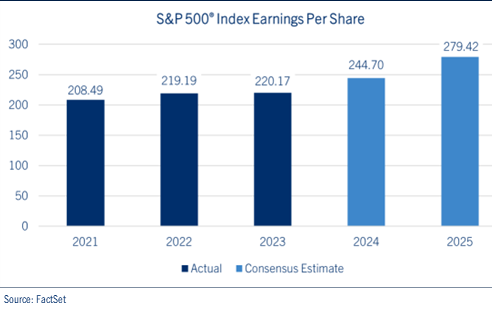
We continue to look for companies in the S&P 500® Index to deliver profit growth in the 8.0% range this year, despite the consensus projection for 11.3%. We remain concerned that the fourth quarter projection of ~+17.0% EPS YOY remains too lofty, though we’re hopeful to hear strong guidance during second quarter earnings calls next month. If that’s the case, we’ll review our call for the S&P 500® to generate $237.50 in Index EPS for 2024. See chart: S&P 500® Index EPS.

Looking ahead to next year, the consensus projects more than $275.00 in S&P 500® profits. Our projection remains in the $260.00 range until we get clarity on corporate guidance and a better feel for the direction of market interest rates. In the meanwhile, despite our shorter-term technical target of 5,550 for the S&P 500®, we believe the Index will be fairly valued on a fundamental basis in the 5,200 – 5,250 range by yearend. We arrive at this conclusion based on a trailing 12-month price-to-earnings ratio (P/E) of 22.0 times our 2024 forecast ($237.50) and 20.0 times our projection of $260.00 for 2025.
Remember, the “E” must substantiate the “P” when considering valuation.
Be well and stay safe!
*****
IMPORTANT DISCLOSURES
Comerica Wealth Management consists of various divisions and affiliates of Comerica Bank, including Comerica Bank & Trust, N.A. Inc. and Comerica Insurance Services, Inc. and its affiliated insurance agencies.
Comerica Bank and its affiliates do not provide tax or legal advice. Please consult with your tax and legal advisors regarding your specific situation.
Non-deposit Investment products offered by Comerica and its affiliates are not insured by the FDIC, are not deposits or other obligations of or guaranteed by Comerica Bank or any of its affiliates, and are subject to investment risks, including possible loss of the principal invested.
Unless otherwise noted, all statistics herein obtained from Bloomberg L.P.
This is not a complete analysis of every material fact regarding any company, industry or security. The information and materials herein have been obtained from sources we consider to be reliable, but Comerica Wealth Management does not warrant, or guarantee, its completeness or accuracy. Materials prepared by Comerica Wealth Management personnel are based on public information. Facts and views presented in this material have not been reviewed by, and may not reflect information known to, professionals in other business areas of Comerica Wealth Management, including investment banking personnel.
The views expressed are those of the author at the time of writing and are subject to change without notice. We do not assume any liability for losses that may result from the reliance by any person upon any such information or opinions. This material has been distributed for general educational/informational purposes only and should not be considered as investment advice or a recommendation for any particular security, strategy or investment product, or as personalized investment advice.
Diversification does not ensure a profit or protect against a loss in a declining market. Past performance is no guarantee of future returns. The performance of an index is not an exact representation of any particular investment, as you cannot invest directly in an index. The material is not intended as an offer or solicitation for the purchase or sale of any financial instrument. The investments and strategies discussed herein may not be suitable for all clients.
The S&P 500® Index, S&P MidCap 400 Index®, S&P SmallCap 600 Index® and Dow Jones Wilshire 500® (collectively, “S&P® Indices”) are products of S&P Dow Jones Indices, LLC or its affiliates (“SPDJI”) and Standard & Poor’s Financial Services, LLC and has been licensed for use by Comerica Bank, on behalf of itself and its Affiliates. Standard & Poor’s® and S&P® are registered trademarks of Standard & Poor’s Financial Services, LLC (“S&P”) and Dow Jones® is a registered trademark of Dow Jones Trademark Holdings, LLC (“Dow Jones”). The S&P 500®® Index Composite is not sponsored, endorsed, sold or promoted by SPDJI, Dow Jones, S&P, or their respective affiliates and none of such parties make any representation regarding the advisability of investing in such product nor do they have any liability for any errors, omissions, or interruptions of the S&P Indices.
NEITHER S&P DOW JONES INDICES NOR STANDARD & POOR’S FINANCIAL SERVICES, LLC GUARANTEES THE ADEQUACY, ACCURACY, TIMELINESS AND/OR THE COMPLETENESS OF THE WAM STRATEGIES OR ANY DATA RELATED THERETO OR ANY COMMUNICATION, INCLUDING BUT NOT LIMITED TO, ORAL OR WRITTEN COMMUNCATION (INCLUDING ELECTRONIC COMMUNICATIONS) WITH RESPECT THERETO. S&P DOW JONES INDICES AND STANDARD & POOR’S FINANCIAL SERVICES, LLC SHALL NOT BE SUBJECT TO ANY DAMAGES OR LIABILITY FOR ANY ERRORS, OMISSIONS, OR DELAYS THEREIN. S&P DOW JONES INDICES AND STANDARD & POOR’S FINANCIAL SERVICES, LLC MAKE NO EXPRESS OR IMPLIED WARRANTIES, AND EXPRESSLY DISCLAIM ALL WARRANTIES, OR MERCHANTABILITY OR FITNESS FOR A PARTICULAR PURPOSE OR USE OR AS TO RESULTS TO BE OBTAINED BY COMERICA AND ITS AFFILIATES, OR ANY OTHER PERSON OR ENTITY FROM THE USE OF THE S&P INDICES OR WITH RESPECT TO ANY DATA RELATED THERETO. WITHOUT LIMITING ANY OF THE FOREGOING, IN NO EVENT WHATSOEVER SHALL S&P DOW JONES INDICES OR STANDARD & POOR’S FINANCIAL SERVICES, LLC BE LIABLE FOR ANY INDIRECT, SPECIAL, INCIDENTAL, PUNITIVE, OR CONSEQUENTIAL DAMAGES INCLUDING BUT NOT LIMITED TO, LOSS OF PROFITS, TRADING LOSSES, LOST TIME OR GOODWILL, EVEN IF THEY HAVE BEEN ADVISED OF THE POSSIBILITY OF SUCH DAMAGES, WHETHER IN CONTRACT, TORT, STRICT LIABILITY, OR OTHERWISE. THERE ARE NO THIRD-PARTY BENEFICIARIES OF ANY AGREEMENTS OR ARRANGEMENTS BETWEEN S&P DOW JONES INDICES AND COMERICA AND ITS AFFILIATES, OTHER THAN THE LICENSORS OF S&P DOW JONES INDICES.
“Russell 2000® Index and Russell 3000® Index” are trademarks of Russell Investments, licensed for use by Comerica Bank. The source of all returns is Russell Investments. Further redistribution of information is strictly prohibited.
MSCI EAFE® is a trademark of Morgan Stanley Capital International, Inc. (“MSCI”). Source: MSCI. MSCI makes no express or implied warranties or representations and shall have no liability whatsoever with respect to any MSCI data contained herein. The MSCI data may not be further redistributed or used as a basis for other indexes or any securities or financial products. This report is not approved, endorsed, reviewed or produced by MSCI. None of the MSCI data is intended to constitute investment advice or a recommendation to make (or refrain from making) any kind of investment decision and may not be relied on as such.
FTSE International Limited (“FTSE”) © FTSE 2016. FTSE® is a trademark of London Stock Exchange Plc and The Financial Times Limited and is used by FTSE under license. All rights in the FTSE Indices vest in FTSE and/or its licensors. Neither FTSE nor its licensors accept any liability for any errors or omissions in the FTSE Indices or underlying data.comerica.com/insights
Copyright © Comerica Wealth Management


