


by John Lynch, CIO, & Team, Comerica Wealth Management
The investment landscape has proved remarkably resilient thus far in 2024 given several headwinds including inflation, interest rates and the unsettled geopolitical situation. Fortunately, employment remains solid and companies continue to deliver improved profit growth. Optimism abounds over the potential benefits of AI, while the liquidity spigots remain wide open, providing support to consumers, businesses and risk assets.
In this report, we review the contributing factors relative to policy, the economy, interest rates and corporate profitability, as well as their implications for economic and market growth.
Download Mid-Year Market Outlook
Executive Summary
- Policy – Monetary policymakers have remained on the sidelines, while Treasury has provided sufficient liquidity to help offset the impact from quantitative tightening this election year.
- Economy – Signs of moderation are emerging, yet we continue to look for real GDP growth of ~+2.0% with inflation hovering in the 3.0% range this year.
- Fixed Income – The U.S. Treasury Yield Curve continues to point toward recession, though no other data points support this conclusion. Consequently, bond investors face volatility as the benchmark 10-year Treasury note could break either way, depending on fears of inflation/deficit spending, or geopolitics/economic slowdown. Fortunately, corporate credit spreads support soft landing scenario.
- Equities – Market technicals indicate the S&P 500® can climb to the 5,550 range in coming months. However, a review of equity market fundamentals suggests that the upside technical target may be difficult for the Index to sustain without improved support from interest rates and corporate earnings. Remember, the “E” must substantiate the “P” when considering valuation.
We believe a balanced approach at this point in the cycle will help protect investors from the market risks associated with interest rates, geopolitics and extent of the expansion.
We’ll reassess our forecasts after second quarter earnings season and will publish further thoughts on the presidential election following the political party conventions later this summer.
Policy
Mixed Messages from Treasury and the Fed
In our 2024 Market Outlook, we highlighted that “while the Fed may be done, Treasury is not!”
To be sure, monetary policymakers have remained on the sidelines since last summer and fiscal legislators, having already enacted legislation relative to semiconductor production and infrastructure spending, are now focused on the November elections. The U.S. Treasury, however, has played an active role, providing liquidity to consumers, businesses and investors.
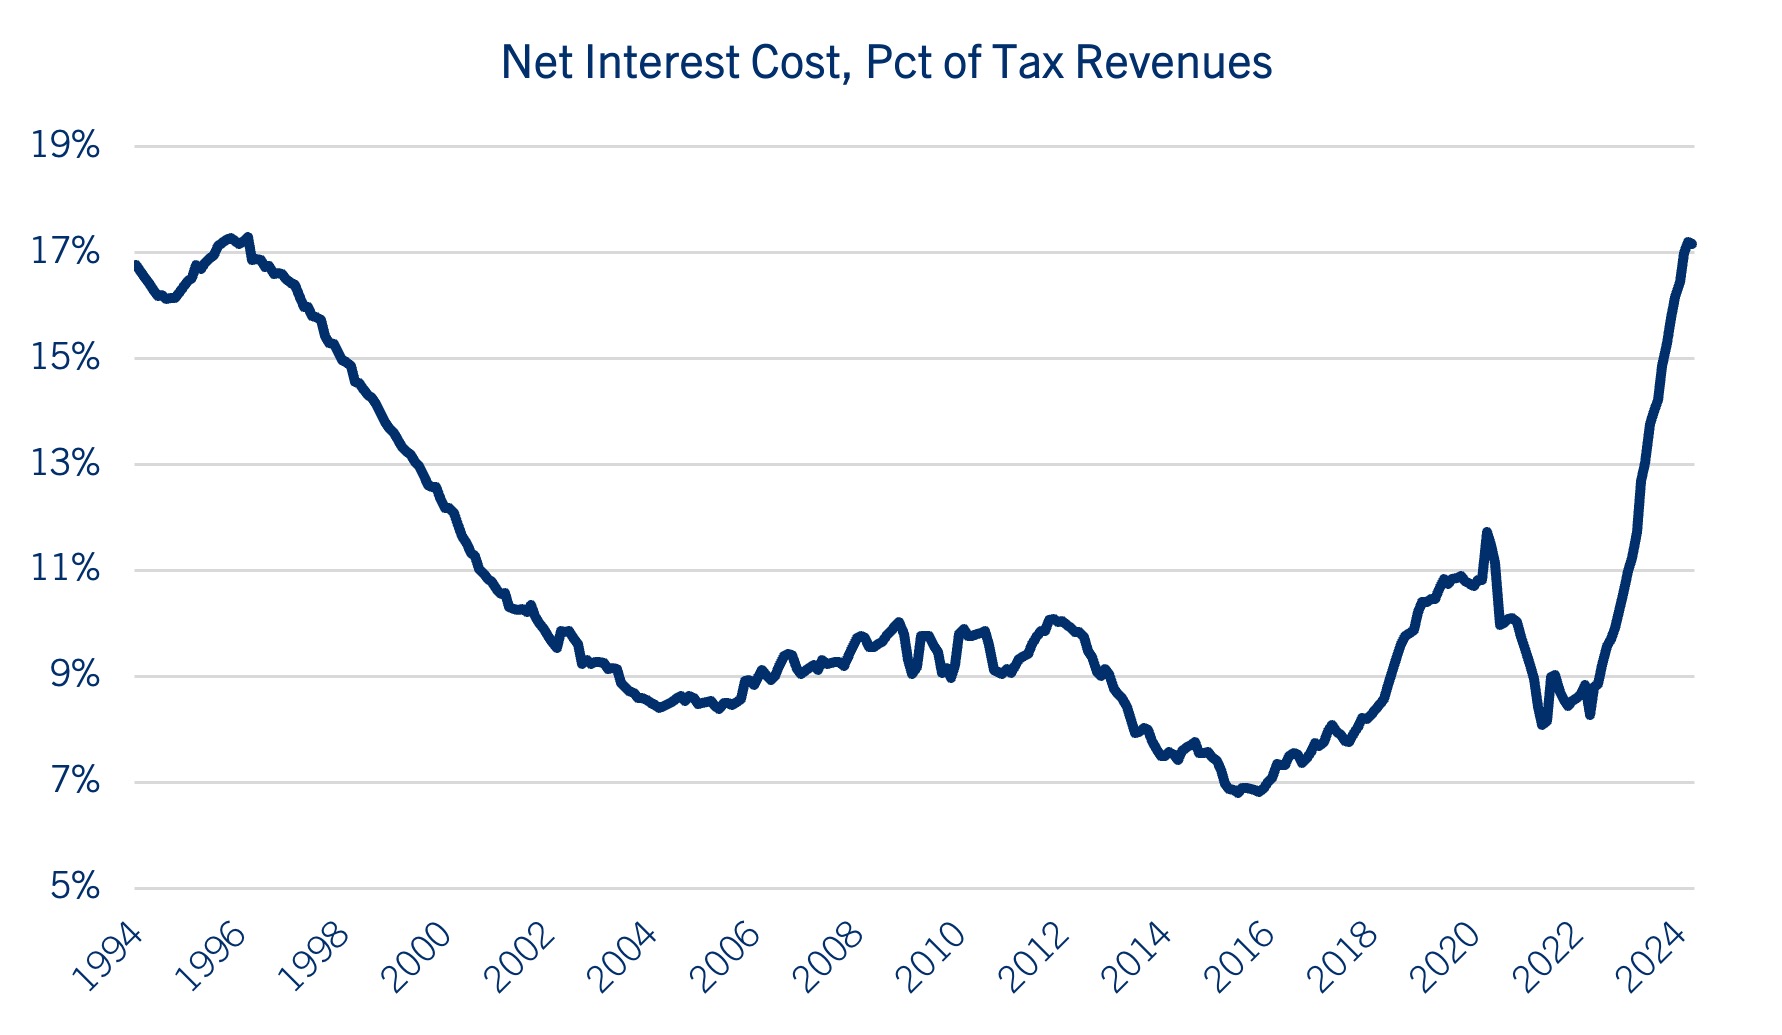
Of course, the U.S. fiscal situation has significant economic and market implications. The federal budget deficit this year hovers in the $1.6 trillion range, despite the economy essentially remaining “fully employed” with the unemployment rate below 4.0%. Total U.S. government debt is approaching $35 trillion and recent auctions for Treasury securities have been met with lackluster demand. Federal interest costs have surged to ~17% of U.S. tax receipts, a level previously associated with bond market “vigilantes” demanding austerity measures via higher market interest rates. See chart: Net Interest Costs as a Percentage of U.S. Tax Revenue
Yet this is an election year and federal largesse is prevalent.
Following the surge in emergency pandemic-related federal spending, inflation soared to multi-decade highs, causing the Federal Reserve to aggressively raise its target for the federal funds rate to a range of 5.25%-5.50% by the middle of 2023. As inflation plunged from record levels, market participants priced in the potential for as many as six rate cuts this year. We were not as optimistic, and instead our original projection called for three rate cuts. As it turns out, that forecast may ultimately prove too sanguine, as pricing pressures persist and Fed Chair Jerome Powell remains “data dependent.”
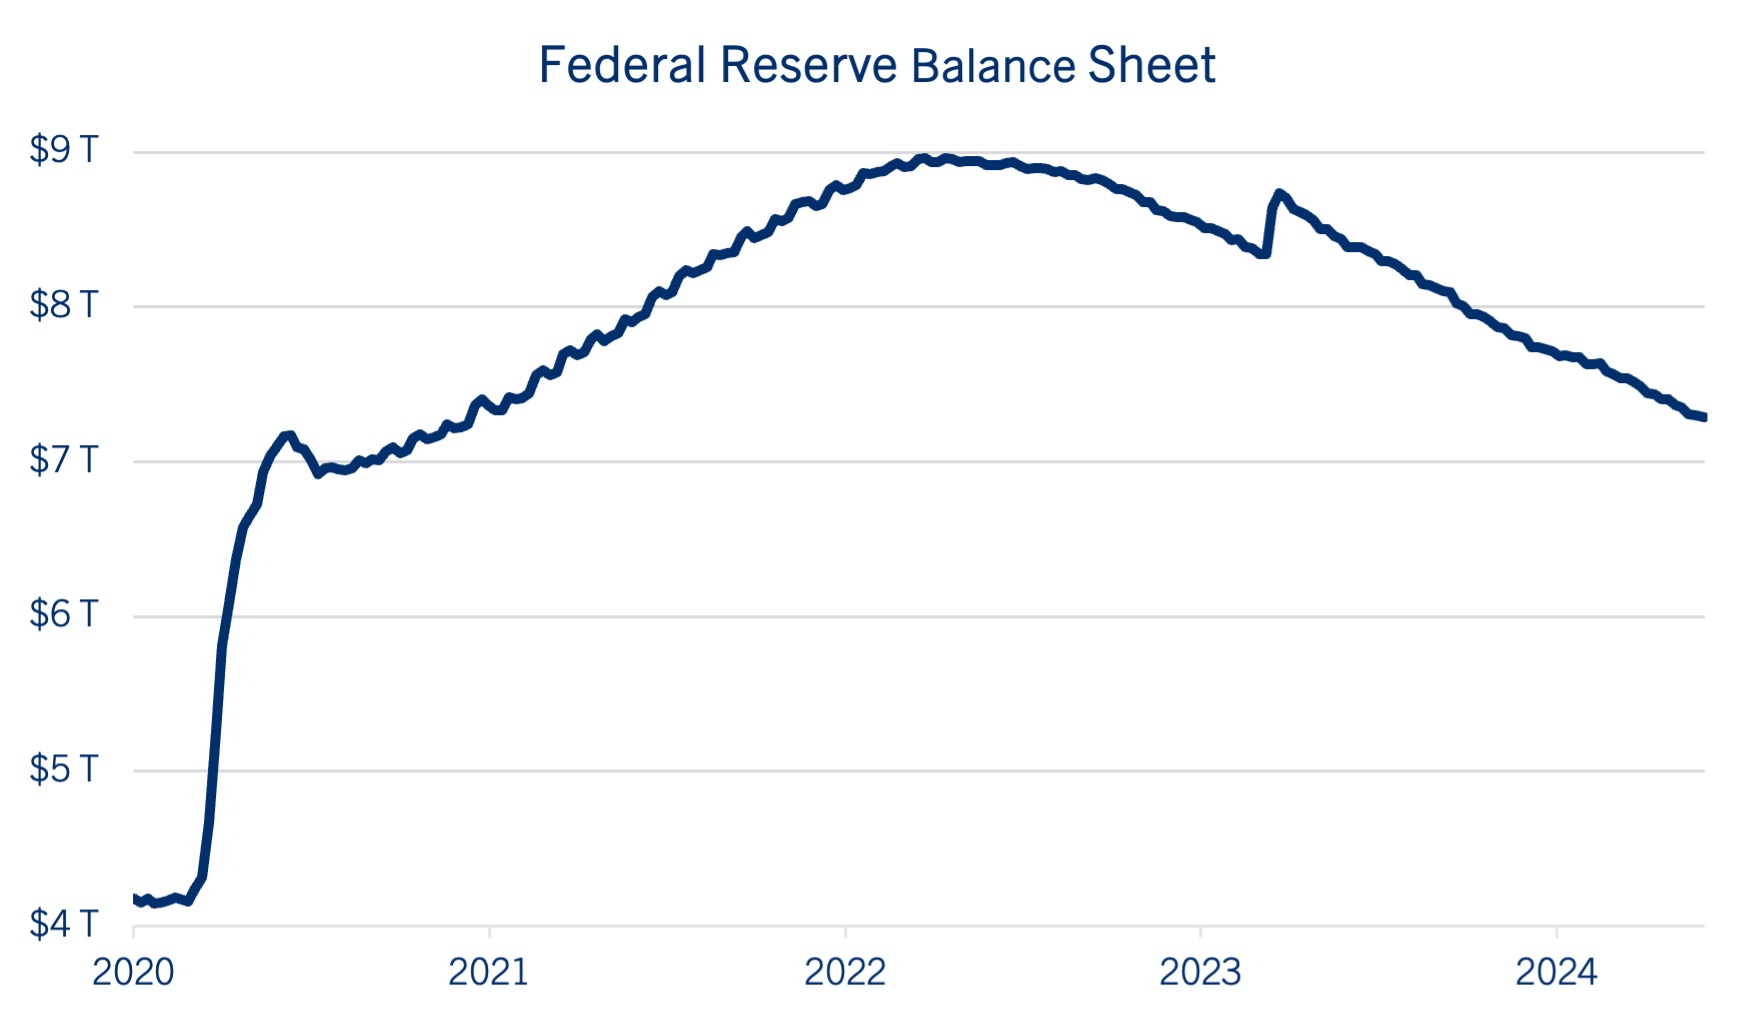
While monetary policymakers have held rates steady for almost one year, this “higher for longer” strategy may soon transition to a less burdensome market interest rate environment, even without an imminent cut in the federal funds rate. Indeed, at the conclusion of its most recent Federal Open Market Committee (FOMC) meeting, the Fed announced a modification to its balance sheet reduction plan, which has declined by approximately $1.6 trillion since the fourth quarter of 2022. Going forward, “quantitative tightening” (QT) will see the amount of U.S. Treasuries dropping off the Fed’s balance sheet decline from $60 billion per month to $25 billion, thereby increasing liquidity and lessening upward pressure on market interest rates. See chart: Federal Reserve Balance Sheet
Consequently, liquidity is poised to expand by ~$35 billion per month as the Fed reinvests the additional proceeds from the maturing securities on its balance sheet. Yet the real boost to liquidity this year has come from the U.S. Treasury Department, which has periodically drawn down funds from its approximately $750 billion Treasury General Account (TGA). A study by Strategas Research Partners suggests that up to $300 billion may be released in the months leading up to the election, through a combination of QT, TGA and quarterly Treasury refunding, providing further tailwinds for consumers, businesses and the financial markets.
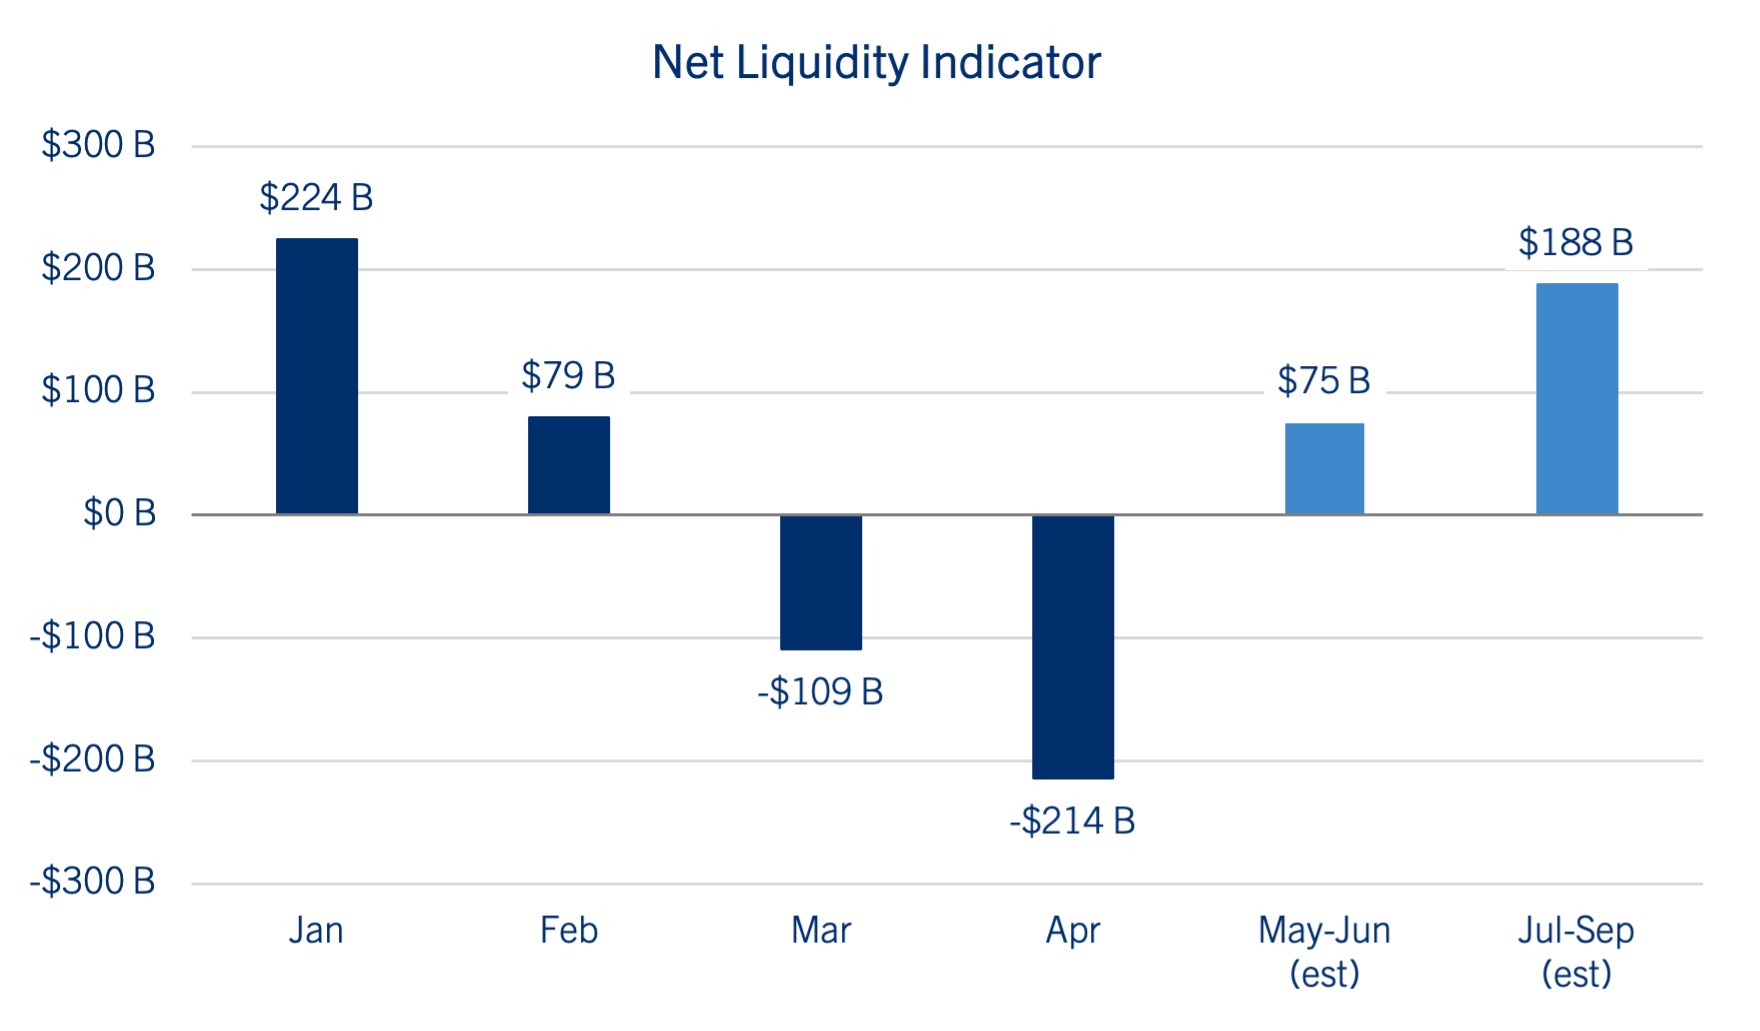
To be sure, many investors frequently ask us how the economy and financial markets can perform as well as they have after the dramatic surge in interest rates. We believe a good portion of the answer is due to the corresponding surge in liquidity, which helps offset the impact of higher interest rates. For example, the money supply, as defined by M2, remains more than one-third higher than pre-pandemic levels. Also, while the Federal Reserve attempted to tighten financial conditions over the past 18 months by allowing ~$1.6 trillion to roll off its balance sheet, the U.S. Treasury has increased liquidity by a similar amount through quarterly refunding programs and drawing down funds from the TGA during this same timeframe. See chart: Net Liquidity Indicator
Of course, all eyes will be on the presidential election in the coming months as the presumptive nominees will highlight their party platforms at the conventions this summer. Since candidate approval ratings, swing state polling and betting odds currently suggest a close race, it may prove instructive to step away from headline political noise and instead simply focus on the “Misery Index,” which represents the sum of the unemployment rate and the year-over-year (YOY) growth rate of inflation. See chart: Misery Index (Inflation + Unemployment)
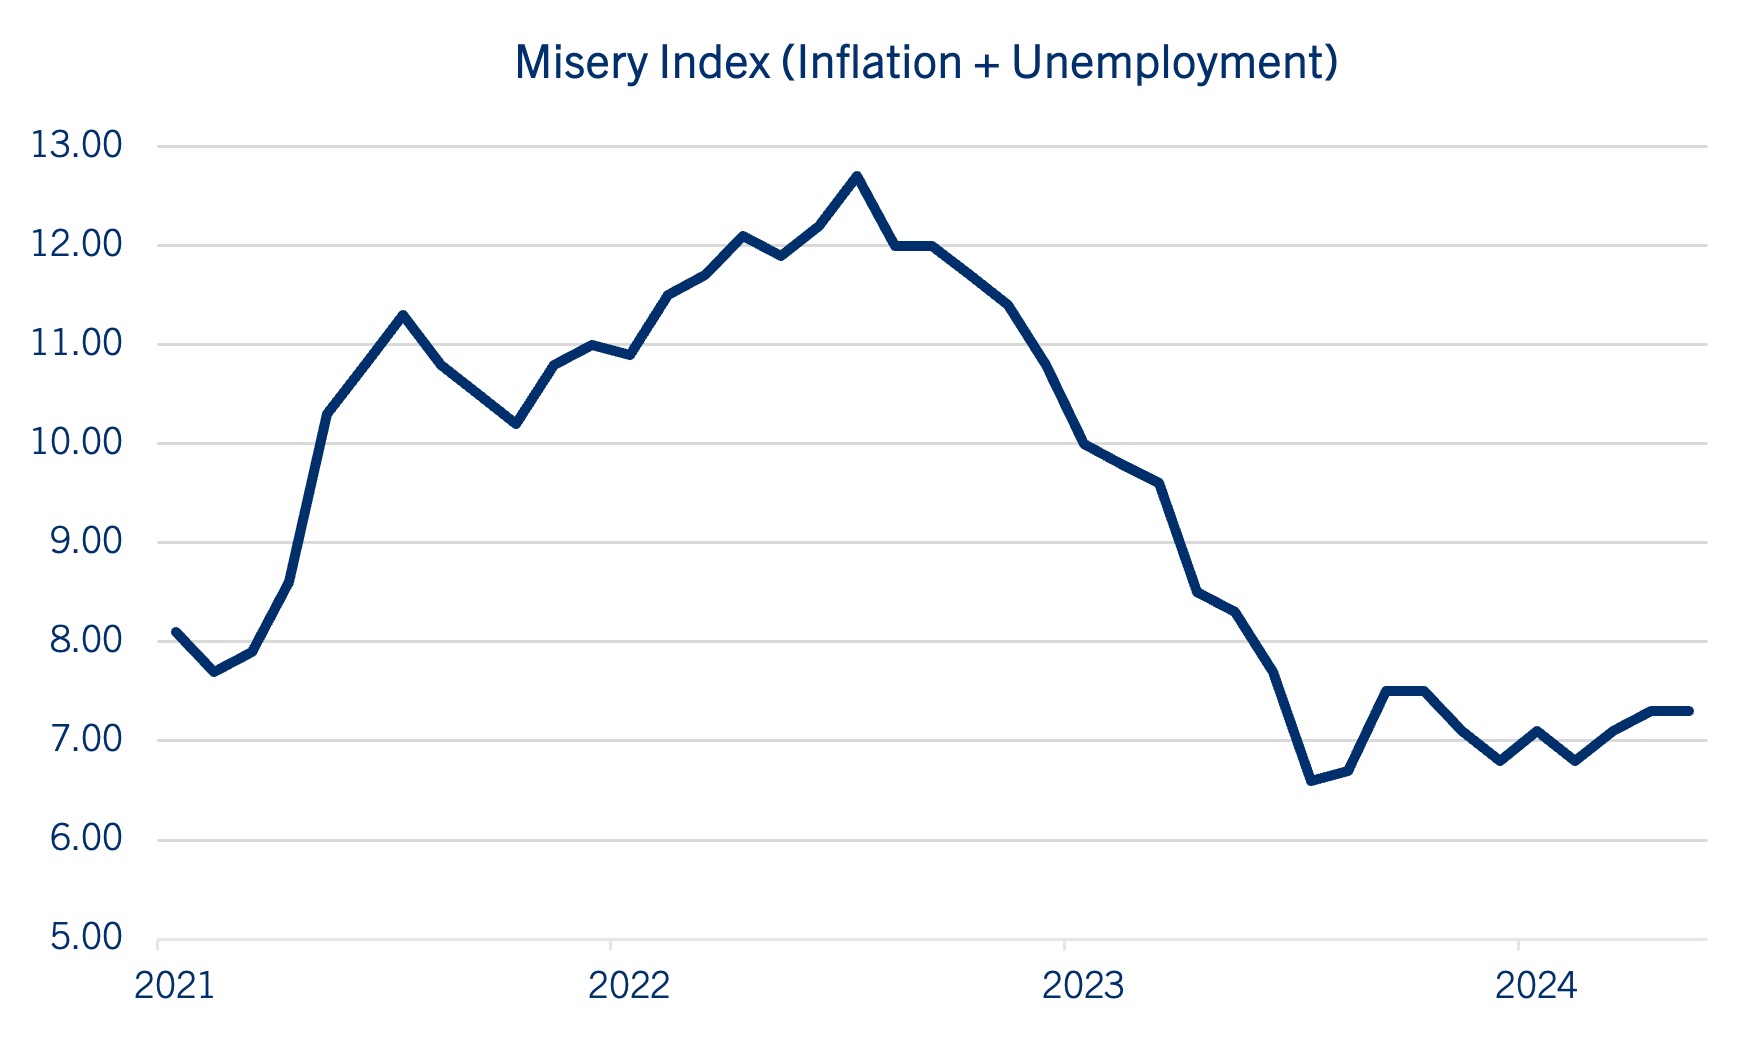
Since 1980, the Misery Index has predicted 15 of the past 16 presidential election winners, according to Strategas Research Partners. If the combination of the jobless rate and the YOY growth rate of inflation is 7.3 or below, the incumbent candidate/party typically wins reelection.
Regardless of who wins, fiscal leadership will be requisite in 2025 given approximately $4 trillion in expiring tax provisions, conceivably making next year the most consequential since the current tax system was developed in 1913.
We’ll provide a more in depth look of investment implications of the 2024 Presidential Election following the party conventions this summer.
Economy
Signs of Moderation Emerging
The U.S. economy started the year on better footing than anticipated, leading to stronger than forecast reports on inflation and employment. Given these developments, market expectations for monetary accommodation have diminished significantly for the remainder of 2024.
Yet recent signs of moderation have emerged and a closer look into GDP, inflation and employment indicates the potential for some moderation in the months ahead.
After a bright start, U.S. economic growth ultimately fell short of expectations in the first quarter, with real GDP growth slowing to 1.3%, below the consensus forecast of 2.5%—marking the slowest quarterly expansion since the second quarter of 2022. Moreover, this pace was dramatically slower than the +3.8% rate experienced during the second half of 2023. See chart: U.S. Real GDP Quarterly Growth
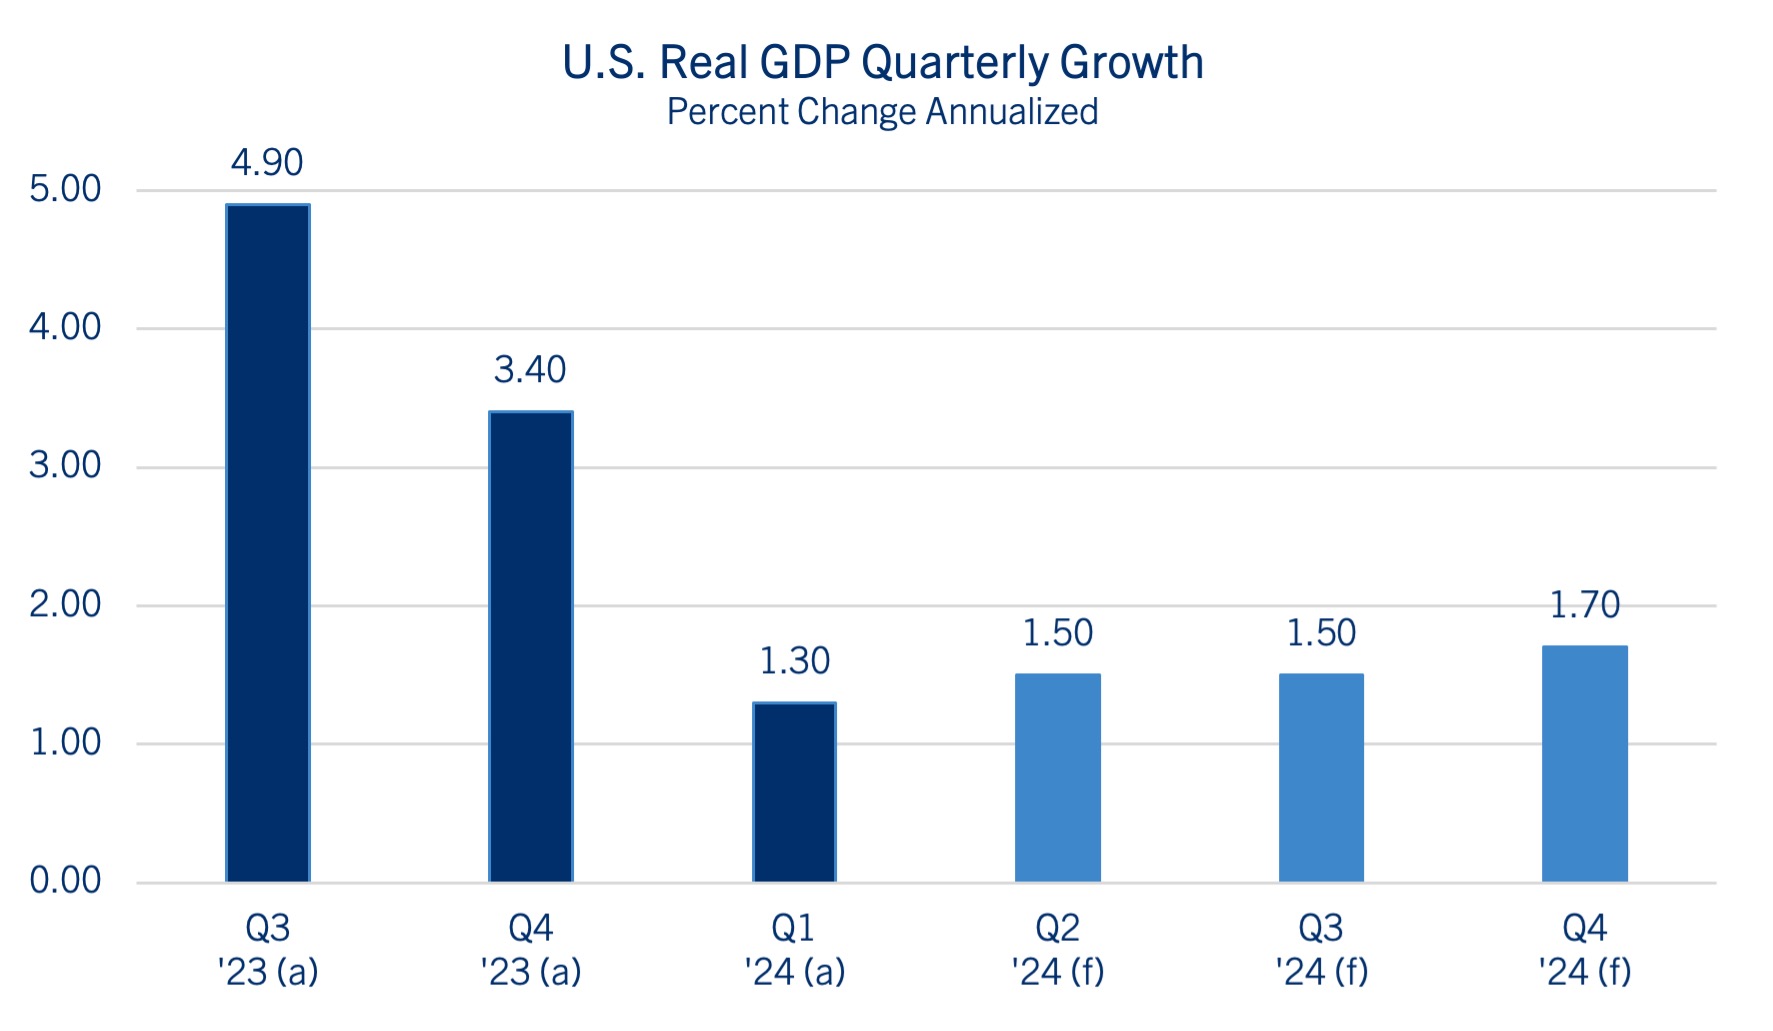
Comerica Bank Chief Economist Bill Adams notes that the impact of the Fed’s rate tightening policy was clearly visible as the 1st quarter progressed, particularly relative to consumers’ purchases of durable items.
The Consumer Price Index (CPI) report for April indicated a slight easing of inflation, as the headline reading slowed to +3.4% on a year-over-year (YOY) basis. In addition, the core CPI, which excludes food and energy prices, climbed just +3.6% YOY, its slowest pace since April 2021. See chart: Consumer Price Index
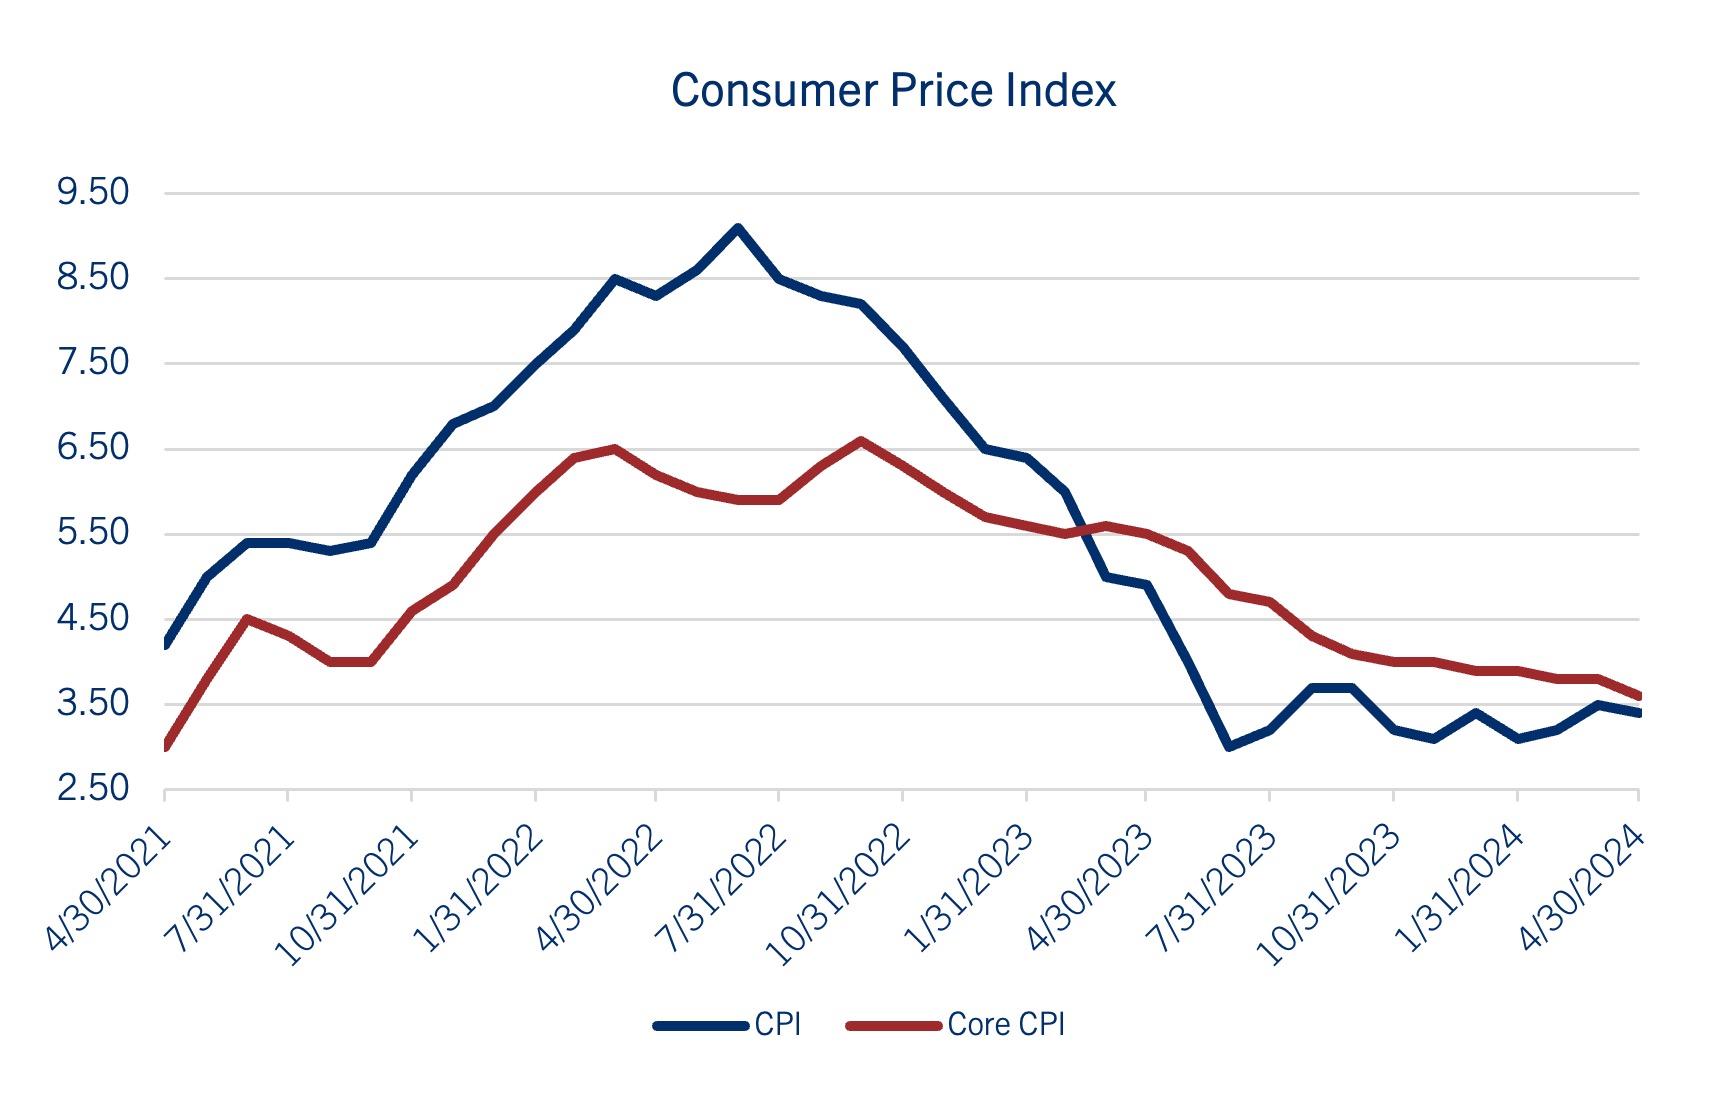
The softer April reading should provide some comfort to investors that inflation is abating after running hotter-than-expected in the first three months of the year. While it likely won’t be enough on its own to change the Fed’s outlook on when to begin cutting interest rates, it likely calms fears that the Fed might require another rate hike to tame persistent pricing pressures.
The April Employment Report was also weaker than expected, as non-farm payrolls rose by 175k, well below the consensus forecast of 240k and the 315k reading in March. The unemployment rate nudged higher to 3.9% and average hourly earnings ticked lower to +3.9% on a year-over-year (YOY) basis.
Regarding jobs, we think it is important to note that while the monthly data may have ticked lower, the weekly claims for unemployment insurance consistently indicate few job losses, suggesting the likelihood for moderation rather than a protracted economic slowdown.
To the degree that businesses continue to spend on labor and capital, we believe the economy is in good shape. Bill Adams continues to project real GDP growth of ~2.0% in 2024 with inflationary pressures moderating in the 3.0% range, which should enable the Fed to begin cutting rates in September.
Fixed Income
Mixed Messages from Treasuries and Corporates
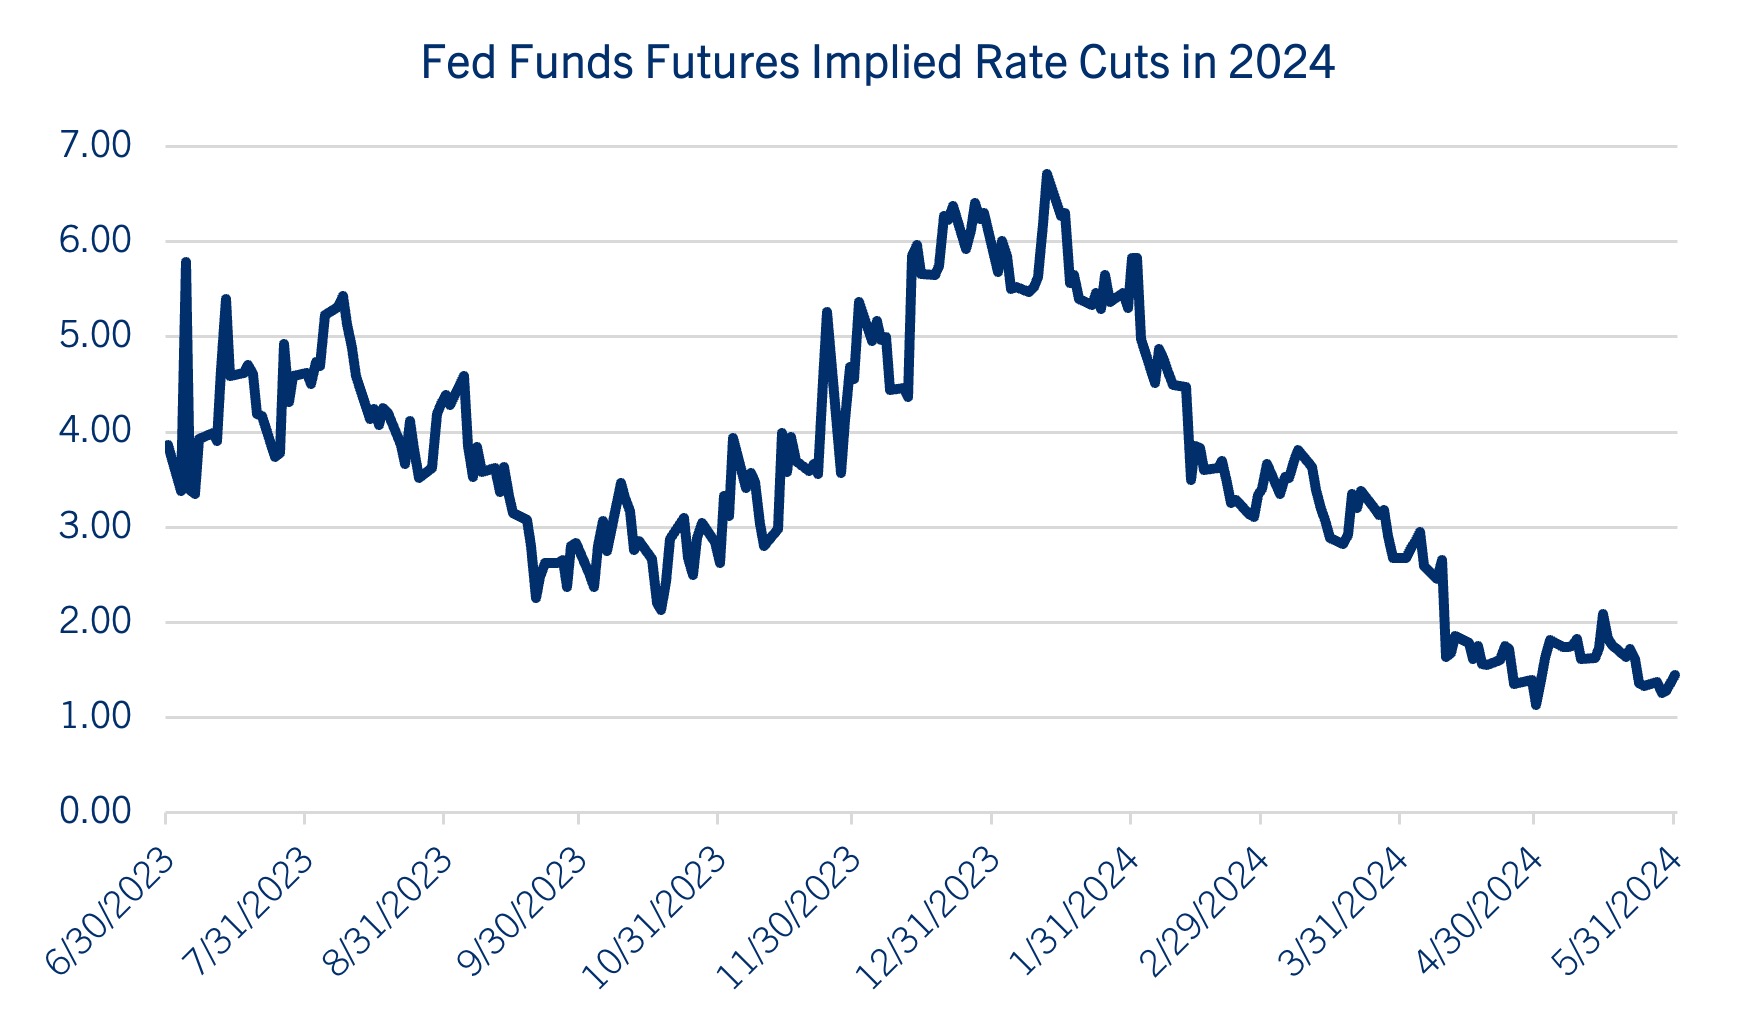
The bond market has been volatile in the first half of the year as investors continue to divide the Fed’s rate cut path. Despite firming in May, the Bloomberg Aggregate Bond Index remains down ~-1.5% year-to-date (YTD). Moreover, the Fed Funds futures markets had priced in as many as six rate cuts this year before surprisingly hot inflation reports forced investors to significantly recalibrate their expectations. This measure now points to between one and two cuts this year, reflecting the Fed’s “higher-for-longer” stance. See chart: Fed Funds Futures Implied Rate Cuts in 2024
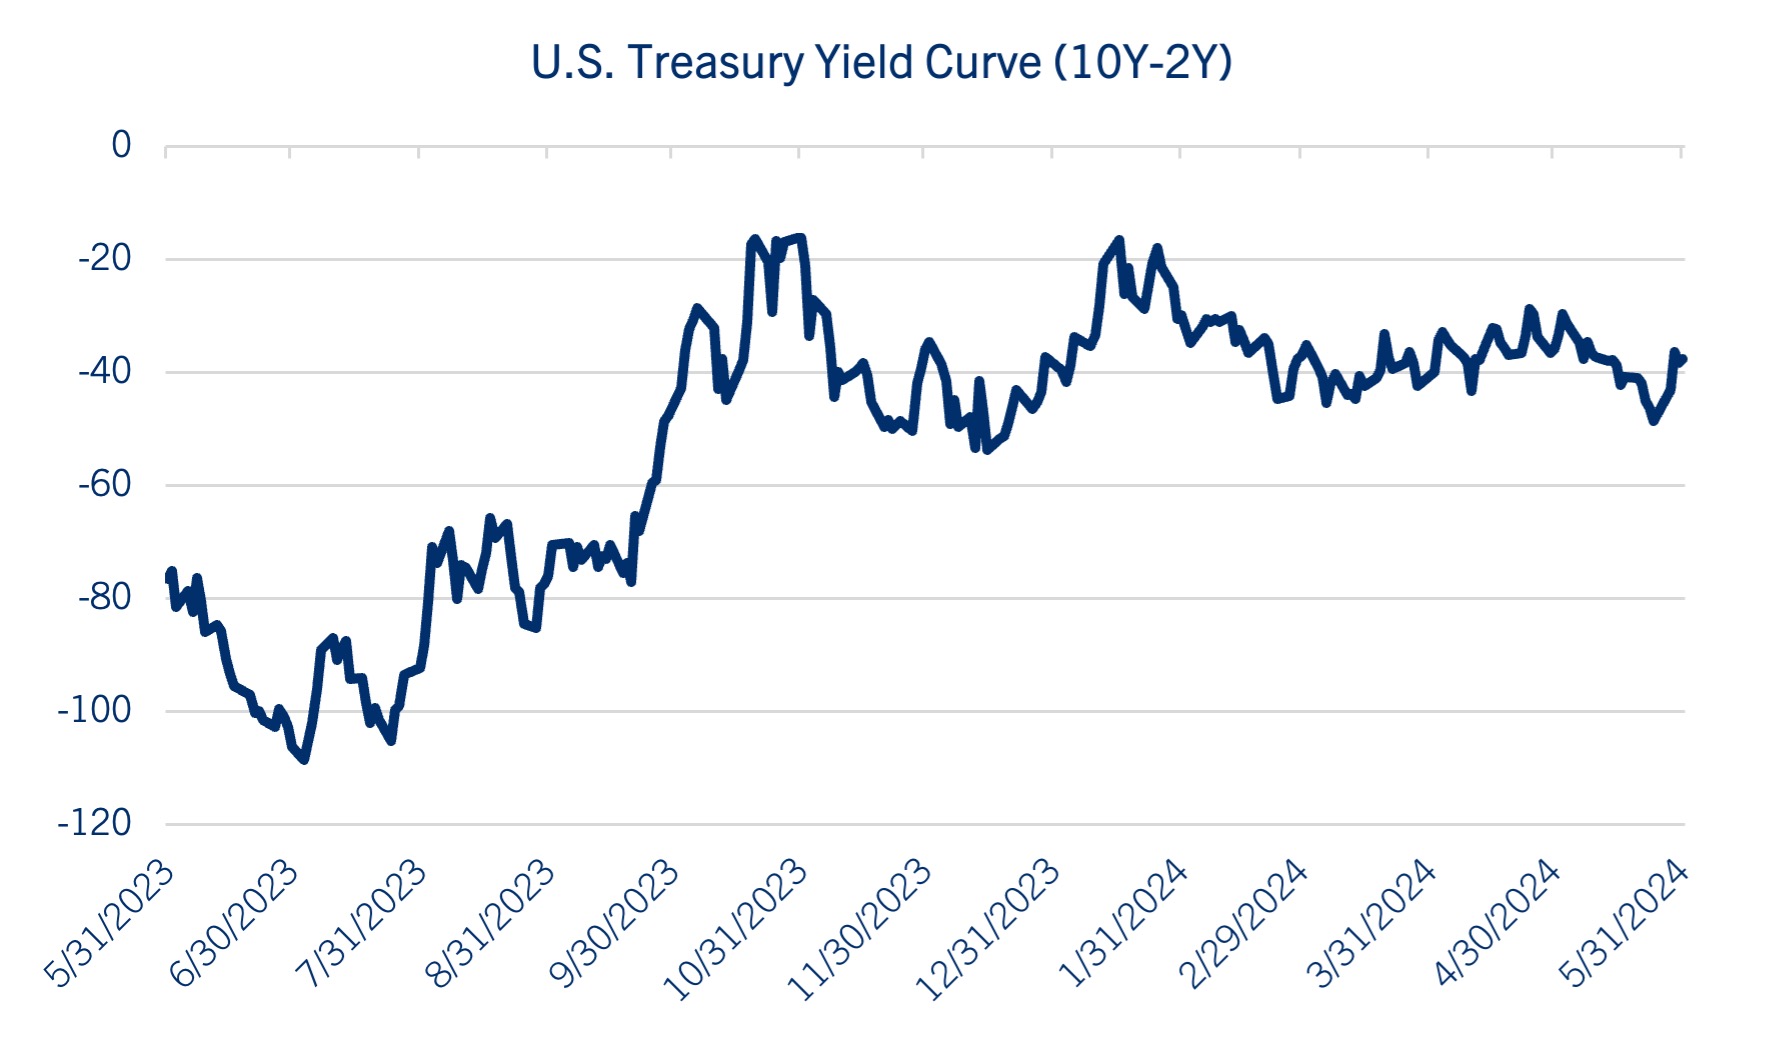
The result has been a pattern of rising bond yields—and falling prices—across the yield curve. Longer-dated maturities have fared worse than shorter-dated maturities due to higher interest rate sensitivity (duration), but short-term bonds have not been immune from the rising rates. The yield on both the two-year and 10-year treasury notes have climbed ~50 basis points since the start of the year. The Treasury yield curve remains inverted, indicating the possibility for recession and has consistently traded in a relatively narrow band between -30 and -50 basis points. See chart: U.S. Treasury Yield Curve
Despite the uncertainty and volatility facing the bond market, we continue to be encouraged by the lack of “stress” in corporate credits. While yields for investment grade and high yield credits have nudged higher, they remain within their average spreads relative to the benchmark 10-year Treasury note they’ve traded in over the past 25 years. We view this as an indication that fixed income investors continue to see little threat of recession, with low default rates being priced into corporate credits. See chart: Investment Grade and High Yield Credit Spreads
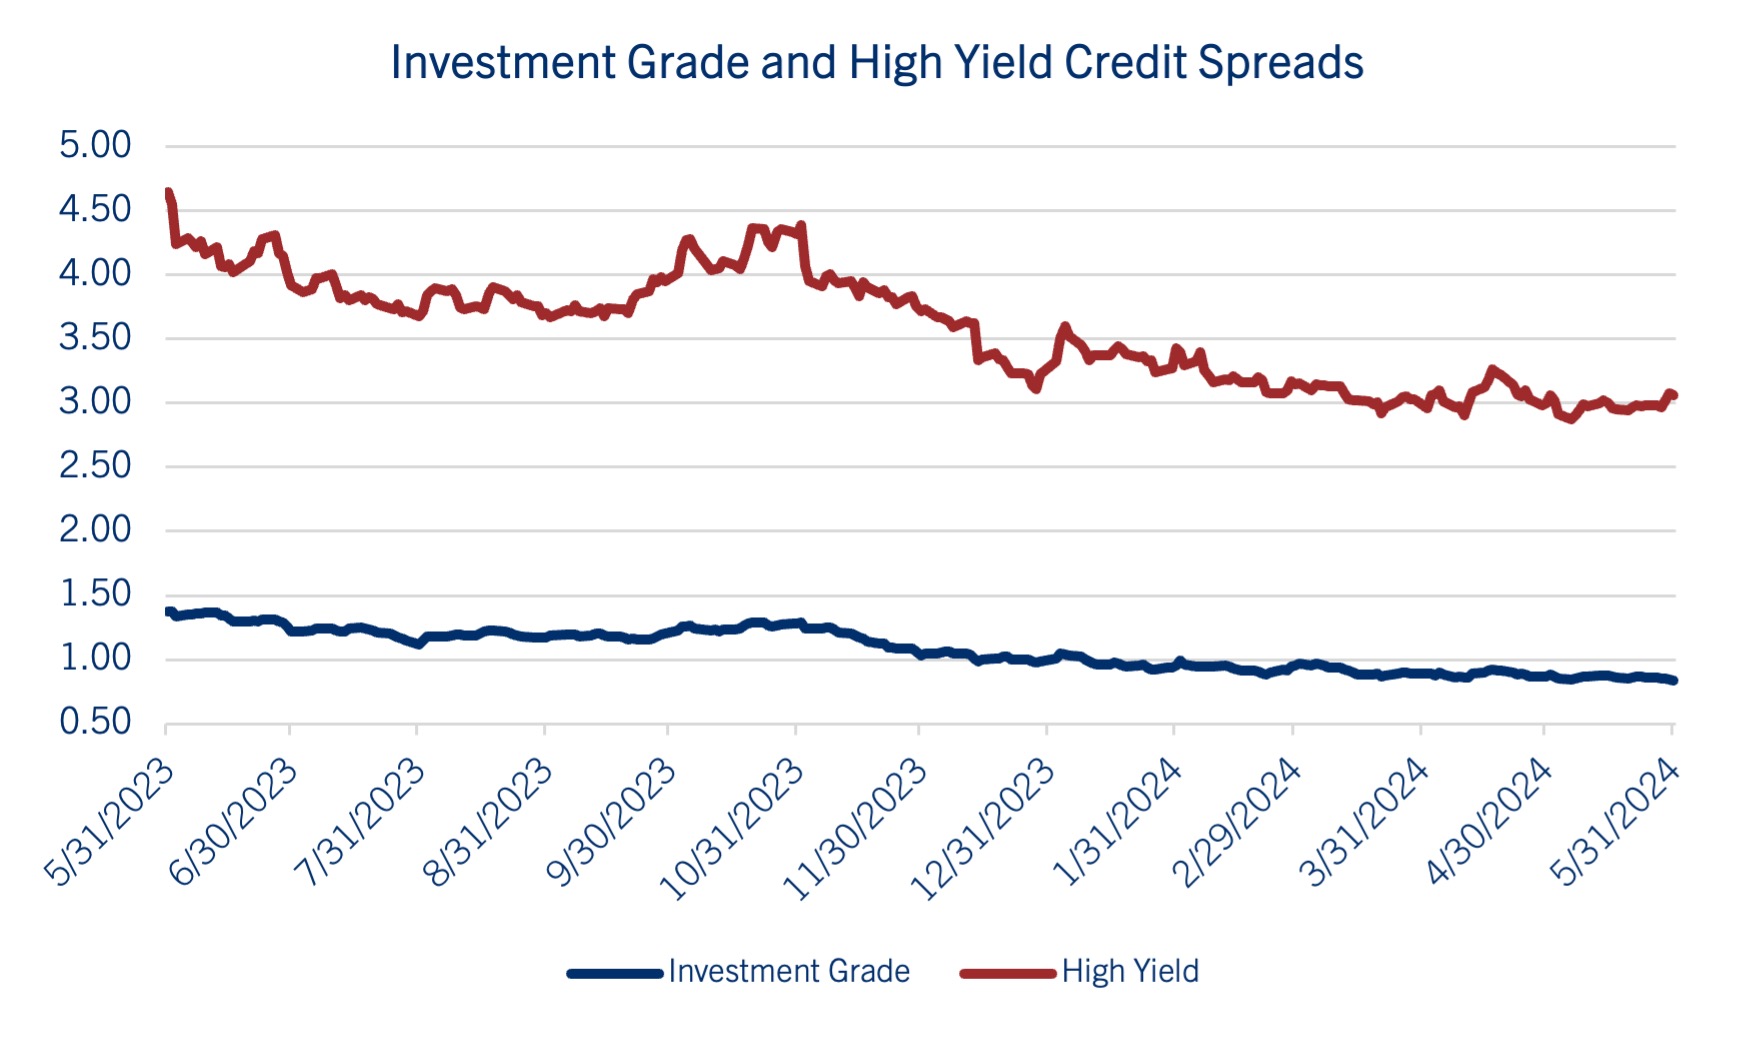
Indeed, the lone bright spot has been high-yield fixed income, whose higher coupon payments have provided enough carry to help offset declining bond prices. High yield has also benefitted from a shrinking yield spread to investment grade bonds, reflective of investors’ confidence in the economy.
We continue to view the fixed income market cautiously as the benchmark 10-year Treasury note hovers in the 4.50% range. Investors are encouraged to maintain diversified strategies while keeping interest rate sensitivity (duration) at benchmark levels and embracing credit quality. With this stance, we believe portfolios can benefit from elevated coupons while also mitigating the volatility associated with fears of geopolitics/recession (bond yields lower) and expanding federal deficits (bond yields higher).
Equities
Fundamentals Struggle to Keep Up with Market Technicals
Equities have enjoyed a strong start to the year with each of the major domestic equity indexes recently setting all-time highs. The S&P 500® Index and the Nasdaq Composite have both produced total returns north of 11.0% through May, while the Dow Jones Industrial Average eclipsed the 40,000-level last month. Small cap indexes have lagged, however, given their higher susceptibility to moves in market interest rates.
The broader rally has been impressive, particularly given last year’s strength. The equity market has achieved this despite a shift in the bullish narrative. Indeed, sentiment has moved from hopes for as many as six Fed rate cuts at the beginning of the year, switching to optimism that artificial intelligence will unlock a new era of productive economic growth and higher corporate profitability.
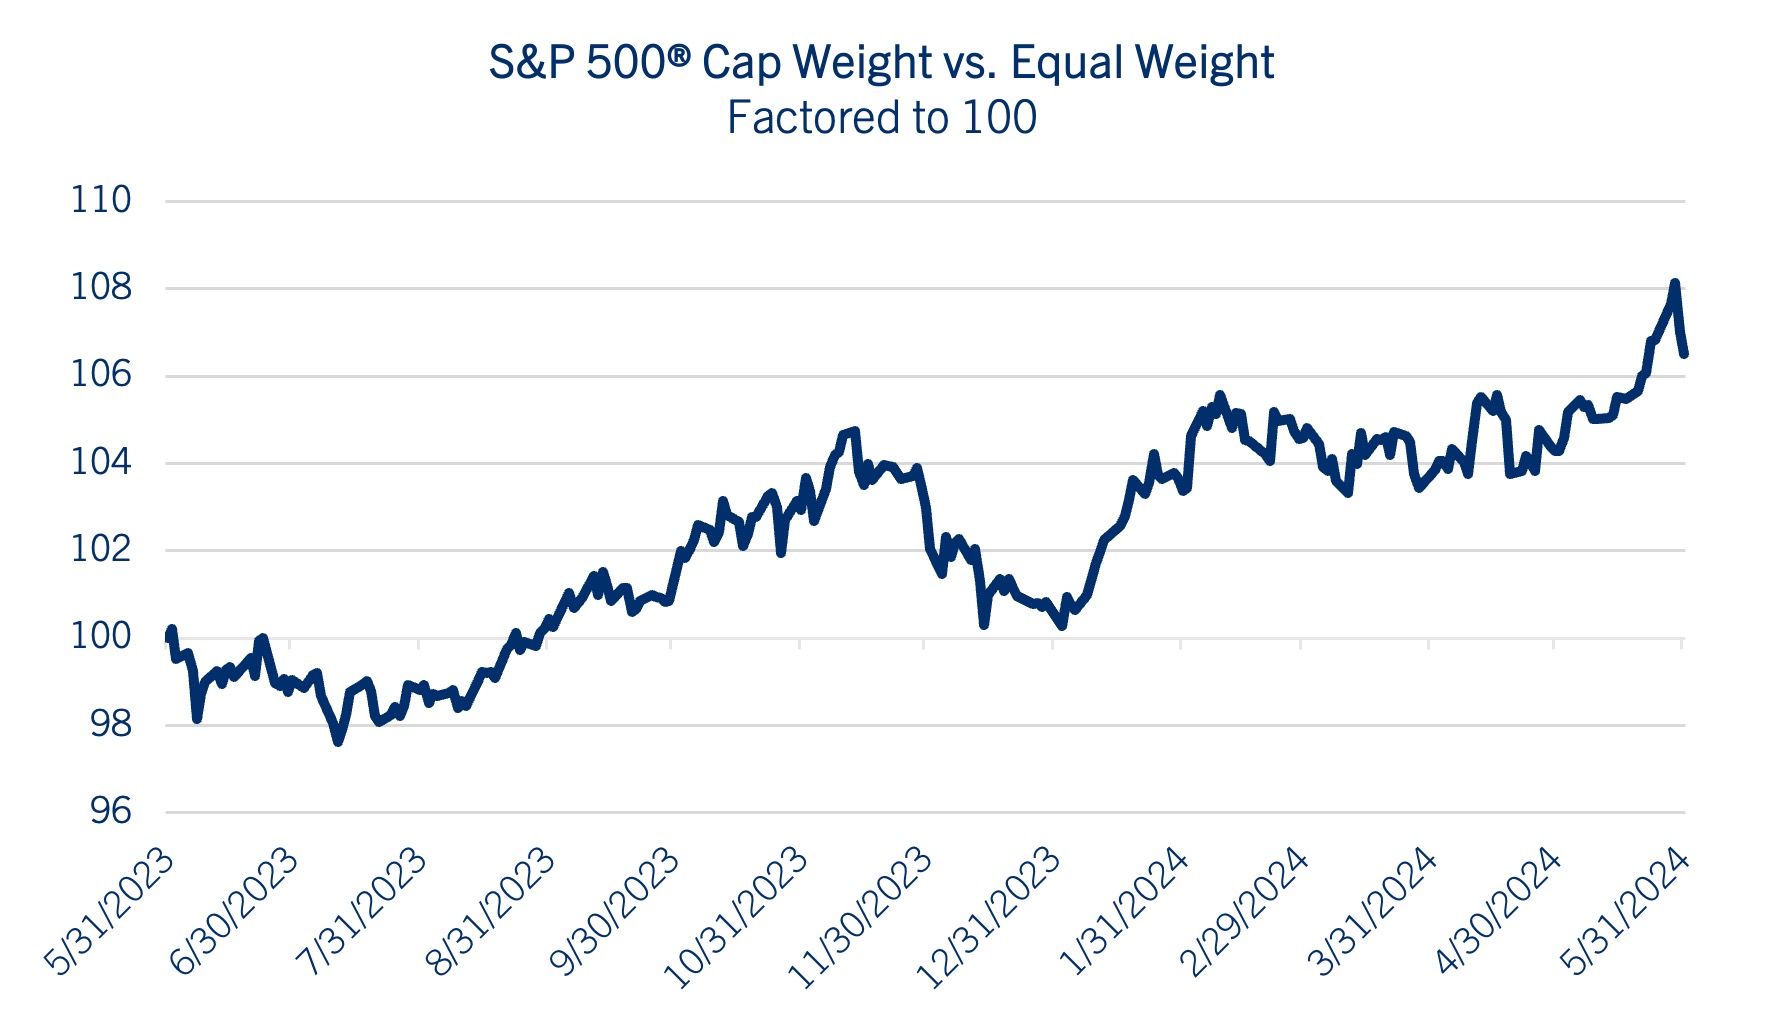
The gains have become more concentrated, though, as even the “Magnificent Seven” have had some laggards, resulting in leadership dwindling to something resembling a “Fab Five.” Indeed, a broader view indicates that participation has narrowed, with the equally weighted S&P 500® continuing to trail the more popular capitalization-weighted Index. See chart: S&P 500® Cap Weight vs. Equal Weight Index
A look at market technicals suggests the S&P 500® Index has more room to run. Considering that the S&P 500® traded within the range of 4,950 to 5,250 over the past several months, the Index’s recent breakout above that band now suggests that an upside technical target of 5,550 is possible in the coming months. See Chart: S&P 500® Index
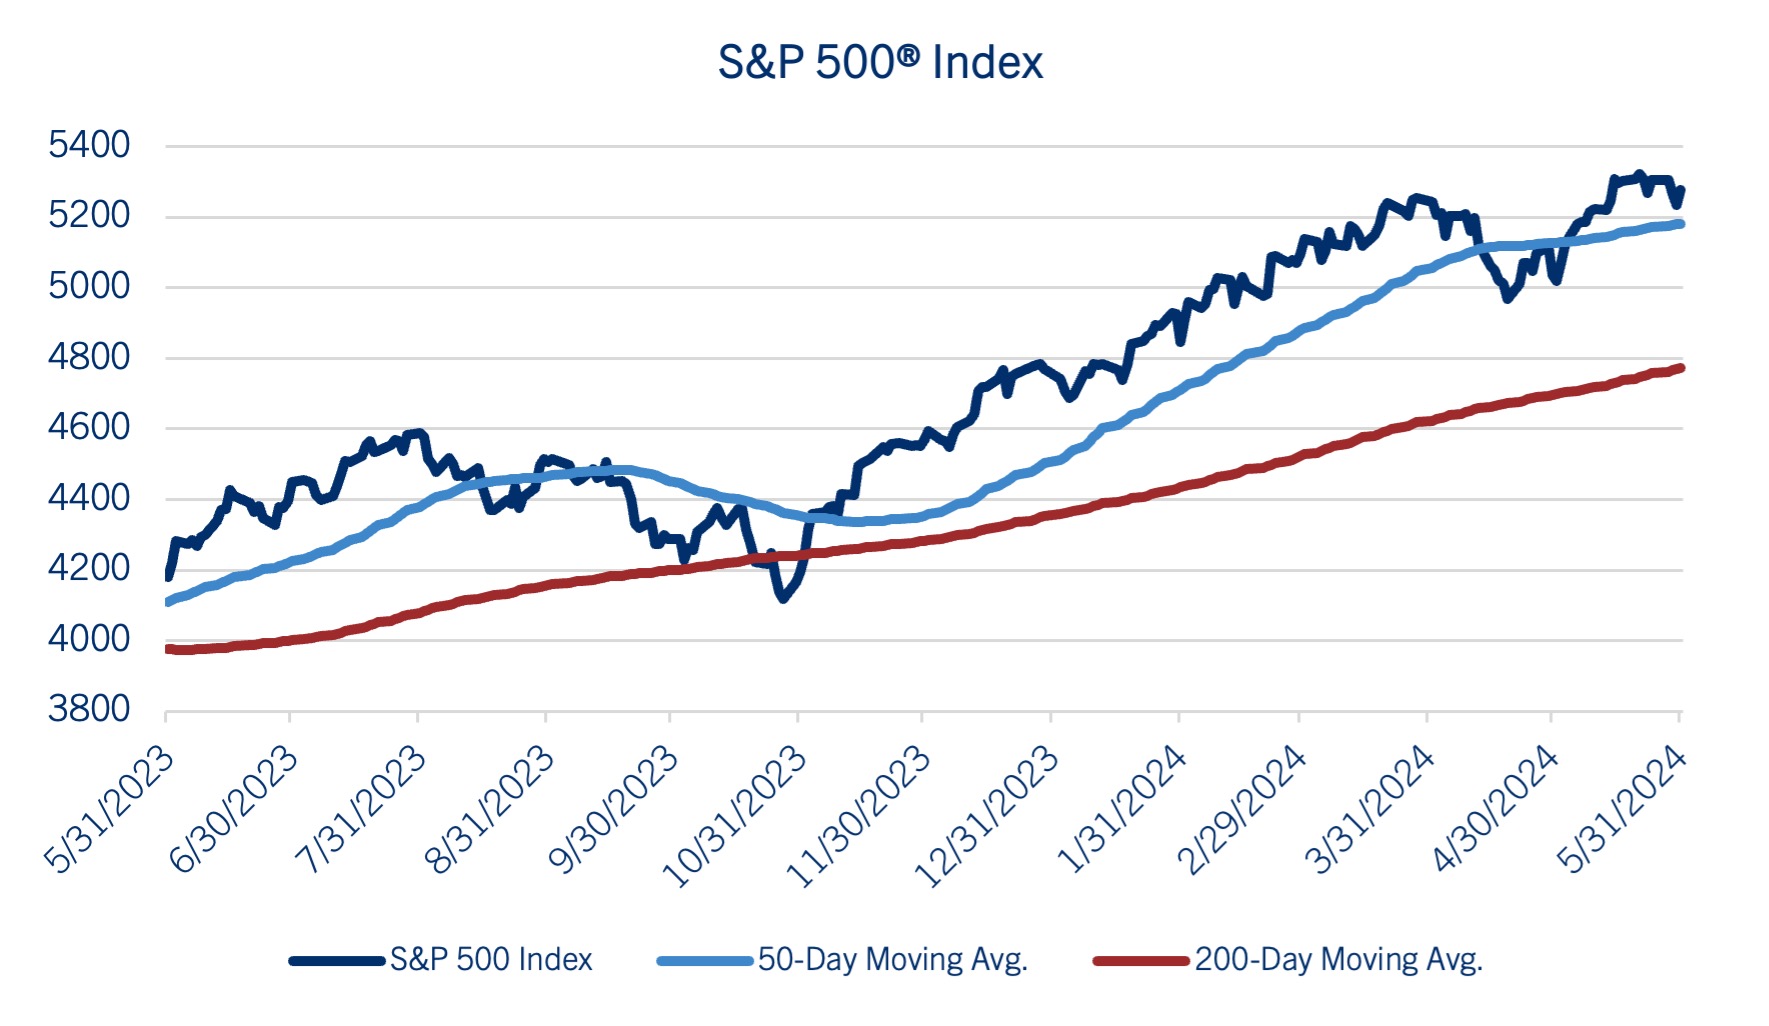
Before we get too excited, though, it is important to note that the market’s momentum, as defined by the percentage of stocks in the S&P 500® trading above their 50-day moving average (DMA) has weakened, falling from 80% two months ago to just 50% at the end of May. Fortunately, the market’s trend remains solid, with ~75% of companies trading above their 200-DMA.
A review of equity market fundamentals suggests that the upside technical target may be difficult to sustain, though, without improved support from a combination of interest rates, earnings and valuation.
Of course, the 10-year Treasury yield has been hovering in the 4.5% range recently. A decided break above that level, back to the 5.0% range, would signal traders concerns about the financing of federal deficits and inflation, threatening the valuation metrics for equities. A move in the benchmark yield toward 4.0% could benefit stocks, assuming the driver wasn’t fear of recession.
We continue to look for companies in the S&P 500® Index to deliver profit growth in the 8.0% range this year, despite the consensus projection for 11.0% to 12.0%. We remain concerned that the fourth quarter projection of ~+17.0% EPS YOY growth remains too lofty, though we’re hopeful to hear strong guidance during second quarter earnings calls next month. If that’s the case, we’ll review our call for the S&P 500® Index to generate $237.50 in EPS for 2024. See chart: S&P 500® Index Earnings Per Share
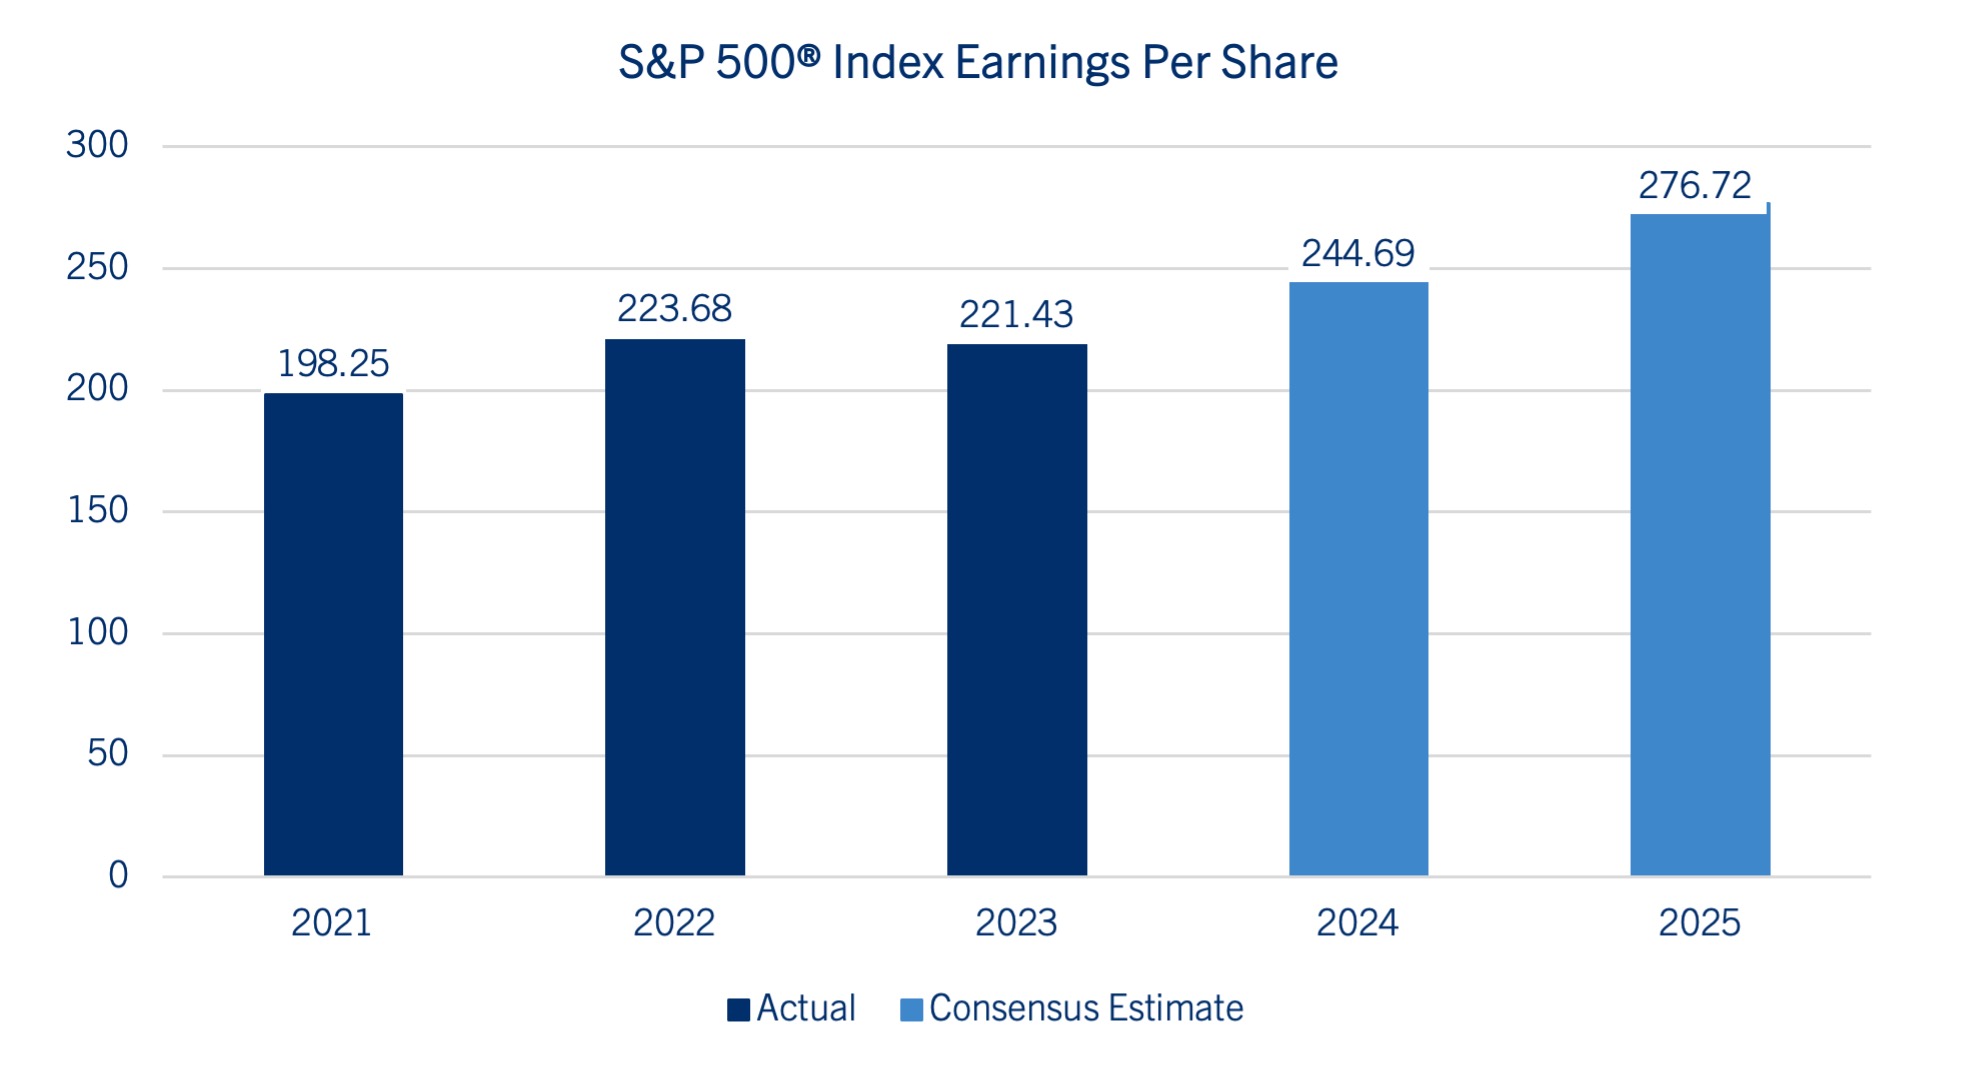
Looking ahead to next year, the consensus projects more than $275.00 in S&P 500® profits. Our projection remains in the $260.00 range until we get clarity on corporate guidance and a better feel for the direction of market interest rates. In the meanwhile, despite our shorter-term technical target of 5,550 for the S&P 500®, we believe the Index will be fairly valued on a fundamental basis in the 5,200 – 5,250 range by yearend. We arrive at this conclusion based on a trailing 12-month price-to-earnings ratio (P/E) of 22.0 times our 2024 forecast ($237.50) and 20.0 times our projection of $260.00 for 2025. See chart: S&P 500® Index Price to Earnings Ratio
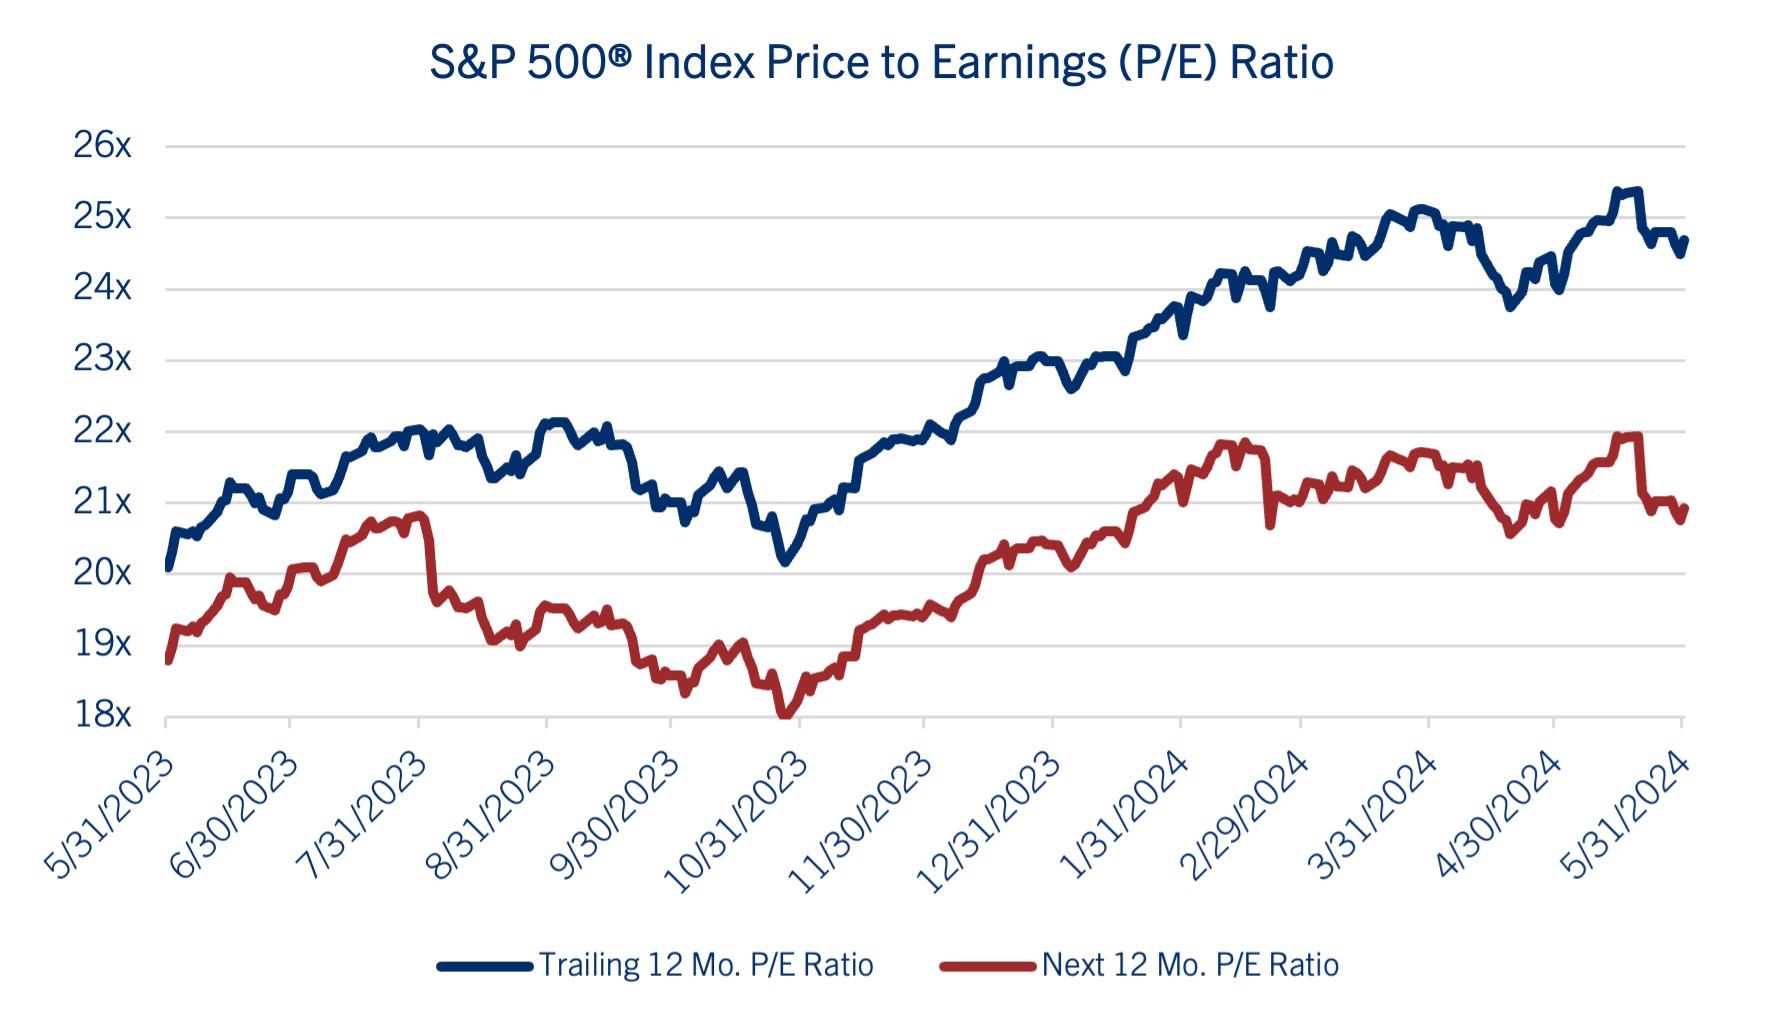
Remember, the “E” must substantiate the “P” when considering valuation.
In this environment, we continue to position diversified portfolios toward benchmark weightings, relative to exposure within capitalization (large vs. small), investment style (growth vs. value) and region (developed vs. emerging). We view the sectors best positioned for leadership include Technology, Energy, Industrials and Materials. A balanced approach at this point in the cycle, in our opinion, will help protect investors from the market risks associated with interest rates, geopolitics and extent of the expansion.
We’ll reassess these forecasts after second quarter earnings season and will publish further thoughts on the presidential election following the political party conventions later this summer.
Be well and stay safe!
*****
IMPORTANT DISCLOSURES
Comerica Wealth Management consists of various divisions and affiliates of Comerica Bank, including Comerica Bank & Trust, N.A. Inc. and Comerica Insurance Services, Inc. and its affiliated insurance agencies.
Comerica Bank and its affiliates do not provide tax or legal advice. Please consult with your tax and legal advisors regarding your specific situation.
Non-deposit Investment products offered by Comerica and its affiliates are not insured by the FDIC, are not deposits or other obligations of or guaranteed by Comerica Bank or any of its affiliates, and are subject to investment risks, including possible loss of the principal invested.
Unless otherwise noted, all statistics herein obtained from Bloomberg L.P.
This is not a complete analysis of every material fact regarding any company, industry or security. The information and materials herein have been obtained from sources we consider to be reliable, but Comerica Wealth Management does not warrant, or guarantee, its completeness or accuracy. Materials prepared by Comerica Wealth Management personnel are based on public information. Facts and views presented in this material have not been reviewed by, and may not reflect information known to, professionals in other business areas of Comerica Wealth Management, including investment banking personnel.
The views expressed are those of the author at the time of writing and are subject to change without notice. We do not assume any liability for losses that may result from the reliance by any person upon any such information or opinions. This material has been distributed for general educational/informational purposes only and should not be considered as investment advice or a recommendation for any particular security, strategy or investment product, or as personalized investment advice.
Diversification does not ensure a profit or protect against a loss in a declining market. Past performance is no guarantee of future returns. The performance of an index is not an exact representation of any particular investment, as you cannot invest directly in an index. The material is not intended as an offer or solicitation for the purchase or sale of any financial instrument. The investments and strategies discussed herein may not be suitable for all clients.
The S&P 500® Index, S&P MidCap 400 Index®, S&P SmallCap 600 Index® and Dow Jones Wilshire 500® (collectively, “S&P® Indices”) are products of S&P Dow Jones Indices, LLC or its affiliates (“SPDJI”) and Standard & Poor’s Financial Services, LLC and has been licensed for use by Comerica Bank, on behalf of itself and its Affiliates. Standard & Poor’s® and S&P® are registered trademarks of Standard & Poor’s Financial Services, LLC (“S&P”) and Dow Jones® is a registered trademark of Dow Jones Trademark Holdings, LLC (“Dow Jones”). The S&P 500®® Index Composite is not sponsored, endorsed, sold or promoted by SPDJI, Dow Jones, S&P, or their respective affiliates and none of such parties make any representation regarding the advisability of investing in such product nor do they have any liability for any errors, omissions, or interruptions of the S&P Indices.
NEITHER S&P DOW JONES INDICES NOR STANDARD & POOR’S FINANCIAL SERVICES, LLC GUARANTEES THE ADEQUACY, ACCURACY, TIMELINESS AND/OR THE COMPLETENESS OF THE WAM STRATEGIES OR ANY DATA RELATED THERETO OR ANY COMMUNICATION, INCLUDING BUT NOT LIMITED TO, ORAL OR WRITTEN COMMUNCATION (INCLUDING ELECTRONIC COMMUNICATIONS) WITH RESPECT THERETO. S&P DOW JONES INDICES AND STANDARD & POOR’S FINANCIAL SERVICES, LLC SHALL NOT BE SUBJECT TO ANY DAMAGES OR LIABILITY FOR ANY ERRORS, OMISSIONS, OR DELAYS THEREIN. S&P DOW JONES INDICES AND STANDARD & POOR’S FINANCIAL SERVICES, LLC MAKE NO EXPRESS OR IMPLIED WARRANTIES, AND EXPRESSLY DISCLAIM ALL WARRANTIES, OR MERCHANTABILITY OR FITNESS FOR A PARTICULAR PURPOSE OR USE OR AS TO RESULTS TO BE OBTAINED BY COMERICA AND ITS AFFILIATES, OR ANY OTHER PERSON OR ENTITY FROM THE USE OF THE S&P INDICES OR WITH RESPECT TO ANY DATA RELATED THERETO. WITHOUT LIMITING ANY OF THE FOREGOING, IN NO EVENT WHATSOEVER SHALL S&P DOW JONES INDICES OR STANDARD & POOR’S FINANCIAL SERVICES, LLC BE LIABLE FOR ANY INDIRECT, SPECIAL, INCIDENTAL, PUNITIVE, OR CONSEQUENTIAL DAMAGES INCLUDING BUT NOT LIMITED TO, LOSS OF PROFITS, TRADING LOSSES, LOST TIME OR GOODWILL, EVEN IF THEY HAVE BEEN ADVISED OF THE POSSIBILITY OF SUCH DAMAGES, WHETHER IN CONTRACT, TORT, STRICT LIABILITY, OR OTHERWISE. THERE ARE NO THIRD-PARTY BENEFICIARIES OF ANY AGREEMENTS OR ARRANGEMENTS BETWEEN S&P DOW JONES INDICES AND COMERICA AND ITS AFFILIATES, OTHER THAN THE LICENSORS OF S&P DOW JONES INDICES.
“Russell 2000® Index and Russell 3000® Index” are trademarks of Russell Investments, licensed for use by Comerica Bank. The source of all returns is Russell Investments. Further redistribution of information is strictly prohibited.
MSCI EAFE® is a trademark of Morgan Stanley Capital International, Inc. (“MSCI”). Source: MSCI. MSCI makes no express or implied warranties or representations and shall have no liability whatsoever with respect to any MSCI data contained herein. The MSCI data may not be further redistributed or used as a basis for other indexes or any securities or financial products. This report is not approved, endorsed, reviewed or produced by MSCI. None of the MSCI data is intended to constitute investment advice or a recommendation to make (or refrain from making) any kind of investment decision and may not be relied on as such.
FTSE International Limited (“FTSE”) © FTSE 2016. FTSE® is a trademark of London Stock Exchange Plc and The Financial Times Limited and is used by FTSE under license. All rights in the FTSE Indices vest in FTSE and/or its licensors. Neither FTSE nor its licensors accept any liability for any errors or omissions in the FTSE Indices or underlying data.comerica.com/insights
Copyright © Comerica Wealth Management