


by Craig Basinger, Chief Market Strategist, Purpose Investments Inc.
Recession risk has continued to fade, as evidenced by the survey of economists. For the UK, Canada, US, Eurozone, China & Japan, the average probability of a recession hit a high in late 2022 at about 60% and has fallen down to a mere 25% of late. The UK, which was as high as 90% and suffered two negative quarters of GDP growth, is now down to 30%, winning the most improved ribbon. Even Canada, which is clearly struggling with higher rates, has improved from over 60% to 30%. Most are clustered around the 30% zone.

The data has improved, with both markets and economists celebrating. This is good news, and perhaps this better economic data will make its way into improving earnings expectations – that’s what counts more. There has been some minor uptick of late, so again, it is encouraging. In addition to this, inflation continues to cool, for the most part, so more central banks should start to walk rates back down in the quarters ahead.
Add that all up – can we justify most equity markets sitting around fresh all-time highs? Or, even more importantly, can we expect more gains to come if this is the start of a new cycle? Fueling the optimistic view is the rising price of copper and other commodities. Copper carries an honorary PhD in economics because of its widespread use in manufacturing, often implying a rising price coincides with rising broader economic activity. And copper has been on a tear.

New cycle? This ain’t that. We would agree with the group view from economists that recession risks are diminished compared with past quarters, but would temper enthusiasm or talk of a new cycle for a number of important factors.
1) Delayed and variable confusing lags or policy
Rate hikes have slowed down economic growth, but that relationship remains intact. But this drag has been muted thanks to accumulated savings during the mobility-reduced period following the pandemic. And from very aggressive fiscal spending just about everywhere in the world, led enthusiastically by the US. The concern is these buffers are starting to roll over or become depleted, which will temper growth going forward.
2) Goods spending, then services spending, now what?
As we highlighted last month, during the stay-at-home period, we all spent money on goods. This blew up supply chains and also supercharged economic growth in 2020-21. In 2022, we all pivoted, to a degree, back to more service spending on travel, eating out, experiences, etc. This made it appear as if a recession was coming since goods spending, manufacturing, and global trade slowed. But alas, it was just a tectonic shift in spending behaviour. Now, goods spending is recovering, but is this robust demand or is it just normalizing from the depressed levels of 2022? Time will tell on this one, but our base case is this is more normalization and not the start of a new cycle.
Normalization is good news but not great news. And with accumulated savings largely depleted due to inflation and a desire to ‘live’ despite the costs, the longevity of this improved economic activity may not endure. Just look at the US consumer. We are not concerned about the level of credit card debt, given that societies are moving towards a cashless world. However, the delinquency rate is concerning, as is the same-store sales at restaurants, which are just a notch above fast food.

Not denying decent employment and wage gains are positives, but it would appear inflation has taken a toll. And those accumulated savings appear to be largely depleted. This is not the behaviour one would expect during the start of robust economic growth; in fact, it is the behaviour often seen near the end of a cycle.
3) And then there is what is priced in
I won’t harp too much on valuations, as everyone kind of knows the deal. The S&P 500 at 21x forward earnings is on the high side, but this has been the case for some time. 15x for the TSX and International equities is not cheap either. The vast majority of market gains this year have come from multiple expansions.
We are not overly negative and currently are carrying just a moderate underweight in equities. However, for this market to move higher, we would need to see continued improvement in global economic growth, which may be challenging. Or inflation to come down materially, alleviating the pressure higher yields elicit on the equity markets. Possible, but not our higher probability path.
Given this we are comfortable with our moderately defensive stance.
Revising cyclical yield in the Canadian dividend space
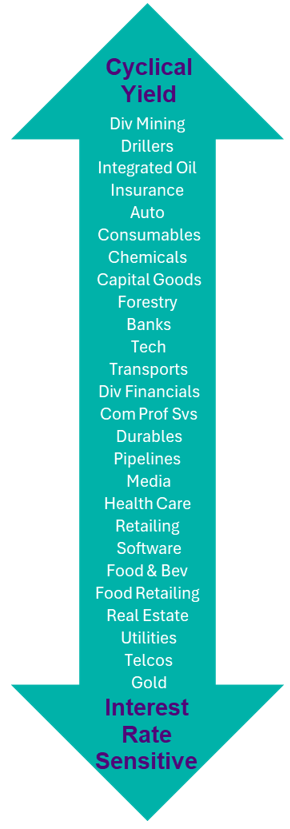
| When it comes to dividend investing, interest rates play a rather large role in determining the relative winners and losers. Not only are dividend stocks sometimes viewed as bond proxies, company earnings can also be quite rate-sensitive. It is through this lens of rate sensitivity that reveals the full spectrum of dividend stocks. On one hand, you have the highly rate-sensitive industries such as Telcos, Utilities and Pipelines and on the other are industries that are much more cyclical. We’ve long used the term cyclical yield to define these companies whose earnings depend much more on the economic cycle compared with the much more defensive rate-sensitive stocks.
Our scoring or ranking system uses a combination of an industry’s correlation to bond yields, sensitivity to bond yields (think like Beta, but instead of relative to the market, it’s relative to yields) and an out-of-sample score for periods over the past decade of rising yields. The chart to the right depicts the full spectrum of sectors/industries within the TSX. The top grouping, Cyclical Yield, are those that we would expect to hold up better in a rising yield environment. The bottom grouping, Interest Rate Sensitive, are those that we would expect to perform best in a falling yield environment. |
 |
We’ve long had a tilt across our dividend mandates towards cyclical-yielding dividend payers. Given the chart below, the cyclical yield has handily outperformed the rate sensitives over the past few years. The outperformance typically comes when yields have been rising. Looking back in the 2010s, there were brief periods when cyclical yield outperformed, but overall rate sensitives did quite well with the tailwind of falling yields. That all changed in late 2020, and cyclical yield has really not looked back.

Deciding when to switch or actively tilt between rate-sensitive vs more cyclical stocks boils down to a few key considerations.
1) Economic Indicators - Cyclicals have thrived during periods of accelerating GDP growth. The resiliency of the US economy has surprised many, and the soft landing has benefited cyclicals. Rates remain stubbornly high, along with inflation. While the path to 2% inflation and how long it will take to get there remains one of the most important macro questions out there, interest rates remain near cycle peaks. Higher-for-longer should hurt cyclicals the longer rates remain restrictive.
2) Business Cycle Phases - The business cycle remains healthy and in expansion territory. Margins have remained historically healthy, and based on the latest earnings quarter, both sales and earnings growth remain strong. While the business cycle remains healthy from a 10,000 ft perspective, when digging into the specific sectors, we do see an interesting trend developing. The chart below aggregates total net income from continuing operations across for both cyclical yield and the rate sensitives. Cyclical earnings peaked back in 2022 and have been trending lower. Conversely, rate-sensitive net income bottomed in late 2022 and has begun to recover. Relative earnings growth favours the rate sensitives, which has been aiding the lower beta tilt seen in the market of late.

3) Market Sentiment - Risk appetite in the market remains strong, and investor sentiment remains decidedly bullish. The AI story continues to drive strong relative performance as investors remain guided by the urge not to miss out. While the relative performance this year has certainly benefited cyclicals over the past few months, rate-sensitive stocks have actually begun to do quite well. In May, the Utilities sector was the second-best performing sector in both Canada and the US Staples, too, have been solid relative winners. This could, in fact, be an early sign that investors are increasingly looking to diversify into lower beta names.
4) Fundamentals - Valuations can sometimes take the back seat to investment decisions, especially in a new ear investment environment. Investors would be wise to remember that excesses are never permanent, and past trends don’t have anything to do with future performance. From a traditional valuation standpoint, certain cyclical sectors (Energy) still appear somewhat cheap, as the average P/E across our cyclical industries is still just 15.3x, compared with 19x for the Canadian rate sensitives. For cyclical companies, a low P/E doesn’t necessarily mean a stock is cheap because the P/E ratio can be misleading. During boom times, earnings tend to be high, which can make the P/E ratio appear low. During downturns, earnings drop significantly, and the P/E goes parabolic or even nonexistent. Low P/Es across the cyclical space can reflect the peak of the business cycle. Rate sensitives might have a higher P/E, but they are also, on average, trading at a sizeable discount to their average valuations. Telecom and Utility sectors, in particular, are trading at nearly a 20% discount. Undervalued assets offer a margin of safety, reducing potential downside risk.
Bond yields have had an extended trend higher, and dividend strategies, especially those tilted more so towards interest rate-sensitive sectors, have had a difficult go. Being active managers, we’ve had a definite tilt towards cyclical yield, which has helped. Looking ahead, the future path of the rates trajectory certainly isn’t as clear as it was back in 2020/2021. The growing consensus believes rates have peaked, and with growth rates slowing, cyclical yield may not be the best place to be. The relative cheapness and recent earnings growth trends in favour of rate-sensitives also make this space more attractive. The recent rise in global interest rates approaching cycle highs, alongside a US market trading at a high valuation (21.4x forward earnings), presents a potential challenge for the stock market. However, this environment can also be viewed as an opportunity. By strategically adding investments with higher interest rate sensitivity and inherent defensiveness, investors can position their portfolios to benefit from falling rates in the same way as increasing duration in a fixed-income portfolio.
Market cycle
After many months of steady improvement, we have seen the Market Cycle signals take a small step lower over the month of May. Market Cycle indicators are comprised of over 40 indicators that have, in the past, proven to be a good forward-looking signal for the broader economy.

Among the 19 US economic signals, two slipped from bullish to bearish. The Citigroup Economic Surprise index turned negative, as the data has generally been coming in softer lately. And NAHB housing activity soured. Two signals also flipped to bearish among the global economic signals. Baltic Freight rates declined, but you could put a positive spin – this is just cooling off concerns about Red Sea travel. DRAM prices fell as well. Rates and Fundamental signals remained stable.

On a sobering note, you can see a score for ‘Better/Worse’ in each category, with either ‘+’ or ‘-’ next to each signal. This measures the direction in which the data has travelled over the past month. Is it getting better or worse? Compared with last month, rates got worse from 3/0 to 0/2. The US economy was stable from 7/12 to 6/13, more worsening than improving but roughly the same as last month. The global economy stayed at 3/5. Fundamentals, following the earnings season, have dropped from 10/2 to 4/8, which is not good as this is a material swing in momentum.
Overall, it just highlights some deterioration in direction, but that does change often.
The only change we have made from a strategic allocation perspective is increasing exposure to emerging markets. After being underweight emerging markets for many years, we are now back to neutral. This was predicated on an elevated valuation spread between emerging markets and developed markets. Plus, improving global trade and relative earnings growth.
Outside this change we remain moderately underweight equities, holding a bit more bonds and cash. Among equities, we are a bit underweight in US equities and overweight internationals. Bonds have us carrying a bit higher duration.

Final thoughts
Maybe the summer months will see quiet markets, or maybe this lack of volatility across many asset classes is the calm before a storm. One thing is certain: gains have been good lately, and becoming or remaining defensive feels appropriate. The back half of this year certainly has more challenges than the first half. We are going to see a big US election. We will also likely see if this uptick in global growth is a bounce or the start of something sustainable. And maybe there will be a broader central bank pivot.
The only certainty is that this calm won’t last.
— Craig Basinger is the Chief Market Strategist at Purpose Investments
— Derek Benedet is a Portfolio Manager at Purpose Investments
— Brett Gustafson is a Portfolio Analyst at Purpose Investments
Get the latest market insights to your inbox every week.
Sources: Charts are sourced to Bloomberg L. P.
The content of this document is for informational purposes only and is not being provided in the context of an offering of any securities described herein, nor is it a recommendation or solicitation to buy, hold or sell any security. The information is not investment advice, nor is it tailored to the needs or circumstances of any investor. Information contained in this document is not, and under no circumstances is it to be construed as, an offering memorandum, prospectus, advertisement or public offering of securities. No securities commission or similar regulatory authority has reviewed this document, and any representation to the contrary is an offence. Information contained in this document is believed to be accurate and reliable; however, we cannot guarantee that it is complete or current at all times. The information provided is subject to change without notice.
Commissions, trailing commissions, management fees and expenses all may be associated with investment funds. Please read the prospectus before investing. If the securities are purchased or sold on a stock exchange, you may pay more or receive less than the current net asset value. Investment funds are not guaranteed, their values change frequently, and past performance may not be repeated. Certain statements in this document are forward-looking. Forward-looking statements (“FLS”) are statements that are predictive in nature, depend on or refer to future events or conditions, or that include words such as “may,” “will,” “should,” “could,” “expect,” “anticipate,” intend,” “plan,” “believe,” “estimate” or other similar expressions. Statements that look forward in time or include anything other than historical information are subject to risks and uncertainties, and actual results, actions or events could differ materially from those set forth in the FLS. FLS are not guarantees of future performance and are, by their nature, based on numerous assumptions. Although the FLS contained in this document are based upon what Purpose Investments and the portfolio manager believe to be reasonable assumptions, Purpose Investments and the portfolio manager cannot assure that actual results will be consistent with these FLS. The reader is cautioned to consider the FLS carefully and not to place undue reliance on the FLS. Unless required by applicable law, it is not undertaken, and specifically disclaimed, that there is any intention or obligation to update or revise FLS, whether as a result of new information, future events or otherwise.
Copyright © Purpose Investments Inc.