
by Frank Holmes, CEO, CIO, U.S. Global Investors
The January effect, named for the perceived market anomaly where stock returns in January are higher than in other months...
The January effect, named for the perceived market anomaly where stock returns in January are higher than in other months, has been a subject of interest since it was first written about in 1942.
Traditionally, this effect has been attributed to tax-loss harvesting at the end of the year, where investors dump their laggards to offset capital gains taxes, leading to a December selloff. This is believed to be followed by a buying spree in January, as investors repurchase stocks, boosting demand and prices.
Other explanations for the January effect include the influx of cash from year-end bonuses into the stock market, the rise of tax-sheltered retirement accounts (IRAs, 401(k)s, etc.) and the prevalence of new investment instruments and regulatory changes.
Then there’s also a perceived increase in investment activity as people follow through on New Year’s resolutions to invest more. January, after all, has long been associated with fresh starts and positive animal spirits. A recent YouGov poll found that about a third of American adults made New Year’s resolutions for 2024.
From Leader to Laggard
The January effect may have been a pronounced trend in the past, but in more recent years, it’s delivered diminishing returns.
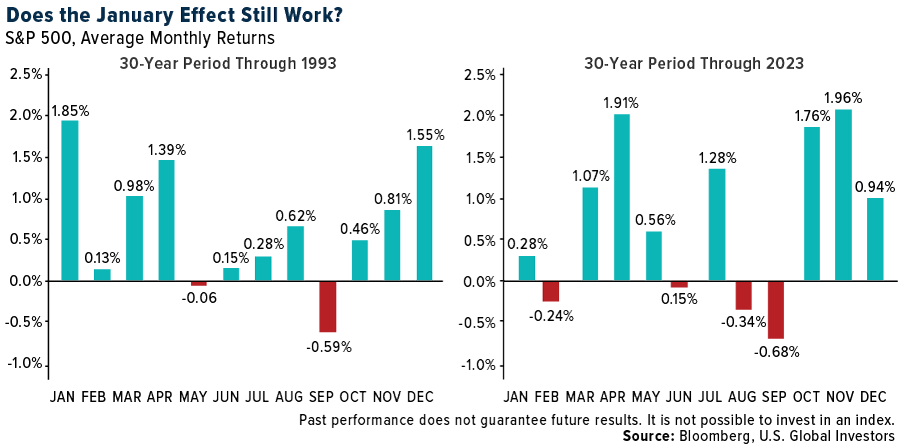
Take a look at the visual below. It shows average monthly gains for the S&P 500 during two time periods: the 30-year period through the end of 1993, and the subsequent 30-year period through the end of 2023. As you can see in the bar chart on the left, January was the top month for returns, with stocks rising 1.85% in value on average. That’s well above December, the number two month, when the stock market was up an average 1.55%.
Something shifted over the next 30 years, though, and January no longer ranked first, falling to the eighth best month with stocks advancing only 0.28%.
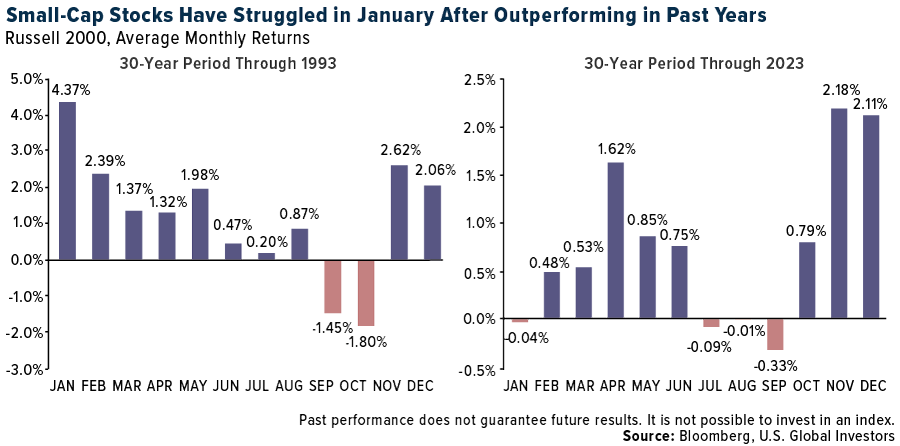
The same observation can be made with regard to small-cap stocks. During the pre-1993 period, the Russell 2000 easily outperformed during the month of January, rising an astonishing 4.37% on average. This huge monthly gain deteriorated to a slight loss over the next 30 years, while November and December became the hands-down leaders.
So what happened? Perhaps nothing. Perhaps the phenomenon is still in effect, it just shrunk to have a shorter duration.
Whatever the explanation, I encourage investors and traders to approach this phenomenon with a healthy dose of skepticism. I believe participants are better served by keeping their eyes on market fundamentals and long-term macroeconomic trends instead of trying to exploit an increasingly questionable anomaly.
The 2024 Election Year: A New Layer of Complexity
As you’ve heard me say a number of times, government policy is a precursor to change, and if that’s the case, 2024 is poised to bring about plenty of change that investors need to be aware of. Depending on the source, between 40 and 50 national elections are scheduled to take place this year, making it the biggest year on record for national elections.
Bloomberg Economics calculates that voters in countries representing 41% of the world’s population and 42% of its gross domestic product (GDP) have the opportunity to choose new leaders this year. That includes voters in the U.S., who appear headed for another rematch between former president Donald Trump and incumbent Joe Biden.
Other big-name leaders facing reelection in 2024 are India’s Narendra Modi, Venezuela’s Nicolas Maduro and rivals Vladimir Putin of Russia and Volodymyr Zelenskyy of Ukraine.
2024: Biggest Election Year In History?
Zoom level changed to 1
Source: SIS Global Election Tracker, U.S. Global Investors
Historically, election years have been favorable for stock markets. Since 1928, the S&P 500 has advanced 7.5% on average during these years, while stocks recorded positive gains 75% of the time, according to RBC Wealth Management.
But again, relying solely on historical patterns can be misleading. I believe it’s far more important to understand the underlying economic indicators, company performance and broader market trends that drive long-term value. Investors should also prioritize portfolio diversification, ensuring a mix of assets that align with their risk tolerance and investment goals.
As always, I recommend a 10% weighting in gold, with half invested in physical gold (bars, coins, jewelry) and the other half in high-quality gold mining stocks, mutual funds and ETFs.
*****
The S&P 500 Index (Standard & Poor’s 500 Index) is a market-capitalization-weighted index of the 500 leading publicly traded companies in the U.S. The Russell 2000 Index is comprised of the smallest 2000 companies in the Russell 3000 Index, representing approximately 8% of the Russell 3000 total market capitalization.
All opinions expressed and data provided are subject to change without notice. Some of these opinions may not be appropriate to every investor. By clicking the link(s) above, you will be directed to a third-party website(s). U.S. Global Investors does not endorse all information supplied by this/these website(s) and is not responsible for its/their content.
Copyright © U.S. Global Investors