Growing earnings and falling rates could fuel this bull market.
Key takeaways
- The market is ending 2023 on a high note, after an impressive and broad-based rally in recent weeks.
- The Fed signaled in its most recent release that as many as 3 rate cuts could be on the horizon in 2024—news that has been welcomed by markets.
- 2024 could see a continued broad-based bull market if, as expected, the Fed pivots, earnings advance, and the economy continues to avoid recession.
- Key risks to this outlook are that inflation pressures could rise again, forcing the Fed to walk back on rate cuts, and that much of the soft-landing narrative has already been priced into the market.
While we may be closing in on the darkest days of the year, in the markets it feels practically like spring—with stocks and bonds making strong gains in recent weeks as investors have welcomed the likely end of the Fed’s long rate-hiking campaign.
For 2024, my base-case scenario is that this bull market will keep marching. As long as we continue to avoid a recession, the market could even reach new all-time highs.
That said, with markets there are always risks, and no outlook can ever be given with 100% certainty. Read on for my full analysis.
A Santa rally to remember
To say that the markets are finishing 2023 on a strong note would be an understatement. While most of 2023 was characterized by extremely narrow leadership—with only a handful of mega-cap stocks gaining ground and the rest of the market languishing—that all changed around the start of November, when investors began to gain confidence that the Fed really had finished raising rates.
Since then, a broad-based rally has carried stocks and bonds higher. Last week, the Fed released new economic projections that suggest a likelihood of rate cuts in 2024, which added conviction to the narrative that rate hikes may be over, and added fuel to the market’s rally.
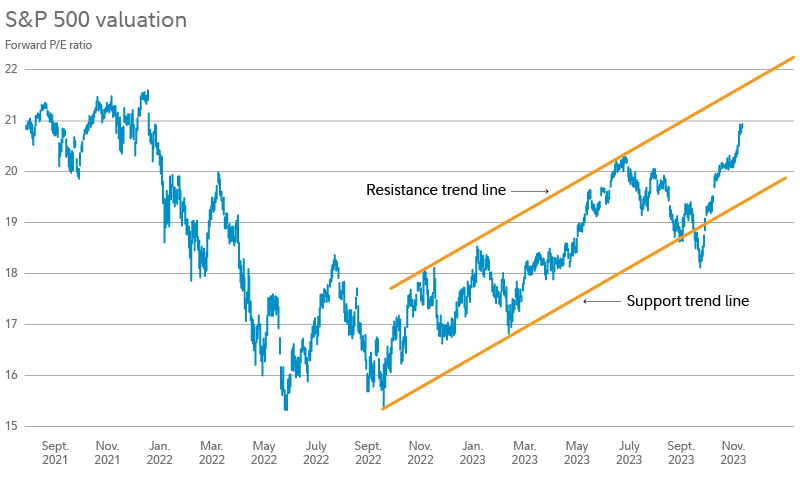
Santa has delivered the goods. As of last week, S&P 500® and the S&P’s price-earnings (P/E) ratio had reached a new recovery high, and were within striking distance of the all-time highs set in January 2022.
 Past performance is no guarantee of future results. Source: FMRCo., Bloomberg.While the S&P was already in positive territory for the year before this recent rally, what’s been particularly significant has been how broad-based this rally has been—with most stocks joining in on the gains. For example, prior to this rally the S&P 500 equal-weighted index, which is less influenced by stock-price movements of the largest companies, had been generally trading sideways. But it is now also approaching the all-time highs, and some 90% of stocks in the index were recently trading above their 50-day moving averages. Even small caps have finally started to find some strength in the past few weeks.
The Fed projects a pivot
Driving this rally has been, as already mentioned, investors’ optimism that the Fed may finally be finished raising rates. While the Fed had been saying for months that investors shouldn’t expect rate cuts anytime too soon, it seemed to change its tune after last week’s Federal Open Market Committee meeting.
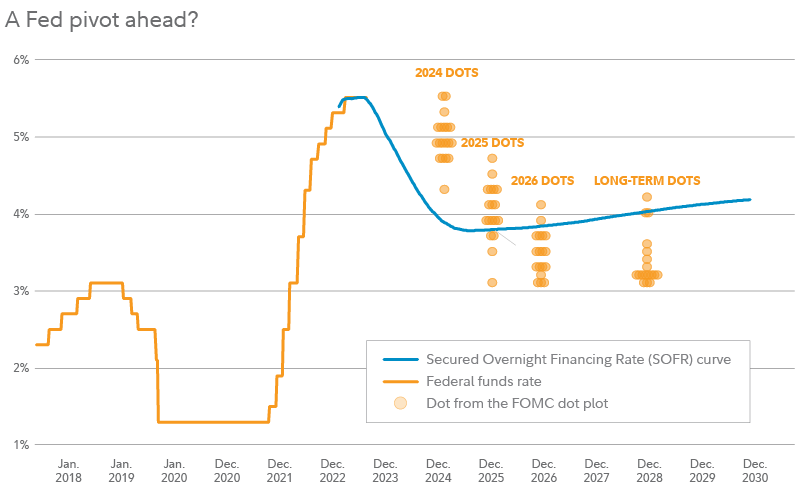
The big news came in the Fed’s newly updated dot plot, which shows each individual committee member’s personal assessment of appropriate monetary policy for coming years and the long run, via a chart of anonymous dots. The new dot plot suggests that there could be 3 rate cuts in 2024 (although the market has quickly priced in more than that).
 The Secured Overnight Financing Rate (SOFR) curve shows implied estimates for future interest rates that are embedded into current yield curves. Each dot represents an FOMC participant’s assessment of appropriate monetary policy for a future period, based on the dot plot released on December 13, 2023. Source: FMRCo., Bloomberg.The rationale behind cuts is intuitive: With inflation now steadily improving from its June 2022 peak, it seems the Fed should be able to “give back” some of its rate hikes. Why stay restrictive if the emergency has passed? It makes total sense, but the question may be how quickly and how much it can safely give back.
Outlook for 2024
This brings me back to my base case for 2024, which is a continuing bull market as the Fed pivots (at least initially), earnings advance, and the economy survives the great hiking cycle of 2022 to 2023. My strong hunch, based on market history, is that the bull market will broaden in 2024—with a wide range of types of stocks advancing—rather than the narrow leadership we saw for much of 2023. But this is not a slam dunk.
On the point of earnings, it appears that the earnings contraction is already behind us, with earnings likely bottoming in the third quarter of 2023. The expected earnings growth rate for 2023 has been stable at negative 4%, so it looks like that is where we will finish the year. After a 50% earnings gain in 2021 and an 8% gain in 2022, a 4% earnings contraction is about as soft as soft landings get.
Another important mile marker for investors to note is that the S&P hit its all-time highs almost 2 years ago, in early January 2022 (which also marked the starting point of that year’s bear market). This is a long time to remain below the previous all-time high. Looking at all bear markets historically, the market has taken a median of 48 months to travel back to its preceding peak. But bear markets that do not include a recession—such as the 2022 bear market—have historically taken only 11 months to recover.
This means that unless we are about to enter a recession, we may be due for new highs.
Risks to the outlook
There are 2 main risks to this view, as far as I can see.
One is that the Fed could have to walk back on the narrative of rate cuts. Even if the Fed sticks the soft landing, pivoting to rate cuts too soon could threaten its progress on bringing core inflation down further toward its target zone—by reigniting investors’ animal spirits and triggering a loosening of financial conditions. While I agree that giving back a few rate hikes makes sense, a hawkish pivot down the road seems like a bigger risk than a hard landing.
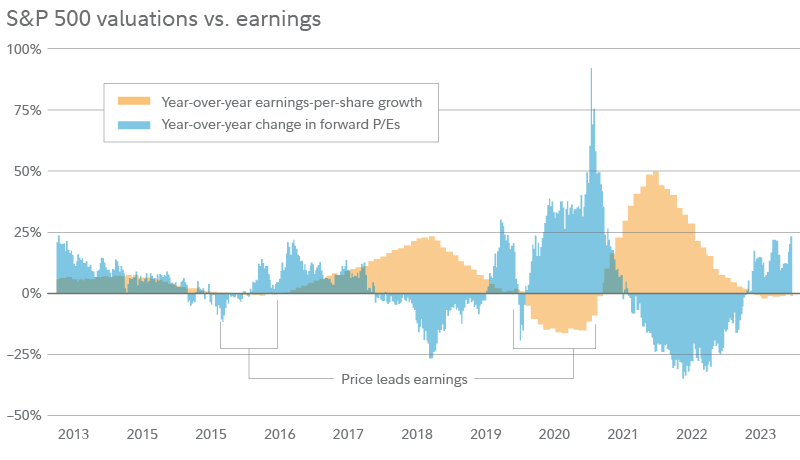
The other risk is that most of the soft-landing narrative may already be priced into the market, leaving little room for significant further gains. The S&P’s forward P/E ratio (meaning price divided by consensus earnings expectations) has gained 5.5 points since its low of 15.3 in October 2022. It made those gains in anticipation of an earnings recovery, which is now happening. But if earnings do continue to grow from here, the impact on stock prices could be muted by falling P/E ratios. The chart below reminds us that P/E ratios are often zigging while earnings are zagging.
 Based on data for S&P 500 constituent companies. Forward P/E is stock price divided by consensus earnings estimates for the following 12 months. Weekly data. Source: FMRCo., Bloomberg.
The market continues its dance
Of course, any market outlook is part science and part art—part analysis and part intuition. I think of the range of market outcomes as a bell curve distribution, with the market narrative performing a dance from the left tail (recession) to the right (inflation), back and forth, like waves in the ocean. We started 2023 with fears of a left tail, and by the summer we were preparing for the right tail. Now, as we close the year and look ahead to 2024, we are back in the middle, where Goldilocks lives.
In which direction will the dance take us in 2024? My hunch is the right tail, but I think that’s a narrative to watch for the second half of the year. Either way, I am prepared to be wrong, which is why I own a balanced mix of stocks and bonds, plus a little bit of a few other things.
One thing is for sure though: The market usually doesn’t stay in one place for too long.


