by Jared Franz, Lawrence Kymisis, Diana Wagner, Capital Group
KEY TAKEAWAYS
- A corporate earnings rebound could boost stocks in 2024
- Investors’ stock portfolios may be too concentrated
- Economic uncertainty means diversification is crucial
- Compelling trends are emerging in international markets
- Dividends can help offset risks associated with growth stocks
A strong corporate earnings rebound could be the tailwind that drives stock prices in 2024.
Heading into the new year, the economy continues to send mixed signals. But when it comes to the stock market, one key metric is clear: corporate earnings.
In the U.S., Wall Street analysts expect earnings for companies in the S&P 500 Index to rise nearly 12% in 2024, in U.S. dollar terms, based on consensus data compiled by FactSet. That’s along with an expected 6.1% earnings boost in international markets and a robust 18% gain in emerging markets.
Solid earnings growth is expected across major markets

Sources: Capital Group, FactSet, MSCI, Standard & Poor’s. Estimated annual earnings growth is represented by the mean consensus earnings per share estimates for the years ending December 2023 and December 2024, respectively, across the S&P 500 Index (U.S.), MSCI EAFE Index (developed international) and MSCI Emerging Markets Index (emerging markets). Estimates are as of November 30, 2023.
Given the difficulties of 2023, it’s logical to expect an earnings rebound in 2024. But there are several risks that could result in substantial earnings revisions, including sluggish consumer spending, slowing economic growth in Europe and China, and rising geopolitical risk from the wars in Ukraine and Israel.
“I don’t think it’s going to be a terrible year for corporate earnings, but I think we’re more likely to see 6% to 8% growth in the U.S.,” says Capital Group economist Jared Franz, “and potentially higher in some emerging markets.”
Investors might look to 2023’s market leaders — U.S. mega-cap stocks driving the artificial intelligence (AI) revolution — as a continued source of strength in 2024 as applications roll out across the economy and potentially lead to further earnings growth.
Investor stock portfolios may be overconcentrated
However, you’ve probably heard by now that the U.S. stock market is top-heavy. What you might not know is the S&P 500 Index is more heavily concentrated than it was at the peak of the dot-com era.
As of September, the five largest companies in the S&P 500 accounted for 24% of the market capitalization of the index. That compares with a 19% weighting for the five largest companies in the index as of March 2000.
As for market gains, just seven companies — Apple, Meta, Microsoft, NVIDIA, Amazon, Alphabet and Tesla — accounted for a staggering 130% of the index’s total return in the first 10 months of 2023. In other words, without the so-called Magnificent Seven, the S&P 500 would have posted a decline.
The risk of concentration (and what to do about it)
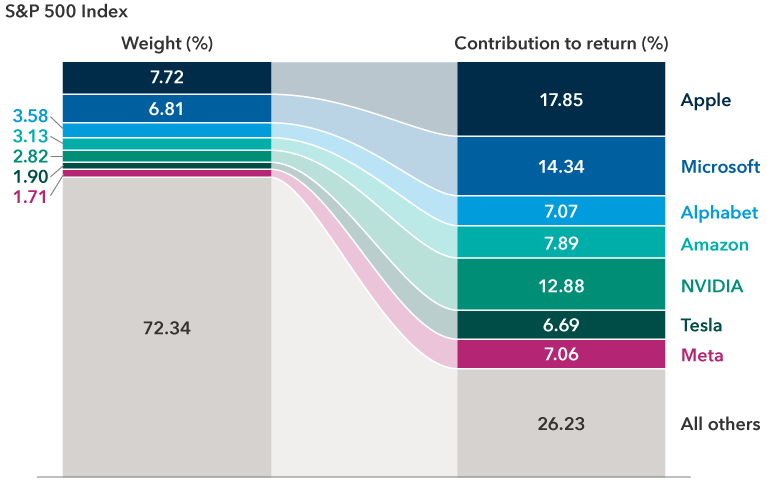
Source: FactSet. Weighted values for Apple, Microsoft, Alphabet, Amazon, NVIDIA, Tesla and Meta as of June 30, 2023. Contribution to return calculated from January 2, 2023, to June 30, 2023.
Diversification remains essential
Such levels of concentration represent potential risks for investors, particularly those in passive index investments, which seek to replicate a benchmark’s return pattern. While tech innovators may very well continue to lead in 2024, investors should consider diversifying their stock holdings, where applicable, according to equity portfolio manager Lawrence Kymisis.
“Many of these tech leaders can continue to be good long-term investments, but I think investors should be wary of investing in a small number of companies with similar business models at such concentrated levels,” says Kymisis. “Given the level of economic uncertainty heading into 2024, I believe diversification is as essential as ever. And I believe we at Capital Group can identify great companies across industries in markets around the world, including U.S. tech leaders.”
A quick comparison of major international equity indices with the S&P 500 shows non-U.S. markets are less concentrated and suggests they may offer a broader range of opportunities. As of October 31, 2023, the 10 largest companies in the S&P 500 accounted for a 31.2% weighting of the index. In contrast, the 10 largest companies in the MSCI EAFE Index, a broad measure of developed non-U.S. markets, accounted for 15.2% of the index weighting.
The S&P 500 is top-heavy relative to history and international markets

Sources: Capital Group, Morningstar. Data as of October 31, 2023.
Compelling trends are surfacing across international markets
“That is not to suggest any form of diversification will benefit investors,” Kymisis adds. “There are plenty of fish in the sea, but our job as active portfolio managers is to identify those companies with the potential to be among the next wave of market leaders.”
U.S. technology giants do not hold a monopoly on innovation. Europe is home to pioneering companies driving breakthroughs across health care, aerospace and other industries.
For example, AstraZeneca, the British-Swedish COVID vaccine developer and maker of lung cancer treatment Tagrisso, has invested aggressively in research and development, resulting in a deep pipeline of oncological and rare disease therapies in late-stage development.
Air travel is a secular growth industry in a lot of countries, and demand is growing for new airplanes. With regulators in Europe and across the globe imposing stricter emissions requirements, innovation will also be key in solving sustainability challenges in the aerospace industry.
“Airlines will be incentivized to order the newest, most efficient planes, creating a tailwind for leading-edge manufacturers,” says Michael Cohen, a portfolio manager for Capital Group International Equity FundTM (Canada).
To illustrate this theme of seeking efficiency, France’s Safran, the world’s top producer of narrow-body aircraft engines, through its partnership with General Electric, is developing engines that could reduce emissions by 20%.
Europe is home to innovators across a range of industries
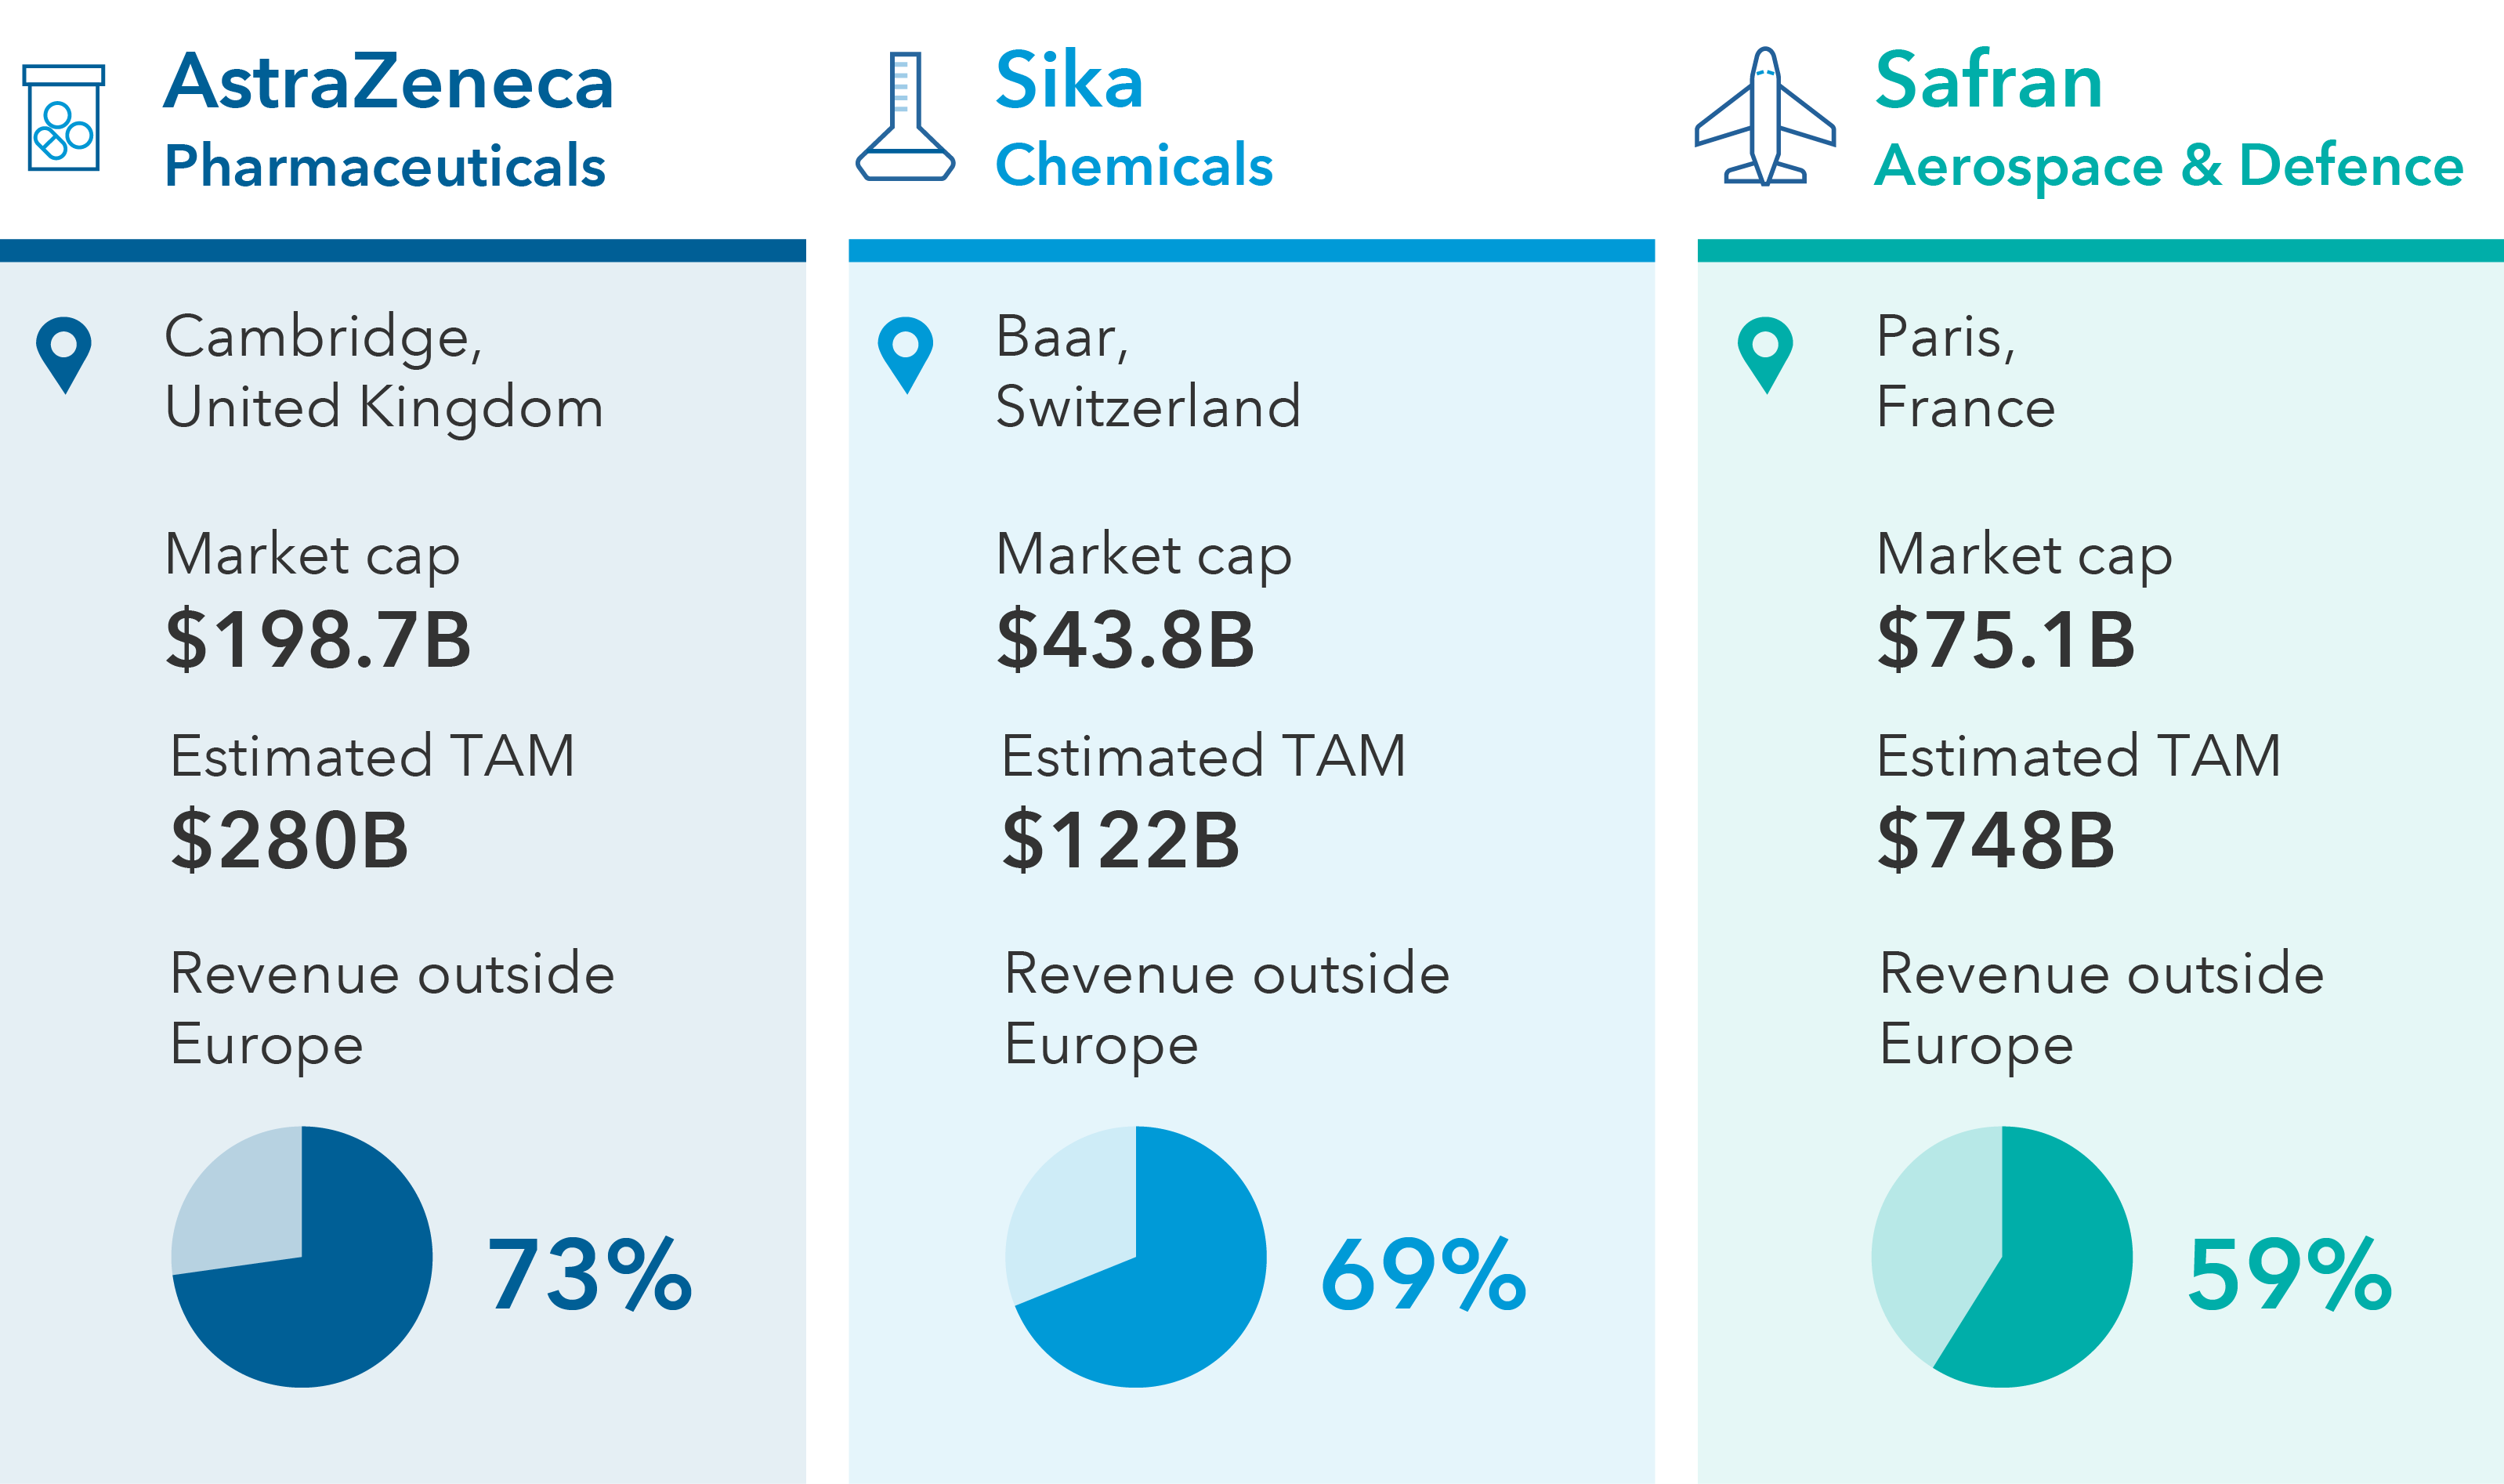
Sources: Capital Group, Aviation Week Intelligence Network, company reports, FactSet, Global Market Insights, MSCI. Companies above serve as examples of European companies across selected industries with geographically diversified revenue bases; each of the selected companies is among the top 10 largest companies by market value for their respective industries within the MSCI Europe Index. Geographic revenue percentages represent estimates from FactSet based on the most recently reported company figures, as of November 30, 2023. "TAM" represents total addressable market. Values in USD.
Japan takes steps to unlock value for investors
Despite strong headwinds in the Japanese economy, a few innovative Japanese firms have built durable businesses with highly defensible moats. For instance, SMC is a leader in robotic equipment components and semiconductor production, and TDK is among the largest manufacturers of high-end electric vehicle batteries.
Many Japanese companies have been known for hoarding cash and subpar governance. But government leaders and the Tokyo Stock Exchange are urging firms to adopt reforms to improve profitability and boost stock valuations. Among the reforms are steps to reduce cash on balance sheets and shed underperforming businesses. About a third of Japanese companies have price-to-book values (a financial metric used to compare the book value of a company with its market capitalization) lower than the value of their underlying assets.
Sustained reforms could unlock opportunities across industries.
Emerging markets come out of China’s shadow
In emerging markets, China may dominate headlines, but opportunities are growing in countries such as India, Indonesia and Mexico, regions where Infrastructure growth is accelerating, government balance sheets are stronger and supply chain shifts are boosting regional economies.
New roads, housing developments and industrial parks have left parts of India unrecognizable from just a few years ago. Indonesia is attracting foreign investment to build out the electric vehicle supply chain. And Mexico is becoming a reshoring hub, as Western economies look to reconfigure supply chains.
Investment opportunities range from banks to airplane component makers to real estate developers to mining and consumer-related companies. Meanwhile, the rapid expansion of mobile-based technology platforms is tapping into demand for consumer services.
Emerging market opportunities beyond China
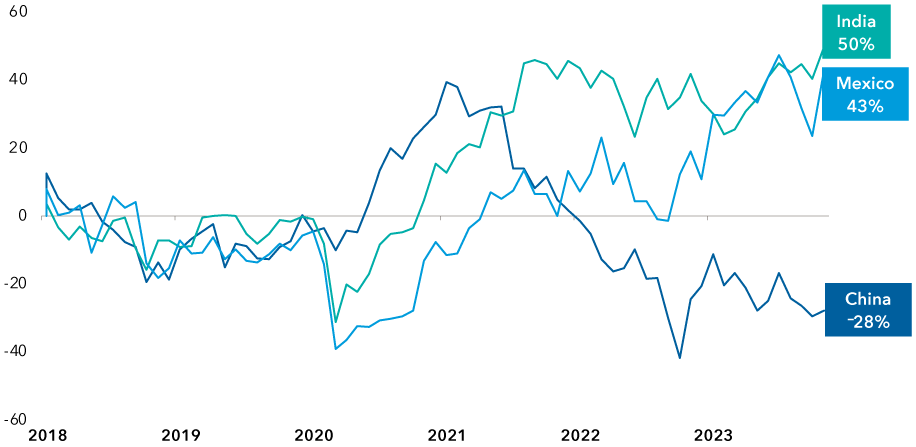
Sources: MSCI, RIMES. Returns reflect MSCI India Index, MSCI Mexico Index, and MSCI China Index in U.S. dollars. Five-year period shown to reflect returns pre- and post-COVID. Data as of October 31. 2023. The indicies are unmanaged and, therefore, have no expenses. Investors cannot invest directly in an index.
Dividend payers offer diversification potential
While investors watched the powerful AI-dominated market rally, valuations for dividend-paying stocks quietly drifted toward multi-decade lows compared to the broader market. With economic growth expected to moderate in 2024, and the potential for recession lingering, dividends may take a more prominent role in driving total returns for investors.
Valuations for high dividend payers are far below the market average

Sources: Capital Group, Goldman Sachs. As of November 28, 2023. High dividend stocks refer to the cohort of stocks in the S&P 500 Index with the highest quintile dividend yield (sector-neutral) within the index. Line represents smoothed six-month average. P/E ratio = price-to-earnings ratio. Past results are not predictive of results in future periods.
Select dividend payers across a variety of industries are adopting strategies to drive demand for their offerings. For example, U.S. retail pharmacy CVS Health is launching a new division that will work with drugmakers to produce biosimilar versions of leading therapies that are more affordable.
Other dividend payers, whose offerings tend to maintain steady demand through market cycles, can offer a measure of stability. For example, many of beverage maker Keurig Dr Pepper’s offerings, like Canada Dry and Snapple, have strong brand recognition and a history of relatively stable demand through business cycles.
“It is difficult to know when a cycle will turn, so investors may want to look for companies with growth potential as well as businesses that pay dividends, which can help mitigate market volatility,” says Diana Wagner, an equity portfolio manager. “Valuation is important, but it is essential to distinguish between real values and companies with deteriorating business prospects.”
Jared Franz is an economist with 17 years of industry experience (as of 12/31/2022). He holds a PhD in economics from the University of Illinois at Chicago and a bachelor’s degree in mathematics from Northwestern University.
Lawrence Kymisis is an equity portfolio manager at Capital Group with 28 years of experience (as of 12/31/2021). He holds a master’s degree in economics from the London School of Economics and a bachelor’s degree in economics & politics from the University of Bristol.
Diana Wagner is an equity portfolio manager with 26 years of investment experience (as of 12/31/2022). She holds an MBA from Columbia Business School and a bachelor’s degree in art history from Yale.
Copyright © Capital Group