by MFS Investment Management
Why consider an allocation to both US and non-US companies? We believe that the starting point for market today is vastly different from that of the past decade. And, with rising rates, higher inflation, and shrinking liquidity, investors who seek the best companies across the global markets could help maximize portfolio returns.
Key takeaways
- Coming out of the global financial crisis, rates and inflation were low and headed lower, and liquidity was high. Today, rates and inflation are meaningfully higher, and liquidity is shrinking. Starting points matter.
- Generally, investing in the best companies — those with pricing power and margin stability — in the US as well as non-US, versus just buying a region or style — buying a factor — could help maximize returns for investors while providing the benefits of diversification.
- Many companies that have been overshadowed by mega-cap technology companies appear positioned to benefit from future trends such as increased capex spending (versus opex only), the energy transition and decarbonization, as well as the reshoring and the localization of supply chains.
In my experience, only a few market tenets stand the test of time. One of them is that starting points matter, which is particularly relevant today. I think we can all agree that if you take today as a starting point, investing over the next ten years will likely be quite different from investing in the past ten years. The level of interest rates and inflation, the likelihood of additional liquidity from central banks, equity valuations and profit margins — all these factors look quite different than they did at the start of the bull market that followed the global financial crisis (GFC).
Today as a starting point
Let’s focus first on inflation, interest rates and central bank liquidity. Today, central banks around the globe have aggressively raised interest rates to combat high inflation in the wake of the unprecedented stimulus coming out of the pandemic, on top of the massive stimulus following the GFC. Moving forward, central banks will not only be reluctant to dig into their old bag of tricks but also unable to do so given their elevated balance sheets.
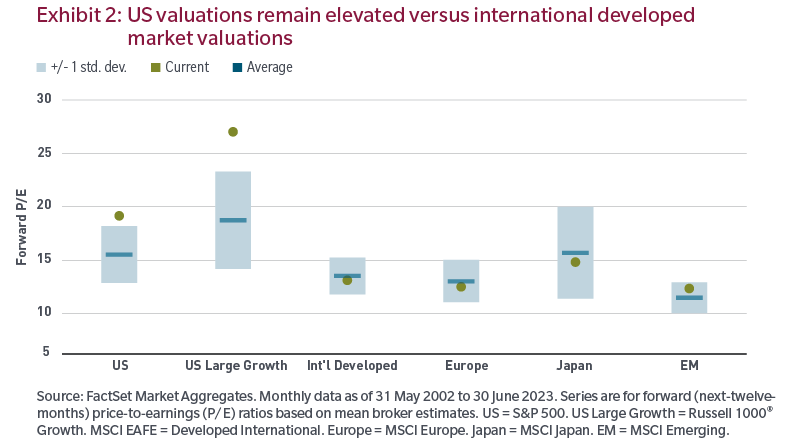
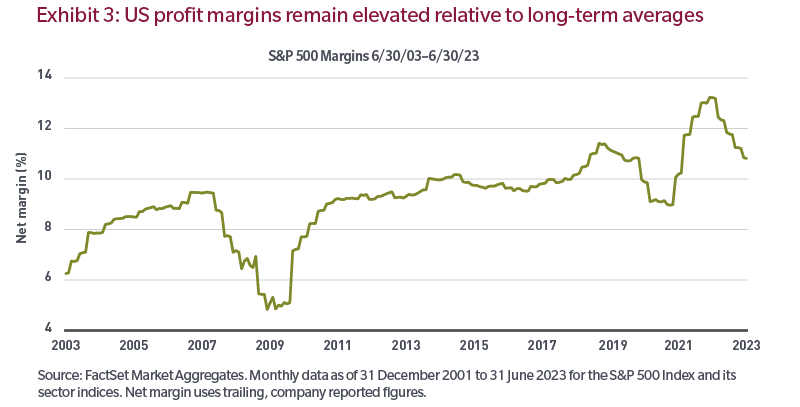
In other words, the loose monetary policy of the past decade may well remain a thing of the past. Investors can no longer rely on free money to drive equity valuations higher or fuel earnings growth through stock buybacks or other forms of financial engineering. This is most apparent in the United States, where valuations are still well above long-term averages (Exhibit 2) and profit margins remain elevated despite the prospect of rising labor and material costs and a slowdown in global growth (Exhibit 3).
This environment has understandably left many investors struggling with their asset allocation as they seek to determine market leadership moving forward. This generally leads investors to extrapolate the recent past to the present, expecting the same outcomes (e.g., strong US outperformance). Unfortunately, this overemphasis on the near term puts most investors two steps behind the market, with little chance of catching up. This environment — high inflation and a reversal of monetary policy coupled with lofty valuations and elevated margins — has left investors in a quandary about their asset allocation, but it is also reminiscent of the last time non-US equities witnessed a sustained period of outperformance relative to their US counterparts. And, in our view, created the potential for a lower-return environment for equities moving forward. Again, starting points matter.
Today’s backdrop is similar to the post dot-com era
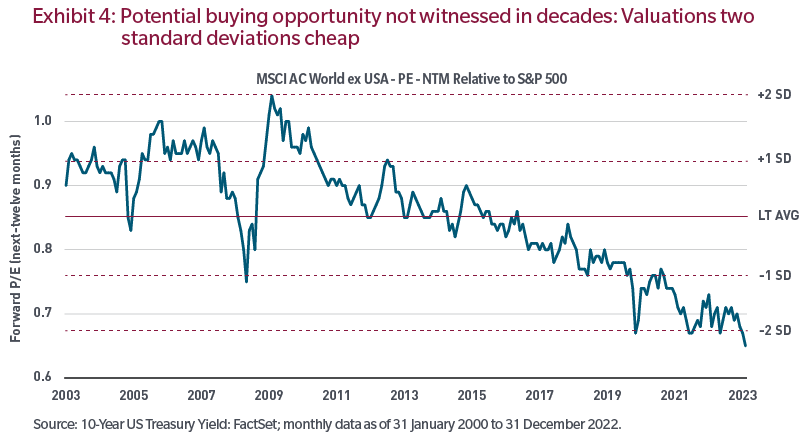
From the end of the dot-com era up until the early days of the GFC, non-US stocks meaningfully outperformed their US counterparts. The MSCI ACWI ex US Index returned 69.6% on a cumulative basis versus the S&P 500 return of just 14.1% from the start of 2000 through 2007. And while no two periods are exactly alike, today’s environment is similar to the roughly eight-year period following the bursting of the dot-com bubble. First non-US valuations potentially offer investors a buying opportunity not seen in decades (Exhibit 4), as valuations are close to two standard deviations cheap relative to US equities.
Second, inflation and interest rates during the mid-2000's are more aligned with today’s reality than they were in the decade following the GFC to the end of the COVID pandemic. In fact, from 2000 through the end of 2007, the 10-year US Treasury yield averaged 4.7% and global inflation averaged 3.7% (Exhibit 5). This is dramatically different from post-GFC, when inflation was essentially nonexistent and yields were close to zero or even in negative territory globally.

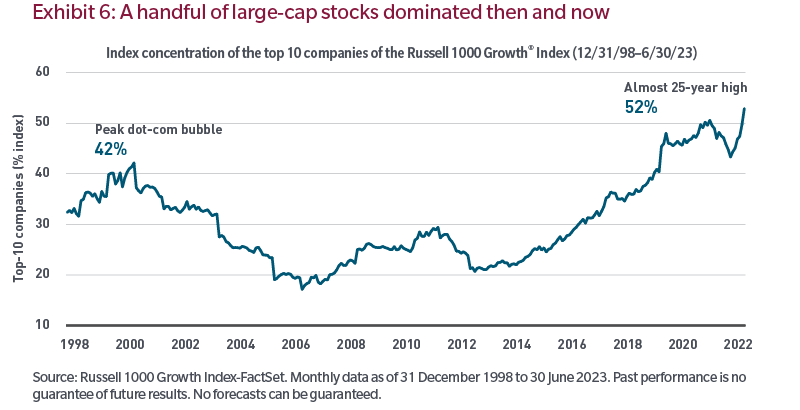
Markets during this period also witnessed a dramatic selloff as the dot-com bubble burst, driven largely by high-flying technology stocks with unattainable growth expectations — think irrational exuberance. Looking at the concentration of the Russell 1000® Growth Index today, similarities are again apparent (Exhibit 6).
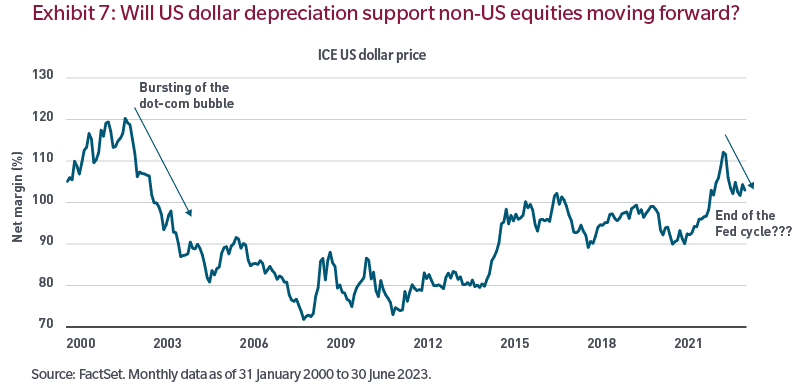
Of note, in the aftermath of the dot-com bubble, as interest rate differentials favored non-US markets and equity investors sought opportunity outside the US, the US dollar depreciated by 40% from its market peak through 2007. From a US investor perspective, this depreciation added to non-US local stock returns as those returns were converted to US dollars. Today, the US dollar remains strong versus history but has depreciated by 11% in the past nine months as the end of the Fed’s tightening efforts appears to be in sight (Exhibit 7).
Lastly, the return environment is another key comparison between the post dot-com period and expectations for the next ten years. Back then, while non-US stocks outperformed US equities, returns generally were subdued: On an annualized basis, the MSCI ACWI ex US Index returned 6.8% versus the S&P 500 return of 1.7% from 2000 to 2007.
Finding returns in a potentially lower-return environment
In a world of lower returns, the importance of beta is diminished and the importance of alpha amplified. In such an environment, if you can identify businesses that have the potential to drive their stock prices through earnings growth, valuation and dividends, you can provide investors with the opportunity to potentially maximize long-term returns.
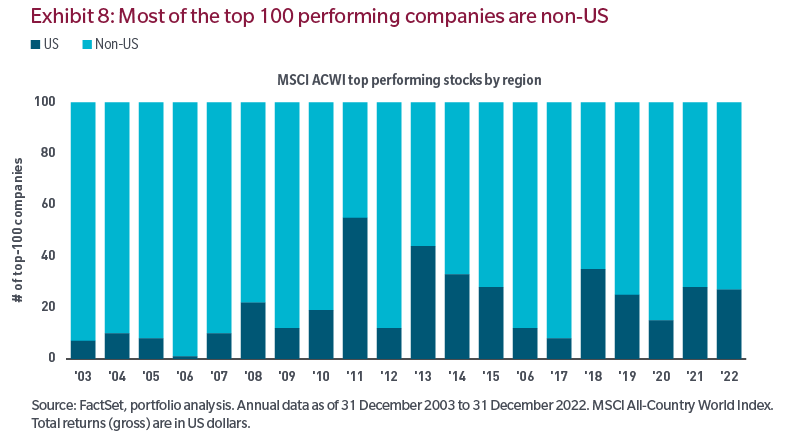
With more than a decade of underperformance from international stocks, it’s natural to ask, “Why own international stocks at all?” Taking today as a starting point for US stocks, perhaps investors should be asking, “Where can we find the best companies that will benefit from price appreciation, fueled by earnings growth, valuation and dividends?” Considering today’s backdrop, these companies are probably located around the globe and a singular regional factor bet may not make sense. A more logical approach may be to look for quality businesses around the globe, i.e., an allocation to both US and non-US stocks. Historically, as Exhibit 8 illustrates, most of the best-performing stocks globally have been non-US-listed companies.
Less reliance on multiple expansion
Looking back over the past decade, US companies have led their non-US counterparts in two of the drivers of price appreciation: earnings and valuation. Yet as mentioned above, extrapolating the recent past to the present is often a fool’s game. It might be smarter to think about valuations and earnings over the coming decade. Starting with the outlook for valuations, central banks have taken away the free-money punch bowl, and if interest rates remain elevated this will likely drive equity multiples closer to their long-term averages. In this environment, you would expect little to no price appreciation from multiple expansion. In cases where multiples remain elevated compared to long-term averages, such as US stocks and, in particular, US growth stocks, a derating of multiples is not only possible, but likely. Thus, future price appreciation will likely need to come from earnings growth and dividends.
More reliance on earnings and dividends
On the earnings front, the prior decade disproportionately benefited US stocks. It was a perfect storm of abundant liquidity, low inflation and low interest rates converging with an asset class that has become a proxy for growth stocks. The global pandemic further accelerated revenues and earnings for technology companies, which are located predominantly in the US. However, today the environment is quite different as a larger subset of sectors and industries could benefit from future trends. This coupled with the potential for a low-return backdrop, investors may be well served to focus on the pricing power and margin stability typically seen in quality companies, whatever their domicile. Thus company-specific alpha becomes more important than factor beta. Moreover, dividends will be a larger component of price appreciation in a low-return world, and non-US stocks have historically paid higher dividends.
Future trends should benefit a broader range of companies
Going forward, while technology and artificial intelligence will be an important part of our lives, we believe future trends will likely also benefit a wider cohort of sectors and industries rather than just the technology-centric companies of the past decade. Many of the companies in these other industries are domiciled outside the US. Future trends may include increased capital expenditure spending, energy transition and decarbonization, as well as the reshoring and localization of supply chains, to name a few.
Investing in traditional fixed assets
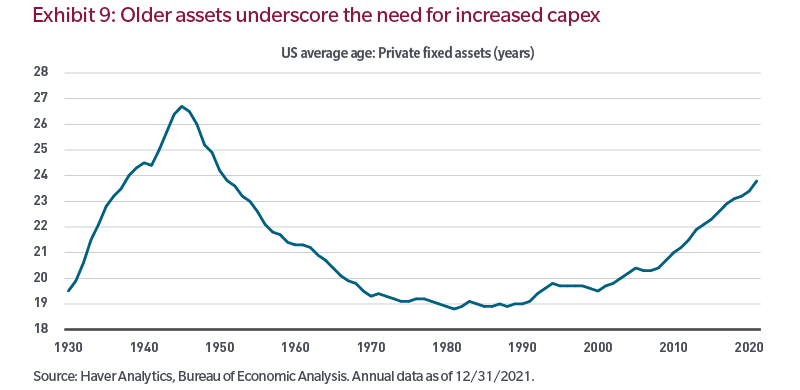
Over the past 10 to 12 years, capex as a percentage of sales has declined significantly, and because of low capex, fixed assets today are five years older than in the 70s and 80s, highlighting the need for spending (Exhibit 9). Coming out of the GFC, businesses had access to “free” capital thanks to central bank quantitative easing. As a result, businesses had essentially two choices: they could reinvest in their own businesses or employ financial engineering practices such as share buybacks. Since economic growth and inflation were low, reinvesting was not that attractive. Companies that did spend money spent it on technology (opex) rather than traditional capex, leading to the aging of private fixed assets, as we have noted. This lack of spending on capex and infrastructure is starting to be addressed, which should benefit a variety of sectors and industries outside of technology that were left out in the cold over the prior decade.
Meeting decarbonization and net zero goals
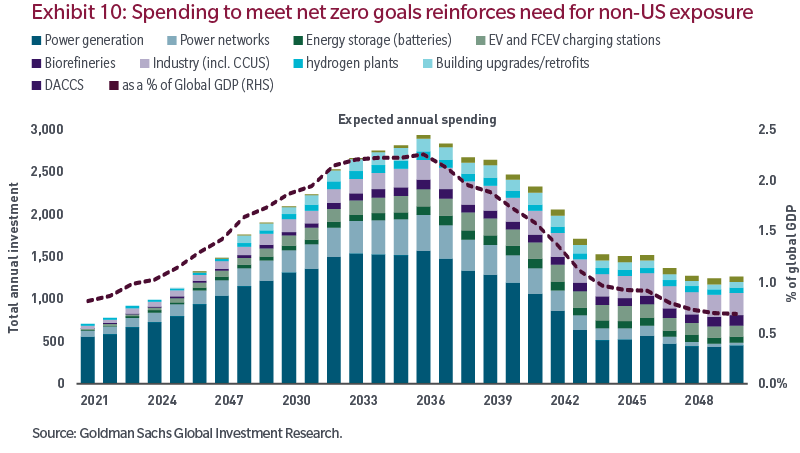
Around the world, more and more companies, communities and nations are transitioning toward a world of net zero emissions, as called for in the Paris Agreement. To achieve a carbon neutral global economy by 2050, annual spending on physical assets would need to increase by $3.5 trillion by some estimates (Exhibit 10).1 To provide some context, that amount equals half of global corporate profits and one-quarter of tax revenues in 2020.1 While spending on decarbonization may not reach this level, spending driven by income and population growth and legislated decarbonization policies could still result in an increase of $1 trillion annually.
To achieve net zero goals, money spent on reducing climate risk in the next decade is crucial. However, this type of spending will likely be uneven across countries and sectors, reinforcing the need for non-US exposure. There are risks associated with the transition, including energy supply volatility, but there are opportunities for active managers as decarbonization creates markets for low-emissions products and services and drives infrastructure spending on energy, water and transportation. How the spending will be funded is a critical question. Industry research indicates that a third of incremental decarbonization capex will come from existing publicly traded companies, based on their balance sheet and reinvestment spare capacity.1 Furthermore, the market will likely reward companies investing in decarbonization or exposed to customers’ investments, particularly in sectors where green capex is needed to help alleviate supply-chain bottlenecks and reduce execution risks.
Spending to localize production
The pandemic and the war in Ukraine, among other geopolitical considerations, have revealed the downside of just-in-time inventory systems and global supply chains. While it will take time for localization to play out, many companies are now beginning to reshore supply chains and improve their dependability and resilience. Moreover, this trend is less about US versus non-US and more about specific companies around the globe. We think that the companies that can enable change and provide solutions during this transition will be the long-term winners here, whatever their domicile.
Conclusion
The starting point for markets today is quite different from that of ten years ago. The beta-driven environment in which investors need only pick the right style, region, country or factor is likely over. Today, rates and inflation are elevated compared to the past decade, US valuations remain expensive by historical standards and in some markets, margins are likely still too high. In our view, alpha matters in this environment, not beta. Investing in the best companies globally instead of relying on the mindset of the past decade can potentially help maximize returns while providing the benefits of diversification.
Endnotes
1 Goldman Sachs Global Equity Strategy, 2022 Outlook: Getting Real, Goldman Sachs Global Investment Research.
The views expressed are those of the speakers and are subject to change at any time. These views are for informational purposes only and should not be relied upon as a recommendation to purchase any security or as a solicitation or investment advice from the Advisor. No forecasts can be guaranteed. Past performance is no guarantee of future results.
“Standard & Poor’s®” and S&P “S&P®” are registered trademarks of Standard & Poor's Financial Services LLC (“S&P”) and Dow Jones is a registered trademark of Dow Jones Trademark Holdings LLC (“Dow Jones”) and have been licensed for use by S&P Dow Jones Indices LLC and sublicensed for certain purposes by MFS. The S&P 500® is a product of S&P Dow Jones Indices LLC and has been licensed for use by MFS. MFS’s Products are not sponsored, endorsed, sold or promoted by S&P Dow Jones Indices LLC, Dow Jones, S&P, or their respective affiliates, and neither S&P Dow Jones Indices LLC, Dow Jones, S&P, their respective affiliates make any representation regarding the advisability of investing in such products.
Index data source: MSCI. MSCI makes no express or implied warranties or representations and shall have no liability whatsoever with respect to any MSCI data contained herein. The MSCI data may not be further redistributed or used as a basis for other indices or any securities or financial products. This report is not approved, reviewed or produced by MSCI.
Frank Russell Company (“Russell”) is the source and owner of the Russell Index data contained or reflected in this material and all trademarks, service marks and copyrights related to the Russell Indexes. Russell® is a trademark of Frank Russell Company. Neither Russell nor its licensors accept any liability for any errors or omissions in the Russell Indexes and/or Russell ratings or underlying data and no party may rely on any Russell Indexes and/or Russell ratings and/or underlying data contained in this communication. No further distribution of Russell Data is permitted without Russell’s express written consent. Russell does not promote, sponsor or endorse the content of this communication.


