
by Rick Rieder, CIO, Global Fixed Income, and Russell Brownback, Head of Global Macro, Fixed Income, BlackRock
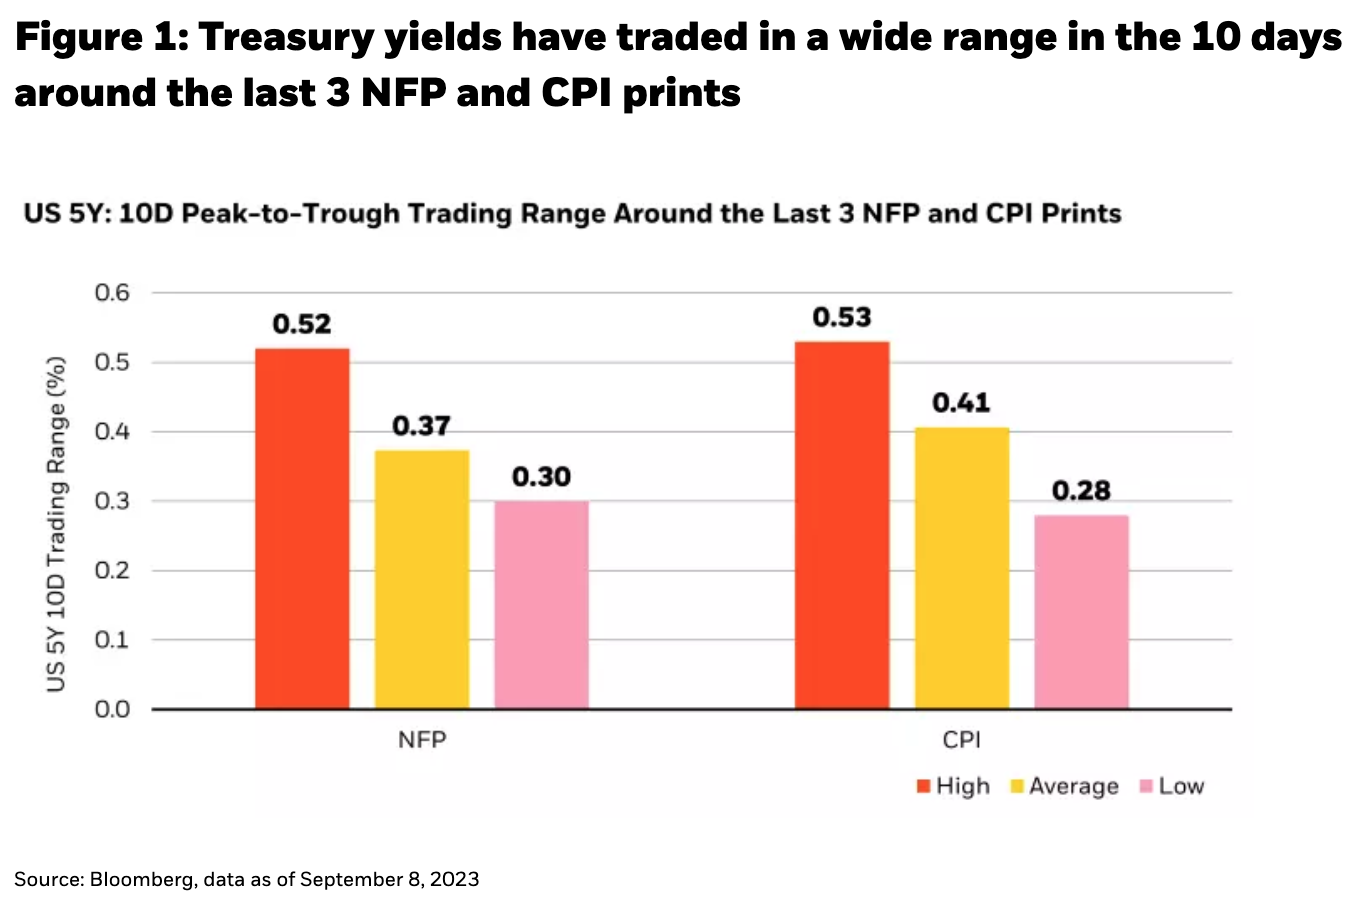
Global central bank hiking cycles have dominated financial market headlines for the last 18 months, keeping many investors on the sidelines, hiding out in cash as inflation and the resulting rate hikes were serious headwinds to returns. Now, over the last few months, as these hiking cycles have increasingly hinged on incoming economic data to determine the moment of pausing, ending, or even reversing (in the case of certain Emerging Markets), we have seen a dizzying rush of wagers that each CPI or Payrolls report will provide the singular answer to economic and financial direction for the next 18 months. From July 4th to Labor Day, the Nasdaq had five different 5% swings; similarly, 10-year U.S. Treasury yields moved up (or down) 0.25% on six different occasions, notably catalyzed by economic data releases (see Figure 1).
As the Ryder Cup took place last weekend in Rome, a number of golfing analogies come to mind. As it relates to these recent short-lived and volatile market swings, we are reminded of the amateur golfer who, after a prolonged period of sitting on the sidelines, swings aggressively at every shot, determined to shoot incredible scores and make up for lost time. Yet, the most aggressive approaches can often leave you in the bunker, or in a water hazard, scrambling to avoid losses (not that we have any experience with that). This is especially true when you are playing on an unfamiliar, or especially difficult, course – as we believe is the case in markets today.
Those market participants looking to extrapolate each inflation or jobs data point, hoping for the proverbial hole-in-one on economic answers and investment returns, are more likely to stray off course, missing the more durable trends that are unfolding in front of us. We believe analyzing the incoming data is as important as ever with the Federal Reserve (Fed) moving to a more balanced approach of data-dependency, but that requires context and patience, analyzing the economic figures holistically and with nuance.
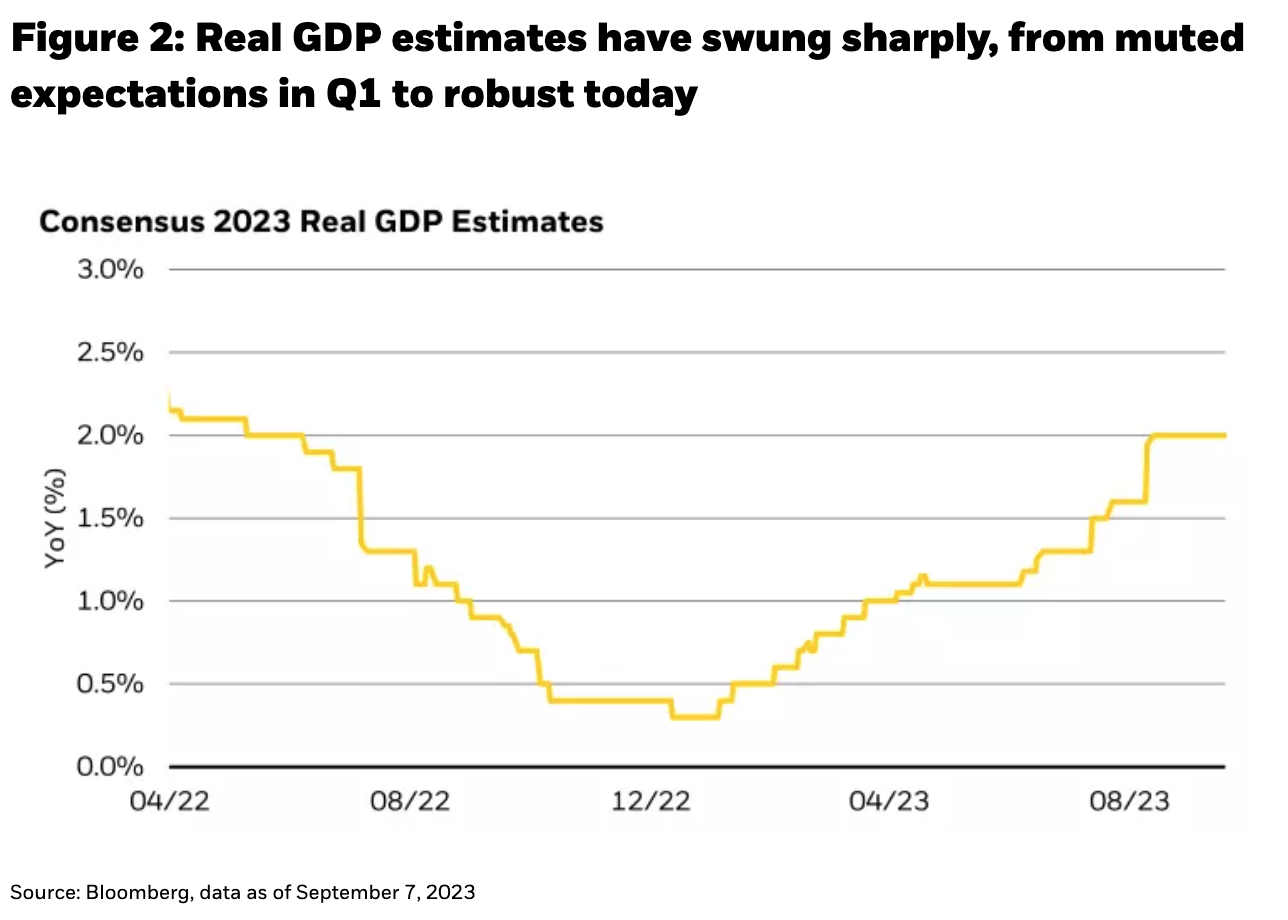
For example, the Manufacturing ISM survey fell to the contractionary level of 48 coming in to 2023, leaving many prognosticators calling for imminent recession, particularly with consensus 2023 real GDP estimates at a paltry 0.3% back in January. Never mind tightness in the labor market, excess savings with solid wage growth, the hand-off from goods consumption to services, or the sentiment-based nature of surveys, all of which suggested these expectations of gloom were over-done. Sure enough, entering September, the consensus for 2023 real GDP had risen sharply to 2.0% (see Figure 2).
The need for caution in making grand predictions today is amplified by some truly incredible global crosscurrents. To continue our golf analogy, bold projections for 2024, or beyond, are akin to trying to hit the perfect drive around the corner on a blind tee shot. It is very difficult to see, or forecast, much of the course ahead because of the numerous (and sometimes counteracting) forces hitting the global economy today, many of which do not have historical precedent, and could result in massive economic, geopolitical, and cultural divergences. Until we can gain more comfort about what lies on the course ahead, prudence would suggest a safer shot to keep the ball in play.
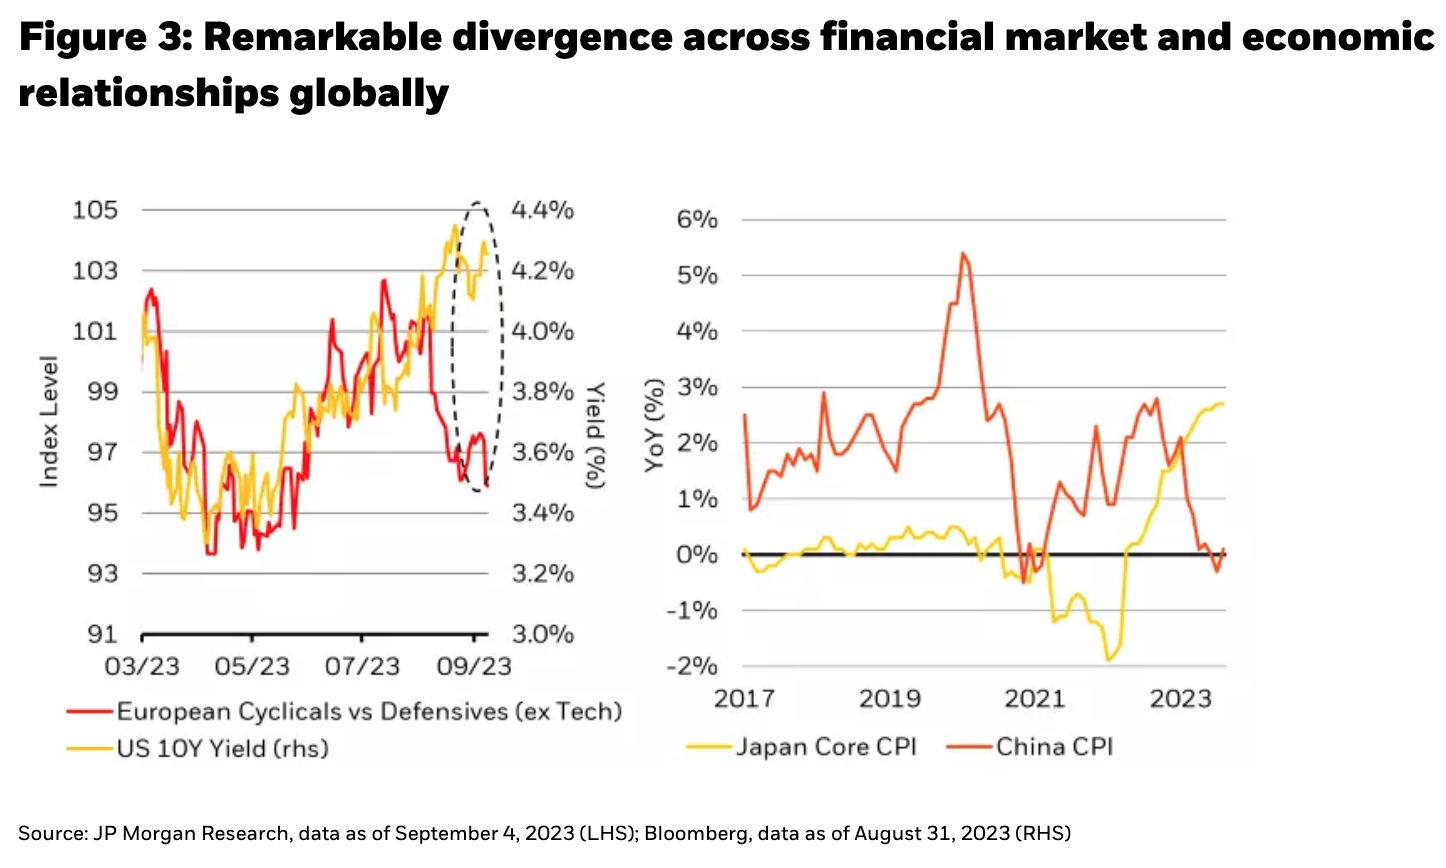
These heightened uncertainties are causing sharp divergences in financial markets. Nominal and real U. S. Treasury yields have continued their push to new highs, while equity risk premiums and credit spreads have compressed. This de-coupling between the discount rate and the valuation on risky assets has reached proportions where it is just harder to take a big directional swing on beta today. Economic divergences are percolating as well. Japan’s inflation data is reaching new highs not seen in decades while China teeters on the brink of outright deflation (see Figure 3).
China and the trend of deglobalization are two of the biggest sources of uncertainty today. For the better part of 15 years from 2000-2015, China’s fixed asset investment boomed, driving enormous demand for commodities, labor, and capital. China drove upwards of 75% of marginal global commodity demand, and often contributed to more than 30% of the world’s marginal GDP growth. For years, economic forecasts could comfortably bake in robust growth from the world’s second largest economy, but now, as Debt/GDP ratios have ballooned, foreign direct investment has slowed to a trickle, and domestic real estate prices waver, the path forward for China’s economic influence is much more uncertain.
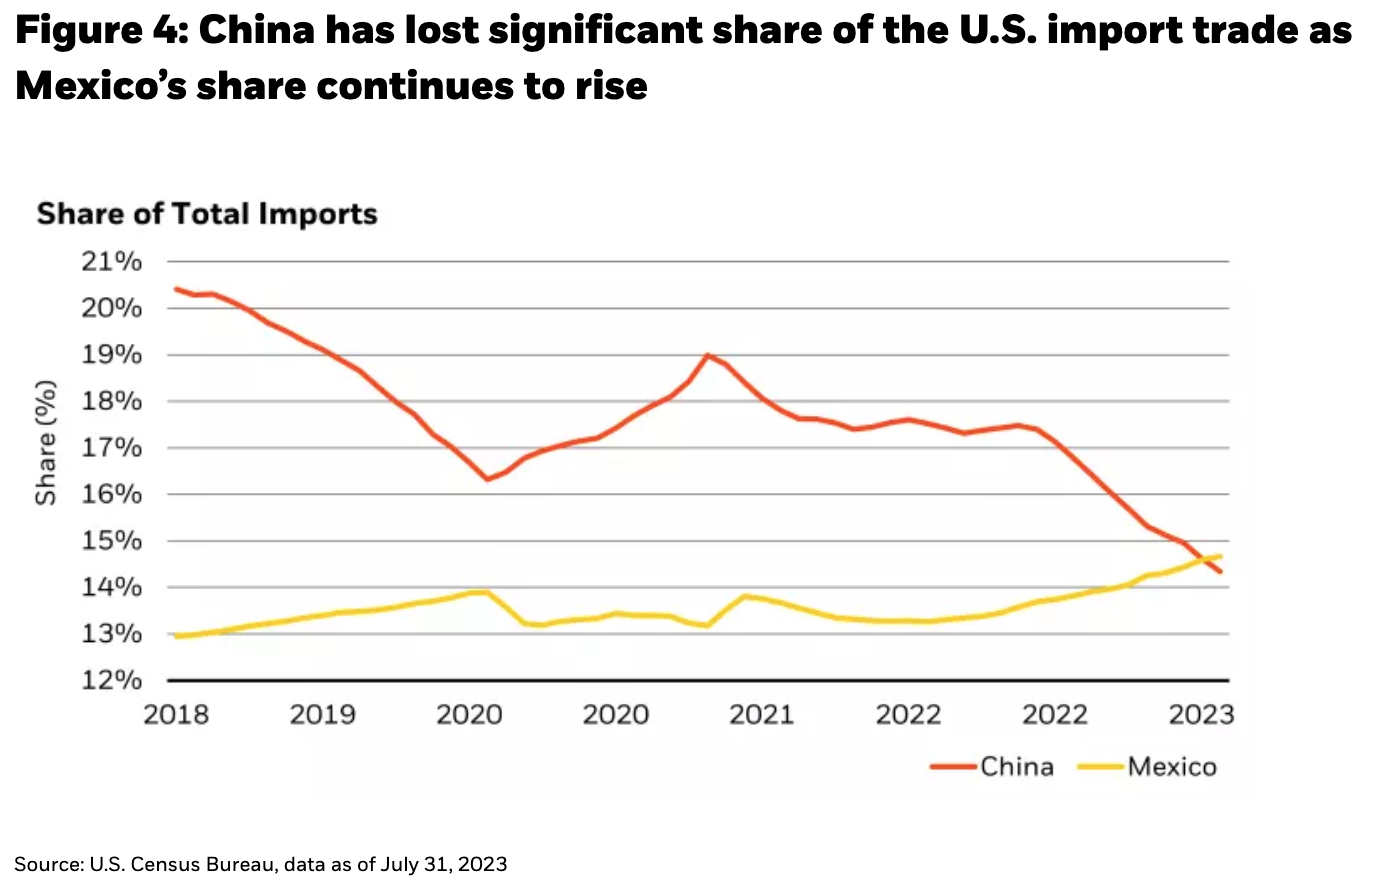
One incredible statistic of the emerging deglobalization/re-shoring trend is that Mexico has overtaken China as the largest exporter to the U.S. Just five years ago, China’s exports to the U.S. were more than 50% larger than Mexico’s (see Figure 4). Historically, such a slowdown in China activity would have meant a disinflationary influence on the rest of the world as global trade slowed. Today, however, even if you knew with precision what China’s domestic economic path would be, the influence on western economics is less clear as many U.S. companies invest more heavily in local supply chains, investment that brings its own large needs for labor and capital.
Europe is also facing a great deal of uncertainty. PMIs are well below 50, lending to households is in outright contraction, and while Producer Price Inflation in Germany is now negative (having been as high as 46% last Fall), core measures of inflation are still too high. Not to mention Europe’s cyclical goods sectors are also heavily tied to demand from China. And while Europe still has major resource questions surrounding the Russia/Ukraine war, the expanding BRICS coalition and politicization of global oil supply are making matters worse with Brent crude prices up 29% in the last three months.
The point being, there is greater global uncertainty today than really at any point over the past 10-20 years. Going back to our analogy, “club selection” for investing today may have more utility if focused on the short game rather than trying to hit the ball a long way through economic and geopolitical fog.
Follow Rick Rieder on Twitter
Now, there are still a number of factors that give us confidence in the short to intermediate-term for building a positively convex portfolio (noting that there are right-tail outcomes just as there are left-tail scenarios). For starters, the investment boom around Artificial Intelligence (AI) could spark a productivity boom that drives real growth beyond any current expectations, while also keeping inflation in a moderate place. Indeed, Goldman Sachs has estimated that widespread AI adoption could boost developed market productivity by up to 1.5% per year for the next 10 years. For context: that would provide a 68% increase to the 2.2% real GDP growth that the U.S. has averaged over the last decade, or potentially a $4 trillion increase in U.S. GDP 10 years hence.
While AI provides promise for longer-term growth potential, there are still a handful of economic pillars, particularly in the U.S., that give us confidence on building portfolios for the short to intermediate-term; the golfing equivalent of hitting a nice wedge shot onto the middle of the green. For one, the labor market is on very solid footing. More than 4 million jobs have been created above and beyond the pre-Covid peak, and perhaps even more impressive, labor participation for the 25–54-year-old age group is the highest since 2002 (see Figure 5). This is a very welcomed positive labor supply impulse that works toward satisfying both the Fed’s maximum employment and stable inflation objectives as it sees more people employed, but with less frantic wage pressure.

As we approach full capacity in the labor market, payroll growth should slow to around 100,000 jobs gained per month, and wage growth should continue to moderate to the 3.5%-4.0% range. We are already seeing this moderation in the JOLTS data as openings tick lower and vacancy rates edge higher. However, there is still structural labor demand in the Education, Healthcare, Leisure and Hospitality sectors that will likely continue to provide aggregate employment support, even as the cyclical sectors slow hiring. As household income growth moderates and excessive savings are spent down, we expect to continue to hear reports like the recent announcements from Macy’s, Ralph Lauren and Kering that consumer appetite is waning. While that can make for some scary headline click-bait, the broader context is that the U.S. consumer is going from great to good, or at worst, from great to just okay.
On the inflation front, we are encouraged by the most recent data. Core Services (ex-Shelter) is running at just 2.8% on a 6-month annualized basis, down from 8.0% in September 2022. Core Goods (ex-Used Autos) is down to 0.4% on a 6-month annualized basis, down from 8.9% in January 2022. We are confident in the persistence of these trends, but recognize that there is still some risk of modest re-acceleration (or temporary quirks in the data), especially with the recent run-up in oil prices. We also acknowledge that the current year-over-year run rates of inflation are still too high relative to Fed (and other DM central bank) targets.
The moderation in growth and inflation would typically provide a predictable path for the Fed, and hence some comfort in taking more duration risk in the front to the belly of the curve. However, historic fiscal deficits are yet another source of uncertainty today. The Congressional Budget Office (CBO) is projecting the federal deficit to exceed 5% of GDP for each of the next 10 years. Higher interest rates are exacerbating the deficit problem in a major way; federal interest payments are projected to surpass all non-defense discretionary spending by the end of the decade, and are likely to exceed all military spending as well. This fiscal largesse complicates the questions around duration management and portfolio construction today, not only because it threatens the disinflation narrative, but importantly, because of the mind-blowing amount of Treasury debt supply that must be absorbed.
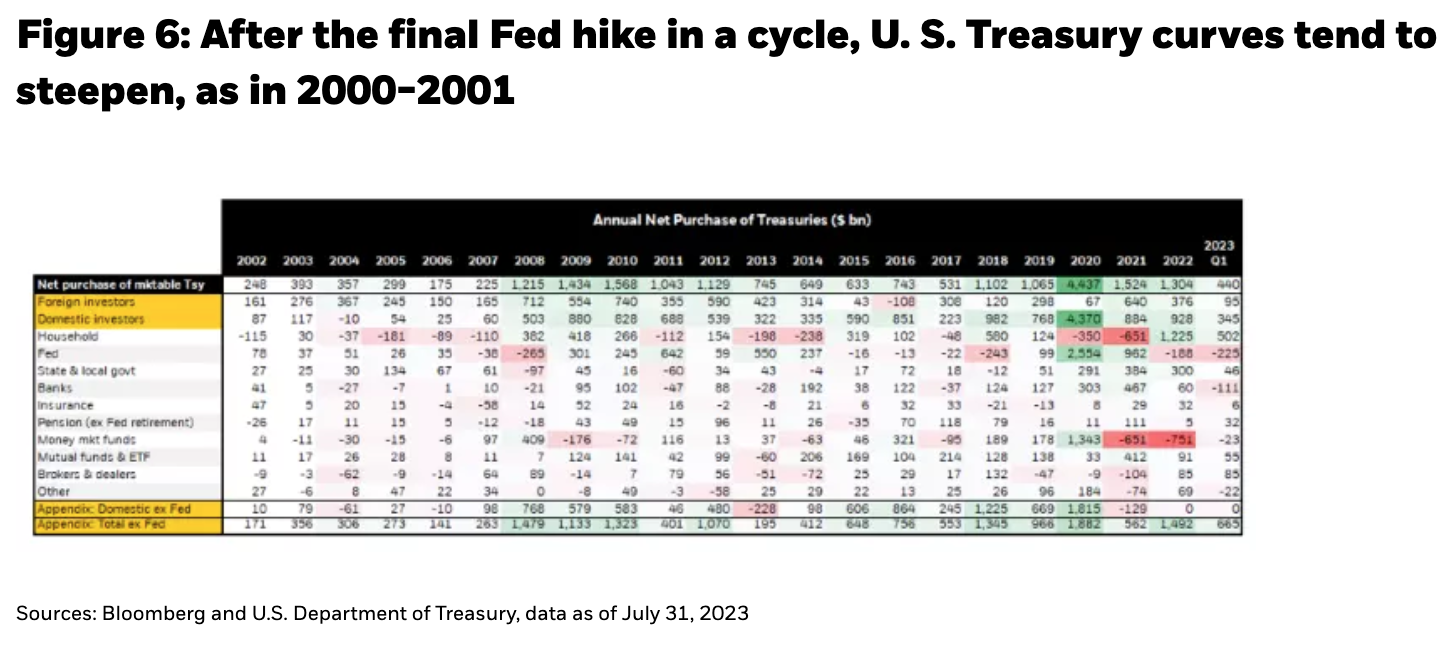
Net U.S. Treasury supply in 2024 (in 10-year UST equivalents) is set to exceed $2.7 trillion, which is nearly double the average annual issuance from 2010-2020. Not only is the supply of Treasuries exploding higher, but the sources of demand are becoming harder to find (see Figure 6). The Fed is obviously a net seller today as they run-off the balance sheet; banks are mostly sitting on the sidelines as they manage through mark-to-market issues on their existing holdings, and foreign investors, such as China and Japan, are no longer buying the hundreds of billions of Treasuries each year that they once did. In 2020, the combination of foreign investors, U.S. banks and the Fed bought more than $2.9 trillion of Treasuries on a net basis; in 2021, they bought $2.1 trillion. That $5.0 trillion in just two years is larger than the GDP of Japan. And now, by contrast, these three market participants are on pace to sell nearly $1.0 trillion of Treasuries on a net basis in 2023. The magnitude of this reversal from buying to selling is simply staggering.
Ultimately, this pushes the buying obligations onto households and private sector financial players. The good news is that the household sector is under-allocated to Treasuries and fixed income more broadly, and is sitting on more than $18 trillion of cash assets, so their potential to step in as a meaningful buyer is significant. With an aging and retiring demographic, front-to-belly Treasury yields of near 5% should offer an attractive income stream, especially as inflation migrates lower (see Figure 7).

In the medium-term, it is extremely difficult to predict what the huge cost of debt-service will mean, and the consequential influence on the price of risk-free assets, the USD, and then presumably what it means for the relative price of ‘risky’ assets. It is not lost on us that with annual deficits, growing debt, consistent threats of default (debt ceiling), and a persistent need for capital markets financing, the U.S. government sounds a lot like a high yield (junk bond) issuer today. Given these characteristics, is the U.S. government now a “higher yielding” issuer for an extended period of time? Historically, the ‘down the cap stack’ risky rate has been the more vulnerable and volatile component of all-in yields relative to Treasuries; that story may very well be flipped today. If the Fed is nearing the end of its hiking cycle, but perpetual budget deficits are coming alongside of disruptive developments in global trade, geopolitics and commodities markets, couldn’t we see a meaningful rise in term premium? With the long-term outlook so uncertain, shouldn’t investors play it safe, or at least demand a higher yield for taking on the incredible volatility that comes with longer-duration assets?
For decades, the back end of the “risk-free” Treasury market served as a reliable hedge to risky asset portfolios. Under today’s set of globally uncertain conditions, the vulnerability of long-dated Treasuries not only erodes their hedging qualities, but their elevated volatility profile is actually a significant threat in-and-of-itself to destabilize the rest of the capital stack. We prefer taking our duration exposure in the front-to-belly of the Treasury curve. Not only are there better yields due to curve inversions and much lower volatility, but in the case where inflation and growth come down more quickly than we expect, we feel confident that the Treasury curve will steepen as 2-year and 5-year yields rally the most. Going back to the mid-1980s, following the last Fed hike of a given hiking cycle (or from levels of deep curve inversion like today), the Treasury market has consistently steepened by at least 100 basis points over the subsequent 12-24 months (see Figure 8).

While higher back-end yields and greater Treasury volatility typically cloud the outlook for equities, there are a couple of comforting factors at play today. The equity supply/demand dynamic is the mirror image of the Treasury deluge. In fact, U.S. equity share buyback authorizations are near record highs of $800 billion, and while a couple of high-profile IPOs priced this week, the supply of new equity listings is near the lowest in 30 years. Generic price multiples are not nearly as high as the headlines suggest, either. The S&P 500 P/E multiple of 19-20x is being skewed by the lofty multiples from 6-7 tech companies; the equal-weighted S&P 500 multiple is just 16.5x. And, finally, the much-discussed AI investment boom really does present the prospect for outsized productivity growth in the years ahead; if realized, those elevated tech multiples may be well worth it.
Bringing this all together for portfolios today, we like marrying low-beta, high-carrying yield (without very much duration risk) with some convex equity exposures (the real long-duration asset) that have considerable upside potential. Within the fixed income allocations, we still like holding commercial paper with 5.8% current yields and short-dated AAA securitized assets with yields in the 6.25% area (Source: Federal Reserve and Bloomberg, data as of September 13, 2023). Further, we like extending a bit of duration into the belly of the Treasury curve, in preparation for curve steepening heading in to 2024, as well as moderate positions in U.S. and European credit. Finally, we are maintaining small allocations to EM local-currency sovereign bonds in places like Brazil and Mexico, as those central banks have a clearer path to deliver on rate cuts. Through these allocations, we can build portfolios today with very high-quality assets and short-to-intermediate term maturities that still hold attractive yield. These mid-single digit nominal yields look increasingly appetizing as inflation continues to moderate, and by extending our duration just a bit into the belly of the curve, these portfolios gain some attractive total return upside potential should yields rally over the coming months.
Building a portfolio of low-risk, low-vol, high-quality yields allows us to keep the ball in play for the foreseeable future, while keeping one eye open for the right opportunity to hit a more exciting, aggressive shot. It fits the storied Ryder Cup strategy of pairing the explosive big-hitter with a partner who is steady tee-to-green and putts like a champion.
Copyright © BlackRock