by Jurrien Timmer, Director of Global Macro for Fidelity Management & Research Company, Fidelity Viewpoints
A key assumption about inflation could be flawed.
Key takeaways
- There are reasons to believe the market may be underestimating the long-term future rate of inflation from here.
- A higher-than-expected inflation rate could weigh on the returns of stocks and some types of bonds.
- It could also flip the correlation between stocks and bonds from positive to negative.
- That said, a balanced mix of stocks and bonds still likely makes sense for many investors, with stocks providing inflation-hedging potential, and bonds providing a potential recession hedge.
Investing means making real-time decisions with imperfect information. If we think about everything at play in today’s markets, many of the drivers are really nothing more than assumptions. Markets are brutally efficient when it comes to absorbing new information. But that doesn’t mean the market’s assumptions are always right.
A questionable assumption about inflation?
For example, one key assumption underpinning US markets is the future rate of inflation. The go-to source for estimating the future rate of inflation has long been the market for Treasury Inflation-Protected Securities (TIPS). By comparing TIPS yields to those of conventional Treasurys, investors can determine what level of future inflation the TIPS market is pricing in.
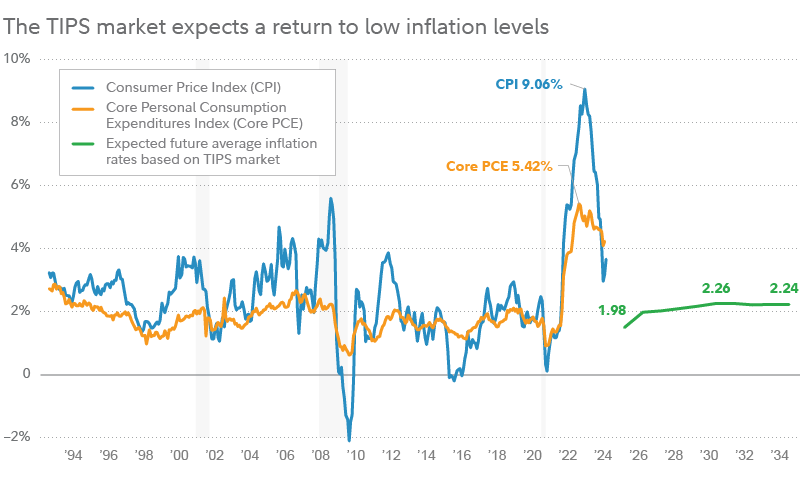
Currently, as the chart below shows, the TIPS market seems to believe that inflation will fall to about 2.3%, and stay there.

The Consumer Price Index (CPI) is a measure of price changes experienced by urban consumers that tracks the average change in price over time of a market basket of consumer goods and services, and is based on data taken from surveys of consumers. “Core PCE” refers to the Personal Consumption Expenditures Price Index, Excluding Food and Energy, and is a measure of consumer spending on goods and services among households in the US, excluding spending on food and energy, and is based on data taken from various government agencies and private organizations. The TIPS breakeven inflation rate is the difference between nominal Treasurys and TIPS yields of comparable maturities. Source: FMRCo.
But how do we know if the TIPS market is correct? TIPS have only been around since the late 1990s, and have never been tested in a long-term period of high inflation. And while inflation has come down considerably since its recent peak in mid-2022, there are reasons to believe it will be harder, from here, to push it down further.
Certainly, it’s still possible that inflation could revert to the 2.0%–2.5% range. However, another plausible scenario is that inflation remains relatively elevated, as resources become scarcer and globalization retreats from peak levels (read more about megatrends that could impact long-term inflation levels).
Why the inflation assumption matters
Consider how much the current outlook rests on that assumption. Take Fed policy, for example: Is the Fed restrictive at its fed funds target range of 5.25%–5.50%? Well, that depends on (among other things) inflation. If the TIPS market is correct (and assumptions about the neutral policy rate are correct) then yes, the Fed is clearly restrictive. But if 4% inflation ends up being the new normal, instead of 2%, then it would mean the Fed is nowhere close to restrictive yet.
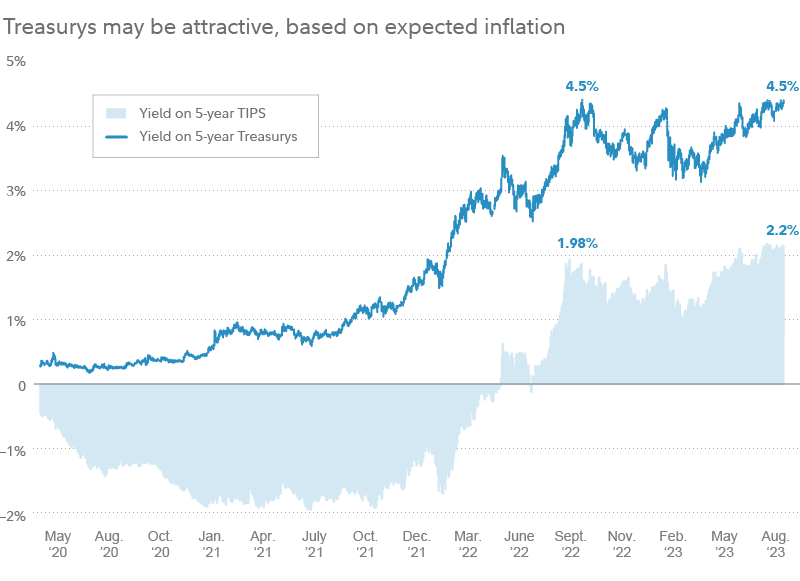
Or consider bonds. Are Treasurys attractive at yields of 4% or more? Well, that may depend on what the “real yield,” or inflation-adjusted yield is. If the TIPS market is correct about inflation, then conventional Treasurys are quite attractive, with a yield, after expected inflation, of more than 2% for the 5-year maturity.

Past performance is no guarantee of future results.
But what if inflation remains elevated for the long term, like at 3% or 4%? Such a scenario could fuel an increase in the “term premium” (meaning the additional return premium that investors typically demand to compensate for the higher risk of lending for longer periods of time), driving yields on long-term Treasurys even higher. Since bond prices move inversely to yields—falling when yields rise—that kind of increase in yields could hurt returns for bond investors.
A page out of market history
What would it mean for markets if this inflation assumption is wrong? Market history can suggest some answers.
In the late 1960s, inflation woke up after a long slumber. As inflation emerged, interest rates rose, and both of these factors impacted stock valuations. After almost 2 decades of above-average returns, stock valuations (such as price-earnings, or P/E ratios) peaked in 1968 and started a long decline. The acceleration in inflation flattened out the market’s gains, from above-trend to below-trend. That’s what inflation does. Investors are less willing to pay up for future earnings when rates are rising.
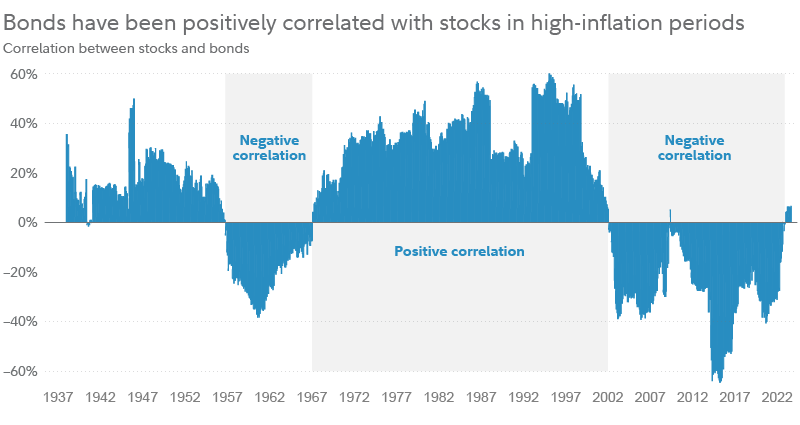
The 1960s also ushered in a major shift for stock-bond correlations. Many investors probably take for granted that bonds are supposed to be negatively correlated to stocks. But as the chart shows below, that hasn’t always been the case. Bonds were positively correlated to stocks from the mid-1960s until the late 1990s.

Past performance is no guarantee of future results. Correlation between stocks and bonds is represented by the 5-year correlation between the total return of the S&P 500® and the total return of long-term government bonds. Correlation is a number between negative 1 and positive 1, or negative 100% and positive 100%, that measures the linear association between 2 variables. Source: Bloomberg, Haver, FMRCo., Morningstar.
Historically, above-average inflation has pushed the correlation from negative to positive. Something to keep in mind.
What this means for stocks
Per the 1960s, we’ve seen that inflation tends to be inversely correlated to valuations—with high inflation pressuring P/E ratios lower. All else equal, if P/E ratios are weighed down, it will also weigh on stock returns.
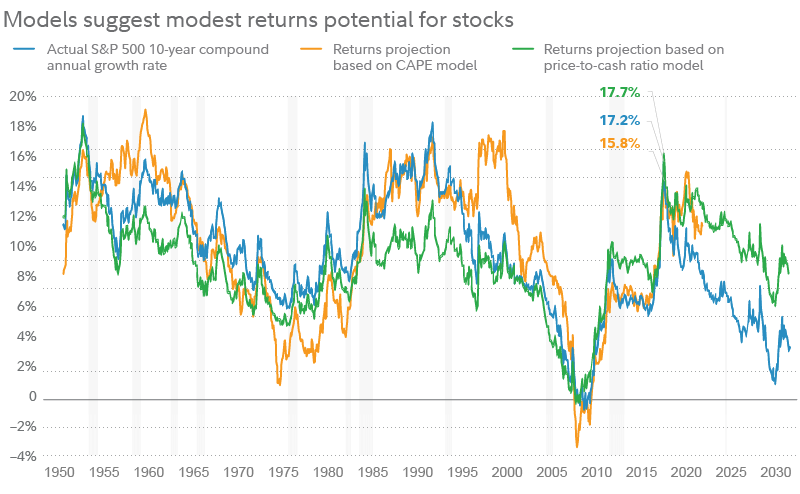
Another thing we’ve seen is that starting valuations have an impact on future returns—this is per the CAPE model. The market’s CAPE, or cyclically adjusted P/E, compares the market’s current price against average inflation-adjusted earnings for the previous 10 years—providing a look at current valuation that smooths out short-term influences. The CAPE model then holds that this smoothed-out P/E ratio is inversely correlated to annualized returns over the following decade.
The chart below shows how well this indicator has worked over the decades (with the caveat that valuations have no bearing on short-term returns). What it suggests, based on a regression analysis, is that 2021 may have been the “peak return” year (with a compound annual growth rate of 17%), and that the next decade could produce positive, but lower, returns in the range of 3.5% to 9.2%.

Past performance is no guarantee of future results. Returns projection based on CAPE model is derived from a regression analysis using the 10-year CAPE as an independent variable and the forward return as a dependent variable. Returns projection based on price-to-cash ratio model is derived from a regression analysis using the S&P price-to-cash ratio as an independent variable and the forward return as a dependent variable. Source: Haver, Factset, FMRCo.
A peak in annualized returns and valuations would not necessarily mean a peak in stock prices, but it would mean that earnings will have to do the heavy lifting as P/E ratios turn from tailwind to headwind.
Fortunately, earnings appear to have bottomed after a modest 3% decline. But it remains to be seen whether they will grow 12% in 2024 and 13% in 2025 as current estimates suggest. For an economy in the late cycle, that seems ambitious.
Adding up the assumptions
Where does this all leave me? For stocks, I think there is limited upside here. The P/E ratio on the S&P 500® has already risen by 5 points on the expectation of a soft landing. Maybe it will happen, but earnings estimates are already ambitious, and the risk is that inflation expectations are too optimistic.
My hunch is that we are in the twilight of the long-term bull market for stocks that started in 2009. If that is the case, then all we can probably hope for is a return to the old highs, or maybe slightly better. That would imply limited gains potential from here.
For bonds, there is a risk that persistent inflation could push yields higher. But even in that scenario, in my opinion the risk-reward calculation still looks attractive for long-term bonds. Consider this: The duration (a measure of interest-rate sensitivity) of the Bloomberg US Aggregate Bond Index was recently 6.2 years. That implies that if interest rates fell by 1 percentage point (which could easily happen if recession finally hits), then the index could gain about 6.2% in price. And that potential gain could come in addition to the index’s recent yield of 5.2%. If, on the other hand, rates were to rise by another 1 percentage point, the index’s yield could offset much of the potential losses on a price basis. So, I like bonds here.
In fact, I still like the 60% stocks, 40% bonds model allocation—warts and all. Even if the correlation between stocks and bonds has flipped to positive, there are reasons to own both. Stocks can provide a tried-and-tested inflation hedge, even if valuations become a headwind. And at current yields, investment-grade bonds like those represented by the Bloomberg US Aggregate could provide solid recession insurance.
Copyright © Fidelity Viewpoints


