by Adam Turnquist, CMT, VP Chief Technical Strategist, LPL Financial
Key Takeaways:
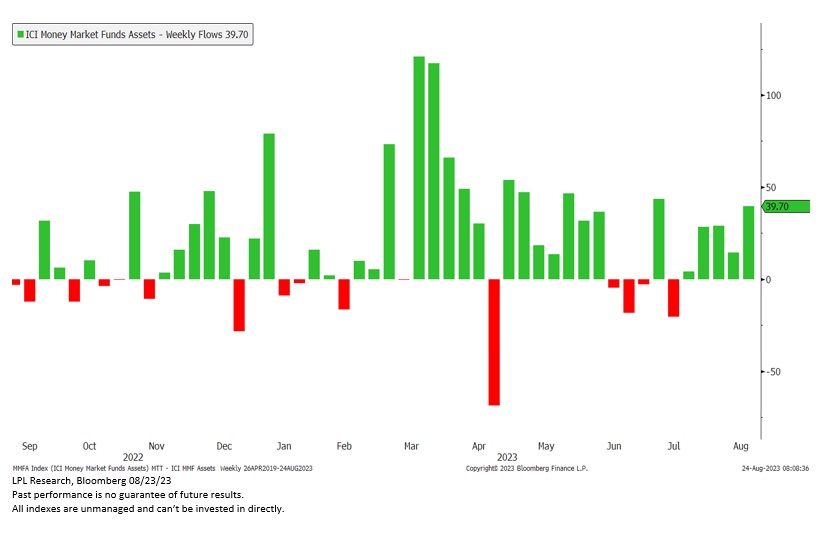
• Cash in money market funds continues to climb in record-high territory.
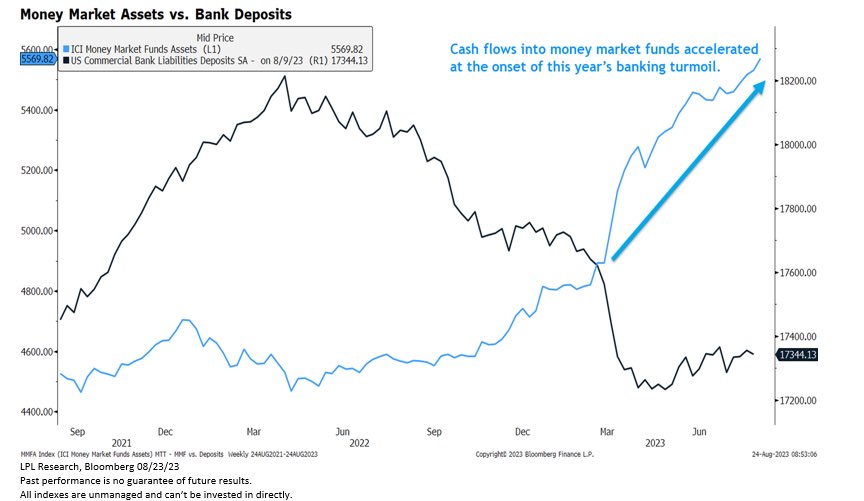
• Rising interest rates supported by the Federal Reserve’s (Fed) higher-for-longer monetary policy and turmoil in the regional banking space earlier this year have underpinned steady inflows into the space.
• While a Fed rate cut could create some headwinds for money market fund flows, don’t hold your breath for an immediate trend change.
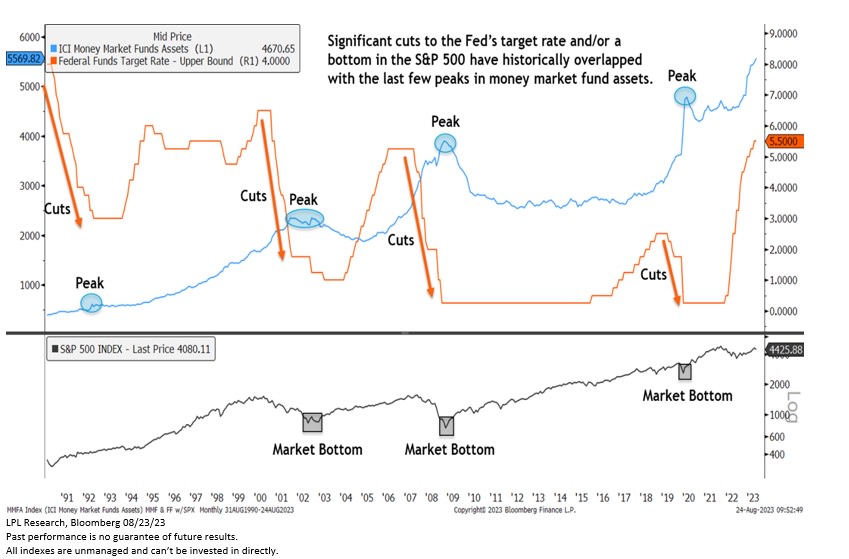
• High watermarks in money market assets have historically not been reached until the Fed significantly cuts interest rates. Of course, these periods also overlapped near the last three major bottoms in the S&P 500.
Higher rates this year have created a high bar for cash coming off the sidelines. Assets in money market funds have climbed to nearly $5.6 trillion, a record-high and a notable 18% increase year to date. For reference, money market funds invest in short-term, high-quality debt or cash equivalents and are intended to provide investors with low-risk income generation and stable liquidity. It is important to note that money market funds are not considered ‘risk-free’ like U.S. Treasuries and are not protected by the Federal Deposit Insurance Corporation (FDIC), which generally insures deposits up to $250,000 per bank.
Consistent Cash Flows
Cash has consistently flowed into money market funds this year. As of August 16, money market funds have captured inflows during 24 of the last 33 weeks (year to date), including a current five-week inflow streak.
Follow the Money
Attractive yields north of 5% have enticed investors to move cash from lower-yielding bank accounts to money market funds. Fund flows out of the banking space were further exacerbated by the turmoil in regional banks this spring—including the shuttering of three major regional banks. The chart below compares total money market assets to total deposit liabilities among commercial banks in the U.S.
When Does the Trend Change?
While a rate cut from the Fed could create some headwinds for money market fund flows, don’t hold your breath for an immediate trend change. Initial cuts to the federal funds target rate have not historically marked a peak in money market fund assets. The chart below shows that high watermarks in money market assets were not reached until the Fed significantly cut interest rates. Of course, these periods also overlapped near the last three major bottoms in the S&P 500. The exception was during the rate-cutting cycle that ended in 1992. While assets in money market funds peaked at this time, they mostly consolidated sideways for the next few years (the fed funds rate was also at 3.00%, much higher than subsequent periods).
SUMMARY
Money market fund assets have climbed to record-high levels. Elevated interest rates supported by the Fed’s monetary policy and the turmoil in regional banks earlier this year have underpinned steady inflows into the space. While lower rates could create some headwinds, history suggests it could take significant rate cuts before cash in money market funds finally peaks. For equity markets, higher yields mean a higher bar for capital to crossover back into stocks, especially with the S&P 500’s equity risk premium recently falling to over a 20-year low. However, with many investors underinvested in equity markets during the first half of 2023, we suspect any meaningful pullback in the market would likely bring some cash off the sidelines and into stocks.
IMPORTANT DISCLOSURES
This material is for general information only and is not intended to provide specific advice or recommendations for any individual. There is no assurance that the views or strategies discussed are suitable for all investors. To determine which investment(s) may be appropriate for you, please consult your financial professional prior to investing.
Investing involves risks including possible loss of principal. No investment strategy or risk management technique can guarantee return or eliminate risk in all market environments. For more information on the risks associated with the strategies and product types discussed please visit https://lplresearch.com/Risks
References to markets, asset classes, and sectors are generally regarding the corresponding market index. Indexes are unmanaged statistical composites and cannot be invested into directly. Index performance is not indicative of the performance of any investment and do not reflect fees, expenses, or sales charges. All performance referenced is historical and is no guarantee of future results.
Unless otherwise stated LPL Financial and the third party persons and firms mentioned are not affiliates of each other and make no representation with respect to each other. Any company names noted herein are for educational purposes only and not an indication of trading intent or a solicitation of their products or services.
All information is believed to be from reliable sources; however, LPL Financial makes no representation as to its completeness or accuracy.
Securities and advisory services offered through LPL Financial, a registered investment advisor and broker-dealer. Member FINRA/SIPC.


